


Abstract
The red nucleus (RN) is a pair of small gray matter structures located in the midbrain and involved in muscle movement and cognitive functions. This retrospective study aimed to investigate the metabolism of human RN and its correlation to other brain regions. Methods: We developed a high-resolution semiconductor PET system to image small brain structures. Twenty patients without neurologic disorders underwent whole-brain scanning after injection of 400 MBq of 18F-FDG. The individual brain 18F-FDG PET images were spatially normalized to generate a surface projection map using a 3-dimensional stereotactic surface projection technique. The correlation between the RN and each voxel on the cerebral and cerebellar cortices was estimated with Pearson product-moment correlation analysis. Results: Both right and left RNs were visualized with higher uptake than that in the background midbrain. The maximum standardized uptake values of RN were 7.64 ± 1.92; these were higher than the values for the dentate nucleus but lower than those for the caudate nucleus, putamen, and thalamus. The voxel-by-voxel analysis demonstrated that the right RN was correlated more with ipsilateral association cortices than contralateral cortices, whereas the left RN was equally correlated with ipsilateral and contralateral cortices. The left RN showed a stronger correlation with the motor cortices and cerebellum than the right RN did. Conclusion: Although nonspecific background activity around RNs might have influenced the correlation patterns, these metabolic relationships suggested that RN cooperates with association cortices and limbic areas to conduct higher brain functions.
The red nucleus (RN) is a pair of small gray matter structures located in the midbrain. The RN sends efferent axons to the contralateral spinal cord, forming a route known as the rubrospinal tract (1). The rubrospinal tract mainly controls limb musculature, whereas the pyramidal tract can act on the whole musculature (1). A recent anatomic study indicated that a significant amount of rubrospinal tract is present in the human brain (2). Because neuronal activity of the RN in Parkinson disease is known to be increased during passive and voluntary movements (3), the RN may play a role in the coordination of muscular movement. Cognitive symptoms, such as intellectual fatigability, decreased verbal fluency, and discrete memory impairment, have been reported in relation to RN infarction (4).
Using 3-T MR imaging, Nioche et al. reported a cognitive role of the RN, probably related to salience detection and executive control (5). During the brain resting state, the RN displayed strong functional coherence with associative prefrontal, insular, temporal, and parietal cortices; the thalamus; and the hypothalamus but not with the sensorimotor cortex (5). 18F-FDG PET has been used for correlational analyses of regional metabolic rates to characterize relations among different brain regions (6,7). In general, regional functional correlation of the resting brain can be better demonstrated with 18F-FDG PET than with MR imaging. However, because the low spatial resolution of the clinical PET or PET/CT system has not allowed accurate measurement of metabolism in small structures, the metabolic activity of RN has not been investigated in detail. A brain-dedicated research scanner with superior resolution is required to assess the metabolic activity in the small brain volumes (8–10).
Using a compact semiconductor detector and depth-of-interaction system, we have developed a PET scanner with a high spatial resolution for brain imaging (11–13). The purpose of this study was to investigate the metabolic activity of RN in subjects without neurologic disorder and to investigate the functional correlation of RN with regional cerebral cortical structures, deep structures, and the cerebellum.
MATERIALS AND METHODS
Subjects
This is a retrospective study. Twenty-seven patients with head and neck cancer underwent 18F-FDG PET with a semiconductor scanner in order to evaluate primary cancer lesions before radiotherapy planning from January 2009 to October 2012. We excluded patients with previous brain surgery, dementia, diabetes mellitus, neurologic disorders, and unstable psychiatric conditions. Patients with uncontrollable pain despite use of analgesic drugs were not included. The final study population consisted of 20 patients (15 men; mean age ± SD, 59.2 ± 9.3 y; range, 40–77 y). The Ethics Committee of Hokkaido University Hospital approved the study. Written informed consent was obtained from each patient who participated in this study.
Image Acquisition and Reconstruction
The study protocol required at least 6 h of fasting before injection of 18F-FDG. Patients received a fixed dose of 400 MBq injected intravenously at rest. The mean blood glucose level was 100 ± 16 mg/dL, and the range was 75–130 mg/dL. After the injection, the patient rested comfortably on a sofa for 60 min in a quiet room under dimmed lights. The PET scanning was initiated with a 3-min transmission scan using a point source of 137Cs, followed by a 30-min emission scan in a 3-dimensional manner.
PET images were acquired using a new scanner equipped with cadmium telluride detectors for the detection of γ rays, which were arranged in a 3-layer depth-of-interaction system to improve spatial resolution. This system was developed cooperatively with the Hitachi Ltd. Central Research Laboratory (11,12,14). The energy windows were set at 494–540 keV. The sensitivity of radioactivity was 8.5 kcps/(kBq/mL) at 494 keV. The intrinsic full width at half maximum was 2.3 mm at 1 cm away from the center of the field of view. The images were reconstructed using the iterative reconstruction method integrated with median root prior reconstruction and point-spread function correction. The full width at half maximum after reconstruction was 2.5 mm at 1 cm and 2.9 mm at 10 cm in a transaxial slice. The matrix size, pixel size, and slice thickness were 256 × 256, 1.2 × 1.2 mm, and 2.6 mm, respectively.
Image Processing and Data Analyses
Reconstructed PET images were displayed as a parametric image of the standardized uptake value (SUV). SUV was calculated as [tissue radioactivity concentration (Bq/mL)] × [body weight (g)]/[injected radioactivity (Bq)]. For the correlational analyses, regional SUVs were normalized with the individual global mean brain SUV to generate an SUV ratio (SUVR) in order to eliminate systemic bias due to interindividual SUV differences. Regions of interest (ROIs) were manually defined for RN under the guidance of coregistered anatomic images (CT or MR imaging). A circular ROI of 7 mm in diameter was drawn on 3 adjacent slices to enclose the right and left RNs, respectively (i.e., a total of 6 ROIs for each patient). Metabolic activity of the RN was measured using the maximum SUV (SUVmax) and maximum SUVR (SUVRmax) to compensate for their smaller sizes. ROIs were also placed for other deep brain structures, including the thalamus, caudate nucleus, putamen, and dentate nucleus. For the cortical cerebral regions, the SUV and SUVR images were spatially normalized to the standard human brain atlas, followed by 3-dimensional stereotactic surface projection processing to extract regional cortical values using the NEUROSTAT package, which was initially developed by Minoshima et al. at the University of Michigan and is now available as a free download from the University of Washington (15,16). The global mean brain SUV mentioned above was calculated by averaging all the voxels on the 3-dimensional stereotactic surface projection image.
Statistical Analysis
The differences in SUVmax and SUVRmax between RN and other deep brain structures were tested using 2-sided paired t tests. The regional metabolic correlations between RN and cerebral cortices were investigated using Pearson product–moment correlation coefficients in a voxel-by-voxel manner. A voxel having a P value of less than 0.01 (i.e., z score > 2.58 for 2-sided tests) was considered to indicate the level of statistical significance. Multiple comparisons were corrected using a method of Benjamini and Hochberg (17). False-discovery rates were marked at 0.05, 0.10, and 0.20.
RESULTS
SUVmax of RN and Deep Brain Structures
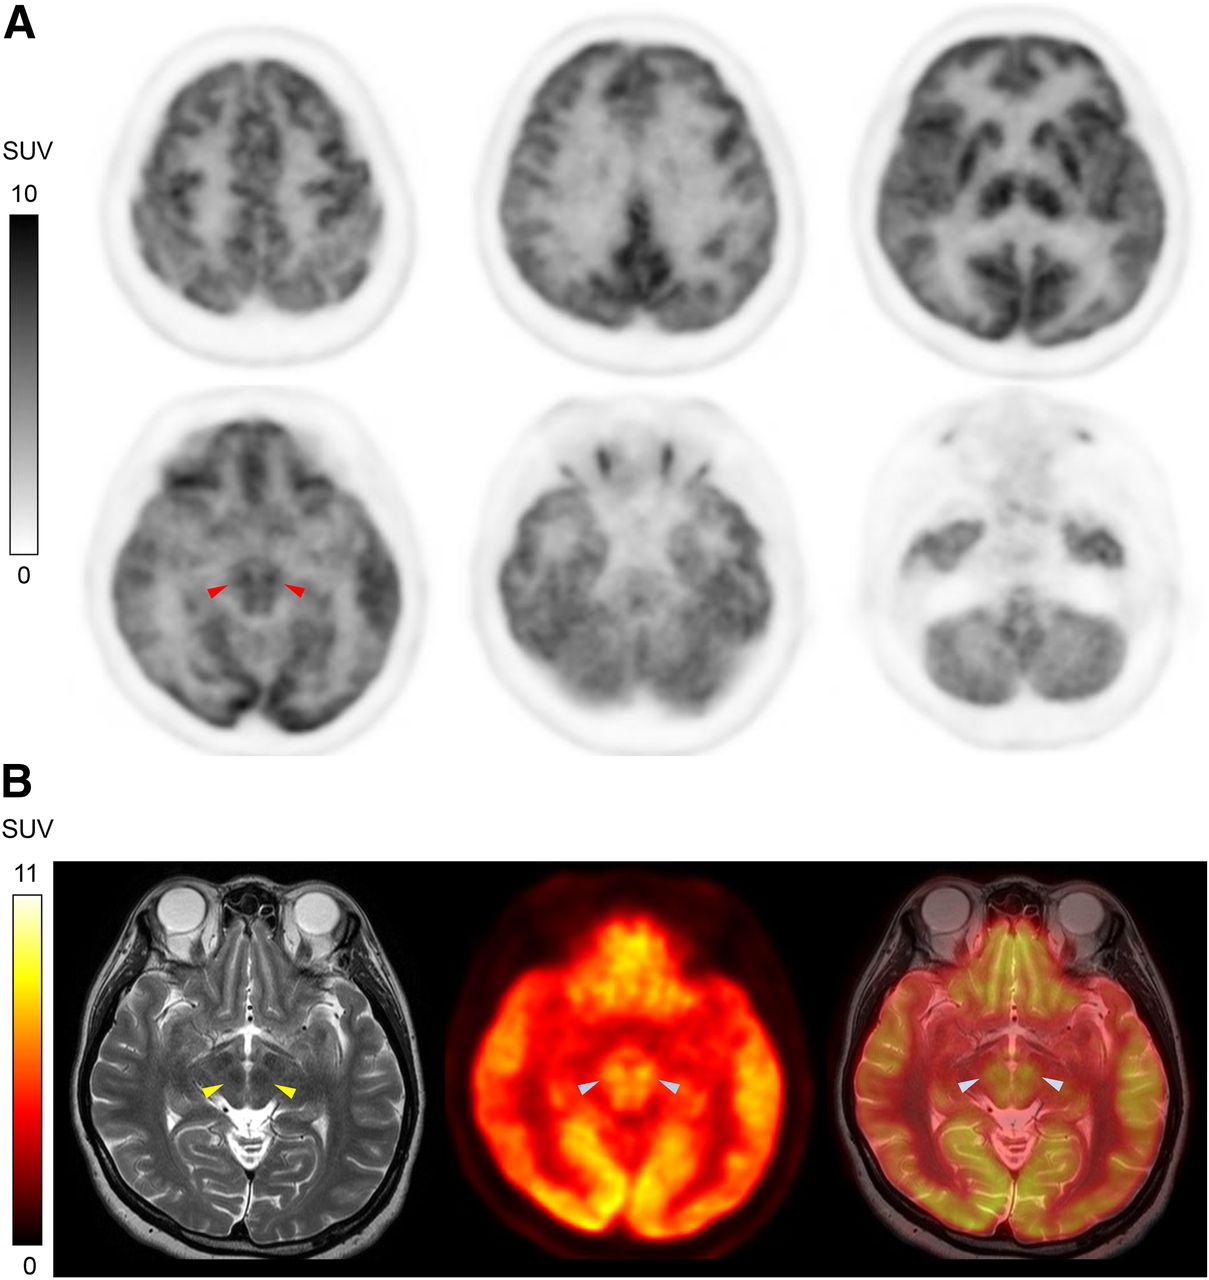
RNs were visualized as a symmetric pair of small nodular activities higher than the background midbrain activity (Fig. 1). Regional 18F-FDG uptake in the RNs was 20%–22% higher than the global mean 18F-FDG uptake, corresponding to an SUVRmax of 1.20 (right RN) and 1.22 (left RN). In quantitative analyses using SUVmax, the metabolic activities of the RNs (7.64 ± 1.92) were higher than those of the dentate nucleus (6.63 ± 1.47, P < 0.001) and lower than those of the caudate nucleus (8.69 ± 2.75, P < 0.01), putamen (10.07 ± 2.92, P < 0.001), and thalamus (8.87 ± 1.86, P < 0.001).

A representative case. (A) Bilateral RN indicates areas of higher metabolism (arrowheads). (B) Coregistration with T2-weighted MR images confirmed that high 18F-FDG uptake corresponded to low-signal-intensity areas in midbrain, indicating RN (arrowheads).
Metabolic Correlation Between RN and Cortical Brain Regions
The right RN was metabolically correlated with more areas in the ipsilateral supratentorial regions than in the contralateral regions (Fig. 2A; Table 1). Specifically, the metabolic activities of the right RN were significantly correlated with the bilateral prefrontal cortex, temporal cortex, limbic lobes, and ipsilateral parietal cortex. The right RN was symmetrically correlated with the bilateral cerebellum. The right RN did not correlate with the sensorimotor cortex of either hemisphere.

Metabolic correlations between right RN and surface brain areas (A) and left RN and surface brain areas (B). Degree of correlation is represented by z score.
Results of Voxel-by-Voxel Correlation with Right RN
In contrast, metabolic activities of the left RN were symmetrically correlated with relatively limited areas of the bilateral supratentrial regions (Fig. 2B; Table 2). Specifically, the left RN was significantly correlated with the bilateral prefrontal cortex, limbic lobes, contralateral temporal cortex, and ipsilateral parietal cortex. Unlike the right RN, the left RN was significantly correlated with the bilateral sensorimotor cortices. In addition, compared with the right RN, the left RN was correlated with the larger areas of bilateral cerebellum.
Results of Voxel-by-Voxel Correlation with Left RN
DISCUSSION
In subjects without neurologic disorders, the level of metabolic activity in the RN is higher than the global mean metabolic activity, allowing visual assessment of the RN with the semiconductor PET system. Investigation of the metabolic activity at the resting state revealed the regional association between the RNs and supra- and infratentorial surface regions. Specifically, the right RN showed stronger laterality of correlation, particularly with the ipsilateral association cortices, whereas the left RN demonstrated more symmetric correlations with both association and sensorimotor cortices. The left RN showed stronger correlations with the bilateral cerebellum than the right RN.
This is the first investigation of regional cerebral glucose metabolism using our semiconductor PET system. The mean global SUV in the present study population was 6.3 ± 1.4 and showed slightly larger variations than the previously reported values obtained with conventional clinical whole-body PET scanners (18,19). The larger variations may have been due to the heterogeneity of our study group, which consisted of head and neck cancer carriers, or to the sensitivity profile of the semiconductor scanner, which is slightly different from that of the clinical system (11,12). Because the semiconductor detector is characterized by higher spatial resolution and lower photosensitivity than conventional scintillators, the reconstructed images of the semiconductor scanner are thought to have larger variations. We adopted a relatively long emission acquisition time (i.e., 30 min) to compensate for the lower sensitivity of the detectors. Conversely, the high spatial resolution of our system was highly advantageous for the evaluation of small brain structures. In the present study, we investigated the metabolic activity of the RN because its physiologic role has not been established in humans. We found that the resting glucose metabolism of the RN was lower than that of other deep brain structures, except for the dentate nucleus, and the right and left RNs did not show significant laterality. We also found high correlation values of metabolic activity between the RNs and other deep brain structures. Considering their role in motor coordination, RNs are expected to show physiologic correlations with other deep brain structures. Although the high resolution of our new scanner may positively affect the counting in the deep brain structures, it is unlikely to affect the correlation among the deep brain structures. Our results were in line with the previous investigations using a high-resolution ECAT HRRT scanner (CTI/Siemens) (9) and functional MR imaging (fMRI) (5).
Unlike the previous investigation, however, our study revealed functional correlations between the RNs and association cortices. The current report is, to our knowledge, the first to reveal metabolic correlation between RNs and other brain regions. Using an fMRI, Nioche et al. investigated a similar functional association between RNs and other cortical structures and suggested possible networks in which the RNs and the cerebral association areas are involved (5). The results of the present study are in line with theirs from the standpoint that the RNs had a functional network with associative cortical and limbic areas. On the other hand, our observations were slightly discordant with the results of Nioche et al. in that we did not find a significant correlation between the RN and occipital cortex (5). The reason for this discordance is not clear, but we speculate that the slight difference in study protocols might have been responsible. In the present study, the subjects were placed in a dim room during the uptake of 18F-FDG, whereas in the investigation by Nioche et al. the study subjects were asked to close their eyes during MR scanning. In general, fMRI has higher temporal resolution and thus can visualize rapid changes in regional blood flow, whereas 18F-FDG PET measures glucose metabolism averaged over a postinjection period. However, unlike other MR imaging techniques, the blood oxygenation level–dependent fMRI is significantly limited by poor spatial resolution, low signal levels and contrast, and image artifacts (20). 18F-FDG PET is a feasible method for steady-state evaluation under a resting condition, because it is more independent from the imaging conditions and physical stimuli (e.g., environmental noise, light, and anxiety), which may temporally activate regional brain function. Therefore, the concordance between the present PET results and their fMRI findings may suggest a role of RNs in higher brain functions in addition to the known link with the rubrospinal tract to control muscular structures (21).
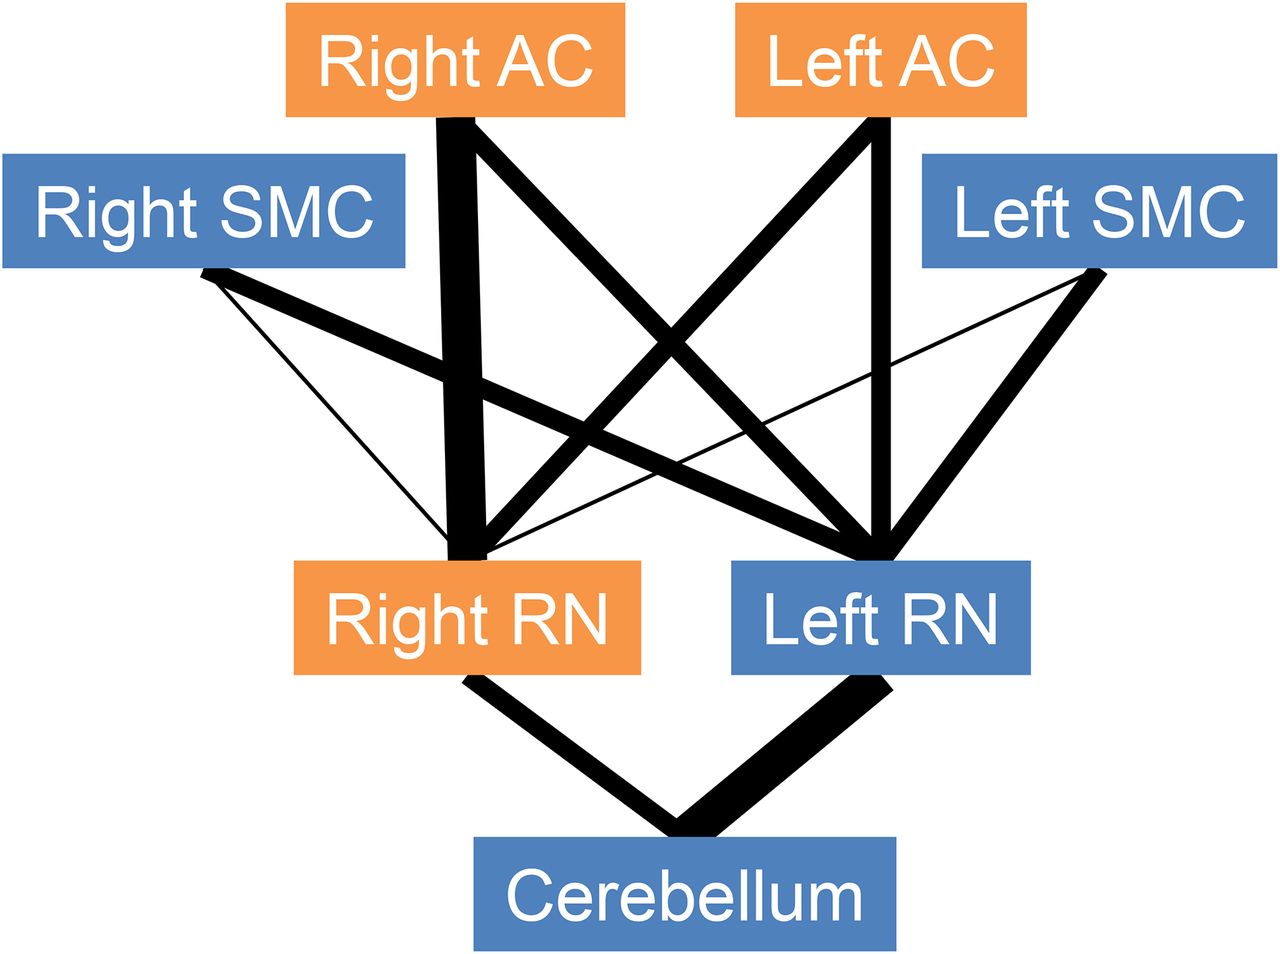
Interestingly, the present results indicated a difference in the correlation trends between the right and the left RNs. As shown in Figure 2, the right RN showed stronger laterality, particularly in the association cortices, whereas the left RN demonstrated relatively symmetric correlations with both association and sensorimotor cortices. The left RN correlated with the larger areas of bilateral cerebellum than the right RN did. The right cerebral hemisphere is known to be dominant in terms of social–emotional functioning (22). In addition, several previously reported findings suggest that the right frontal lobe is responsible for the alerting/arousal vigilance function and exerts bilateral influences on arousal (22). We observed that the right RN was more correlated with the right association cortex than with the left association cortex, suggesting that the right RN partly cooperates with the right association cortex in social–emotional and alerting/arousal functions. In contrast, the left RN is more correlated with the sensorimotor cortex and cerebellum than the right RN is, indicating that the left RN plays more roles in motor function than the right RN does. These hemispheric differences in motor and nonmotor functions probably define the asymmetrical correlations between the right and the left RNs. These unexpected results were based on a visual inspection, which was not confirmed by statistical analyses. We consider the current results are unlikely to indicate simple statistical variance, because not only a single voxel but also several voxels belonging to the same regions showed similar trends. However, nonspecific background activity around RNs may contribute to the asymmetrical pattern of correlation. Although these findings raised the possibility that the right and left RNs are involved in different neural networks (Fig. 3), further investigation will be required to confirm the functional laterality.

Scheme of possible neural networks. Width of lines represents degree of association between 2 regions. Right RN is more involved in social–emotional networks (orange regions), whereas left RN is more involved in motor function networks (blue regions). Right AC is known to be more responsible for social–emotional and alerting/arousal vigilance functions than left AC. AC = association cortex; SMC = sensorimotor cortex.
We need to mention several limitations of this study. First, the control group did not consist of healthy volunteers. The present study population was collected from a study that was approved for head and neck cancer patients. To eliminate the possible bias due to heterogeneous study population, we carefully excluded patients with suspected brain diseases. Despite this exclusion, the population included 9 patients using analgesics (nonsteroidal antiinflammatory drugs or oxycodone) and 2 patients using psychiatric medication (milnacipran hydrochloride or etizolam). These medications might have affected brain metabolisms (23–25); however, they would not affect the neural network connecting RN with other brain regions. Some may still argue that cancer patients tend to spend more hours in bed than healthy people, and thus they may have decreased metabolism in the motor cortices and relatively increased metabolism in the association cortices. However, our head and neck cancer patients were able to walk by themselves, and thus we consider that their regional brain metabolisms were not significantly different from those of healthy individuals. Second, because this study was retrospectively conducted, we were not able to collect information about the dominant hands of the subjects. All the subjects included in this study were racially Japanese, thus 92.8% of the subjects were considered to be right-handed (26). In addition, 96% of right-handed people and 76% of left-handed people have left-hemisphere dominance for language (27), meaning that about 95% of the Japanese people have left-hemisphere dominance. From this point of view, information on the dominant hands would hardly have improved the accuracy of analysis. Third, regional metabolism was not quantified. The quantification of regional metabolism involves the invasive procedure of arterial sampling and requires much time (normally, 60-min dynamic scanning). Instead, we statistically analyzed the static 18F-FDG PET images that had higher signal-to-noise ratios than the dynamic images. To minimize the intersubject variability of SUV, we normalized SUV to global activity to calculate SUVR.
Finally, this study implicated the feasibility of using the semiconductor scanner to measure the metabolism of RN. Previous studies suggested that the rubrospinal system may be important for recovering motor function after pyramidal tract injury in humans (28–30). Therefore, the measurement of RN metabolic activity may be useful to estimate the prognosis of functional recovery after pyramidal tract injury.
CONCLUSION
The high-resolution semiconductor PET enabled visual and semiquantitative evaluation of the regional metabolic activity of the RN. Investigation of the metabolic activity under a resting state revealed the cortical functional association and slight difference between the right and left RNs. The RN was considered to be functionally associated not only with the rubrospinal tract for control of muscular structures, but also with association cortex and limbic areas in higher brain functions.
DISCLOSURE
The costs of publication of this article were defrayed in part by the payment of page charges. Therefore, and solely to indicate this fact, this article is hereby marked “advertisement” in accordance with 18 USC section 1734. This work was supported in part by Creation of Innovation Centers for Advanced Interdisciplinary Research Areas Program, Ministry of Education, Culture, Sports, Science and Technology, Japan, and Matching Program for Innovations in Future Drug Discovery and Medical Care at Hokkaido University. This work was also supported in part by a grant-in-aid from the Japan Society for the Promotion of Science (#24700999) and by SNMMI Wagner-Torizuka Fellowship 2013/2015. No other potential conflict of interest relevant to this article was reported.
Footnotes
Published online Jun. 4, 2015.
- © 2015 by the Society of Nuclear Medicine and Molecular Imaging, Inc.
REFERENCES
- Received for publication December 13, 2014.
- Accepted for publication May 28, 2015.


