


Abstract
Detection of relapse after completion of therapy in patients with Hodgkin’s disease (HD) and non-Hodgkin’s lymphomas (NHL) constitutes an important challenge in modern medical imaging. An accurate assessment of the presence of residual disease is essential to determine which patients would benefit from additional therapy. The objective of this study was to assess the diagnostic accuracy of 18F-FDG PET in detecting residual disease or relapse during the posttherapy period in patients with HD in comparison with CT. We also established different predictive values for 18F-FDG PET according to the time interval between the end of therapy and the PET study. Methods: Forty-eight patients with HD underwent 18F-FDG PET after the completion of chemotherapy (median, 58 d) between March 1999 and April 2002. Disease-free intervals and proportions were calculated using the Kaplan–Meier method. Standardized uptake values of the most active lesion in each patient with a positive study were also measured. PET and CT results were compared with clinical follow-up, with relapse being defined by a positive biopsy or the introduction of a second-line treatment. Results: Thirty-four patients were still disease-free during a mean follow-up of 605 d. Fourteen patients relapsed during a mean follow-up of 197 d. The sensitivity and specificity of 18F-FDG PET to predict relapse were 79% and 97%, respectively. The positive predictive value and the negative predictive value were both equal to 92%. The diagnostic accuracy of 18F-FDG PET (92%) was significantly higher than the accuracy of CT (56%) (P < 0.0005). Patients with positive 18F-FDG PET also had a far shorter median disease-free interval (79 d) than those with positive CT (disease-free proportion of 52% at 1,143 d) (P = 0.0046). The 3 cases of false-negative 18F-FDG PET studies that we observed occurred in patients who underwent their PET study within the first 49 d after the end of chemotherapy. Conclusion: Positive 18F-FDG PET after the end of therapy in HD patients is a strong predictor of relapse. A negative PET study is also an excellent predictor of good prognosis. The diagnostic accuracy of 18F-FDG PET to assess the presence of residual disease after therapy is superior to that of CT.
Hodgkin’s disease (HD) is one of the most common malignant neoplasms in young Americans. Eight thousand new cases are reported annually in the United States, with an incidence of 3 per 100,000 population and an average age of 32 y at diagnosis (1,2). It has a bimodal age distribution with a peak in the late 20s and a second peak after the age of 50 y. HD also has significant clinical differences compared with non-Hodgkin’s lymphomas (NHL): HD is more commonly localized to a single group of nodes in the cervical, mediastinal, or paraaortic regions and rarely involves mesenteric nodes, the Waldeyer ring, or extranodal structures.
With modern treatment protocols, tumor burden (i.e., stage) rather than histologic subtype is the most important prognostic variable. The current 5-y survival is close to 90% for stages I and IIA. Even in cases of advanced disease, stages IVA and IVB, the 5-y survival can be as high as 70% (1,2). Consequently, long-term effects of chemotherapy and radiotherapy (secondary cancers, pulmonary fibrosis, and accelerated atherosclerosis) are now becoming a major concern. Judicious use of chemotherapy and radiotherapy can be greatly facilitated by modern diagnostic imaging modalities.
18F-FDG PET is now a well-recognized diagnostic tool used for staging and monitoring response to therapy in lymphomas (3–6). The advantages of 18F-FDG PET technology over conventional diagnostic imaging methods are particularly obvious in the postchemotherapy period. Up to 64% of patients demonstrate residual abnormalities on CT after completion of therapy, but only 42% of those patients will relapse on follow-up (7–9). This is primarily caused by inability of CT to distinguish viable tumor tissue from fibrosis.
Several studies have been published that address the effectiveness of therapy monitoring and assessment for tumor recurrence with 18F-FDG PET in HD and NHL (3,4,6,9). However, most of these studies included cases of HD and NHL without distinction, which is of utmost importance to the referring oncologists, considering their differing treatment and clinical outcome. Two studies analyzed the role of 18F-FDG PET in cases of HD as a single population after therapy, but neither of these studies assessed the importance of the time interval between the end of treatment and 18F-FDG PET (10,11).
In this study, our objectives were to determine the value of 18F-FDG PET in predicting relapse in relation with the time intervals between the end of chemotherapy and the PET study. We also compared these results to those obtained with conventional diagnostic imaging (CT). Disease-free intervals were also calculated with respect to the standardized uptake values (SUVs) of the most active lesion in patients with positive PET studies.
MATERIALS AND METHODS
Patients
Forty-eight patients (24 males, 24 females) with biopsy-proven HD according to the recent World Health Organization classification were retrospectively included in this study. The patients’ characteristics are listed in Table 1. These patients consecutively underwent an 18F-FDG PET scan between March 1999 and April 2002 for restaging at the completion of chemotherapy. The median age was 38 y (age range, 17–78 y). At diagnosis, on the basis of the Ann Arbor clinical stage, 2 patients presented with stage I, 23 with stage II, 15 with stage III, and 8 with stage IV. Seventeen patients received chemotherapy alone (mean number of cycles, 7) with either mustargen, vincristine (oncovin), procarbazine, and prednisone (MOPP) or adriamycin, bleomycin, vinblastine, and dacarbazine (ABVD) protocols (12), and 31 had additional radiation therapy (17 underwent radiation therapy before PET imaging, 14 after PET imaging). The median time interval between the last course of chemotherapy and the PET study was 58 d. One patient had his PET study just before his last cycle of chemotherapy. In this case, the time interval was assumed to be 0.
Patient Characteristics
The long-term follow-up evaluations after treatment were extracted from the patients’ medical files. A relapse was defined as either biopsy-proven (n = 6) evidence of residual lymphoma or introduction of second-line chemotherapy.
PET
PET was performed using an ECAT EXACT HR+ scanner (Siemens Medical Systems) with attenuation correction using rotating 68Ge rod sources. Two-dimensional acquisitions were made from the neck to the upper part of the thighs 60 min after intravenous administration of 7.5 MBq/kg of 18F-FDG. All patients had to fast at least 6 h before the study. The capillary blood glucose level was monitored for hyperglycemia in all patients. Diabetic patients were asked not to use subcutaneous rapid-onset insulin on the day of the study. In hyperglycemic patients (with capillary glucose levels, >7.5 mmol/L), an intravenous bolus of Humulin R insulin (Eli Lilly) was injected according to a preestablished chart at least 60 min before the 18F-FDG injection to reduce the blood glucose level without increasing muscle uptake. The acquisition times were 5–7 min for the emission scan and 3 min for the transmission scan for each bed position, with a typical body coverage of 5–7 bed positions from the neck to the upper femurs. Scans were reconstructed using the ordered-subset expectation maximization algorithm (2 iterations/16 subsets) in a 128 × 128 matrix with a gaussian filter (8-mm full width at half maximum) and were reoriented in transverse, coronal, and sagittal planes. All images were qualitatively reviewed by an experienced investigator with access to clinical data. Intravenous furosemide (40 mg) was given to patients when suspicious foci of 18F-FDG uptake were visible in the pelvic area to minimize interfering urinary activity. These patients had a second imaging study centered on the pelvis approximately 45 min after the furosemide administration. All foci of elevated 18F-FDG uptake not explainable by physiologic uptake (i.e., brain, myocardium, urinary tract, digestive tract, muscles) were considered to represent viable lymphoma. The PET studies were classified as positive or negative. The standardized uptake value (SUV) was measured at the most active lesion in patients with positive PET studies. A region of interest (ROI) with a diameter corresponding to 75% of the maximal lesion activity was used. This threshold was used to reflect the most active part of the tumor and to ensure consistent ROI drawings. The SUV measurements were also normalized for actual body weight.
CT scans of the pelvis, abdomen, or thorax were obtained using a SOMATOM Plus 4, fourth-generation helical scanner (Siemens Medical Systems), in 32 patients. Slices were obtained at 8-mm intervals for thoracic studies and 5-mm intervals for abdominal and pelvic studies. Intravenous contrast material (100–120 mL of nonionic contrast medium) was used in all patients. Experienced radiologists interpreted the scans. Any lymph node >1 cm in diameter was considered positive for residual lymphoma.
Statistical Analysis
Disease-free intervals and proportions were calculated with the Kaplan–Meier method. Comparisons between groups were made using the log- rank test. All other comparisons were made using the Fisher exact test. The analyses were performed with GraphPad Prism version 3.00 for Windows (GraphPad Software).
RESULTS
Of the 48 posttherapy 18F-FDG PET studies performed, 12 (25%) were interpreted as positive. Eleven (92%) of the 12 patients with positive studies eventually relapsed on follow-up (Table 2). The median follow-up duration between the end of chemotherapy and relapse for these 11 patients was 59 d and the median interval between the 18F-FDG PET studies and the last cycle of chemotherapy was 20 d. One patient with a positive 18F-FDG PET study did not relapse. In this case, the study, performed 101 d after the last course of chemotherapy, demonstrated a residual focal 18F-FDG uptake of weak intensity with poorly defined margins in the anterior mediastinum. Even though a benign etiology could not be conclusively ruled out, the PET study was considered suspicious for residual lymphoma. A CT scan was also obtained concurrently and demonstrated an important residual mass in the anterior mediastinum measuring 4.5 × 4.0 × 1.4 cm. Baseline CT and PET scans had both clearly shown mediastinal involvement. The PET scan was repeated 6 mo later to assess whether there was any disease progression. The previously described lesion was no longer visualized and was retrospectively attributed to either focal thymic hyperplasia or benign inflammatory nodes.
Relationships Between PET Scan Results, Clinical Outcome, and Predictive Values
Among the 36 patients with negative studies, 3 (8%) relapsed on follow-up (Table 2). One patient had residual mediastinal masses on CT after treatment. A posttherapy PET scan, performed 29 d after the end of chemotherapy, had not revealed any residual disease. A second PET study obtained 1 y later demonstrated the presence of a small 1-cm hypermetabolic node in the left subclavicular area. A correlative neck CT scan was inconclusive at this site because of streak artifacts generated by an injection port implanted close by. Disease progression in this area eventually became obvious on follow-up PET and clinical examinations. The second patient underwent his PET study 49 d after completion of chemotherapy and he relapsed 352 d later. A PET scan obtained as part of his follow-up eventually revealed 2 recurring hypermetabolic nodes in the right common iliac chain. These lesions were also documented on CT. In the third case, the PET scan was performed 3 d before the last cycle of chemotherapy. Relapse occurred 301 d later. The patient presented with recurrent B symptoms. A repeated PET scan then showed an important supradiaphragmatic relapse with extensive bilateral cervical, paratracheal, and mediastinal nodal involvement.
Relapses were significantly more frequent in positive 18F-FDG PET patients than in negative 18F-FDG PET patients (2-tailed P < 0.0001). As shown in Figure 1 with the Kaplan–Meier method, the median disease-free interval was 79 d for patients with positive 18F-FDG PET, whereas the disease-free proportion was 89% at 1,861 d (after treatment) for patients with negative 18F-FDG PET (P < 0.0001). The hazard ratio (slope ratio) between the 2 curves was 19.5.
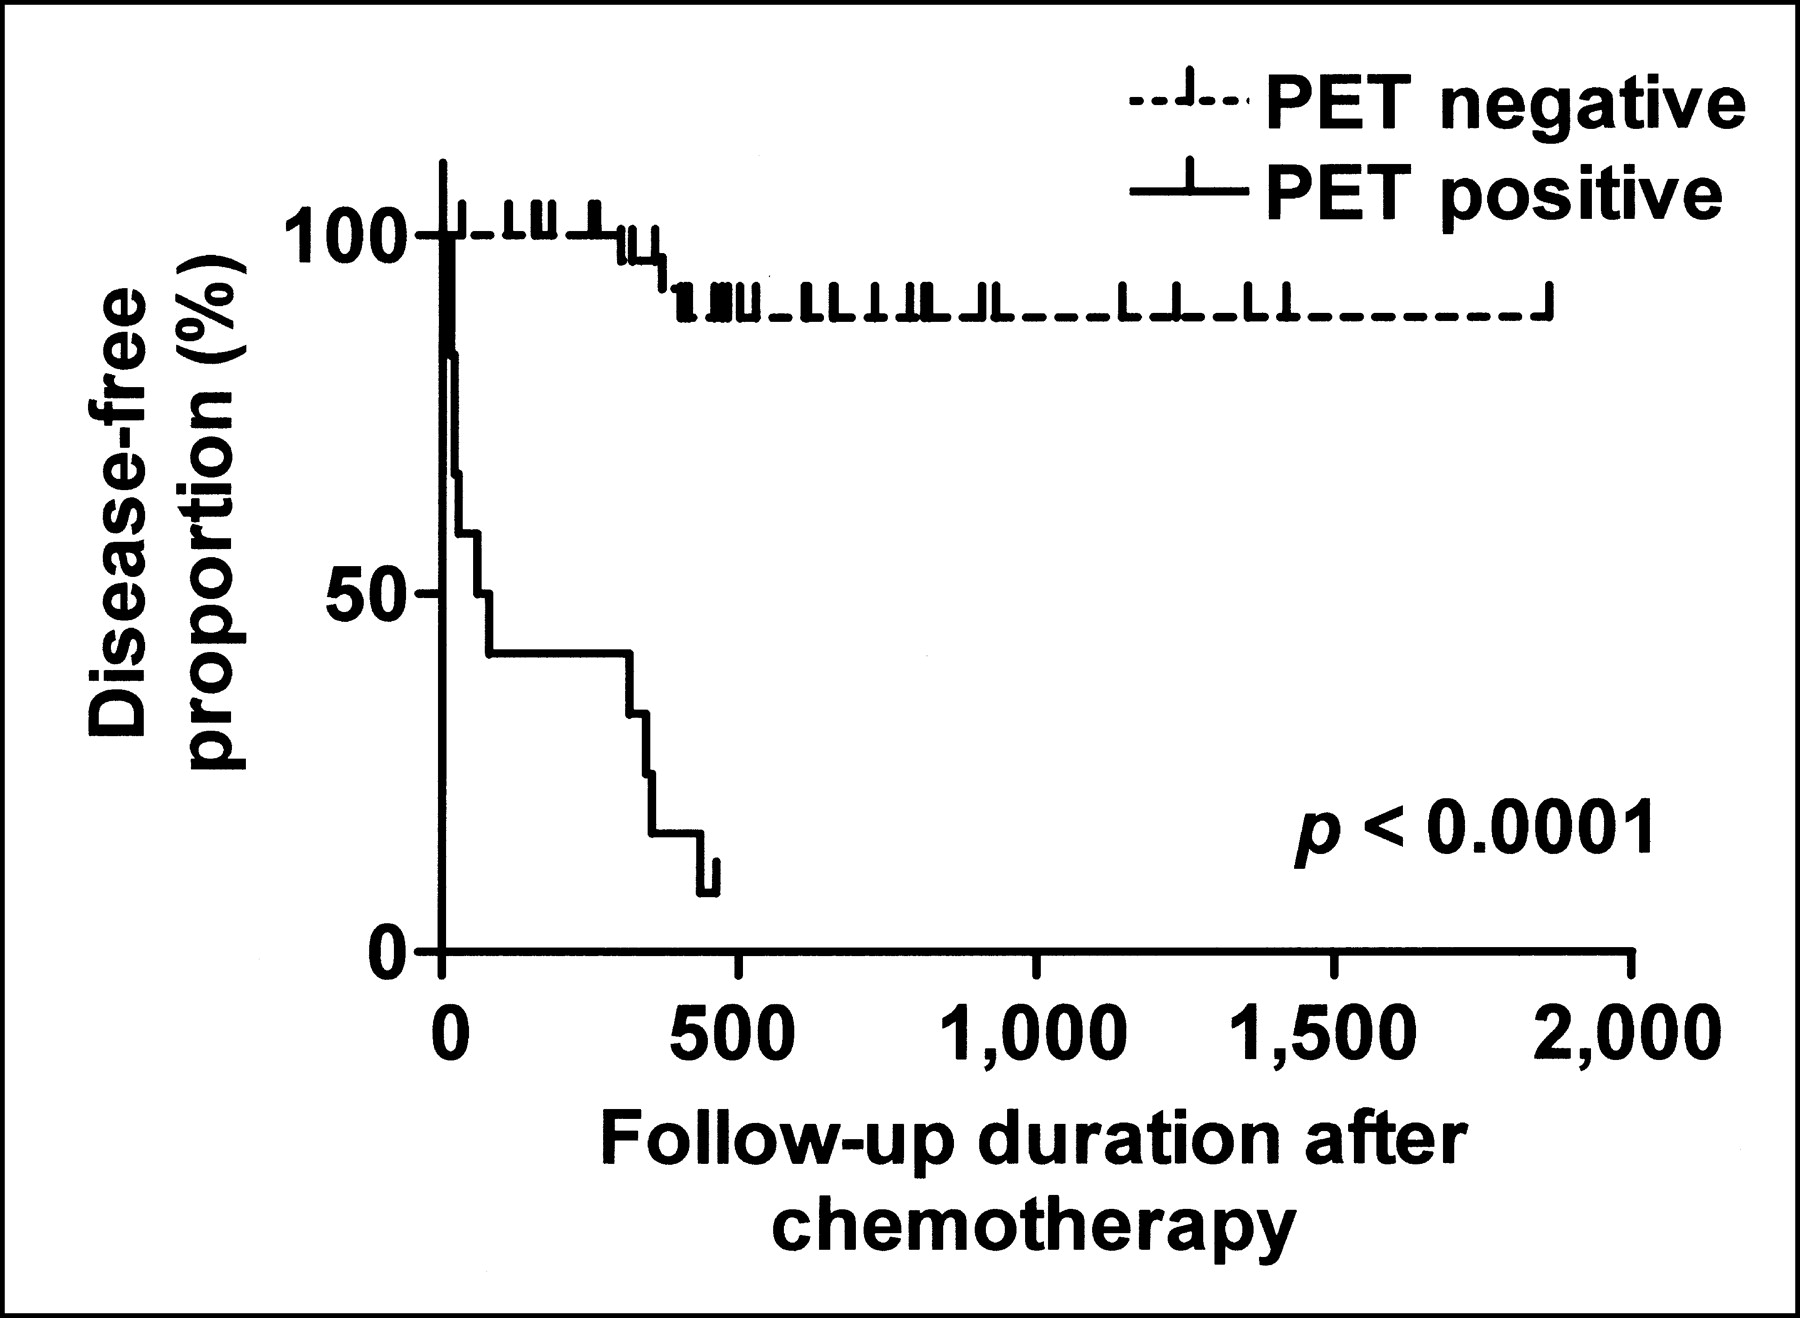
Kaplan–Meier estimate of disease-free interval in 36 patients with negative 18F-FDG PET and 12 patients with positive 18F-FDG PET. Time intervals are in days.
With further subdivision of the time interval between the end of chemotherapy and the PET study (Fig. 2A and 2B), the median disease-free interval remained significantly shorter in patients with positive 18F-FDG PET (P < 0.01 for time intervals 0–30, 31–90, and 91–365 d). A comparison could not be performed in the group corresponding to the >365-d time interval (between the end of chemotherapy and the PET study) because all patients in this group had negative PET studies. Subdividing the patients according to their initial Ann Arbor clinical stage yielded similar results, with the median disease-free interval still being significantly shorter in patients with positive 18F-FDG PET (P < 0.05 for stages II–IV). Because of the presence of only 2 patients with stage I disease, a comparison was not made in this group.

Kaplan–Meier estimate of disease-free interval. 18F-FDG PET was performed in first 30 d after chemotherapy (A) and 91–365 d after chemotherapy (B). Time intervals are in days.
Radiation therapy was used in a substantial proportion of patients (31/48). The proportion of use in patients with residual disease was not significantly different from the proportion of use in patients with no disease progression (8/14 and 23/34 for patients with and without disease, respectively; McNemar test, P = 0.52). The predictive accuracy of 18F-FDG PET was not affected whether radiation therapy was used before or after PET (accuracy, 16/17 and 14/14, respectively; McNemar test, P = 1.0). In the group that had radiation therapy after PET, 4 of 14 patients had positive PET scans. Despite the fact that radiation was administered after PET imaging, these 4 patients eventually relapsed on follow-up.
SUVs of the most active lesion in patients with positive 18F-FDG PET ranged from 1.78 to 14.09. Only 1 patient with a positive PET study could not be included in the analysis. The lower part of his PET study, which demonstrated recurrent disease in the right lower limb, was acquired without attenuation correction. The mean SUV of all patients was 6.06 ± 4.21. The median SUV was 4.16 and was chosen as a cutoff value to create 2 groups: a high-SUV (>4.16) group and a low-SUV group (≤4.16). Using the Kaplan–Meier and the log-rank tests, no statistical difference (P = 0.6656) was observed between the 2 groups relating to the rapidity of relapse. The patient whose SUV of the most active lesion was 4.16 was arbitrarily included in the low-SUV group. Including this patient in the high-SUV group rather than the low-SUV group did not generate any significant difference between the 2 curves.
Comparison Between 18F-FDG PET and CT
Sensitivity, specificity, and negative and positive predictive values for 18F-FDG PET and CT are listed in Table 3. In 48 patients, the sensitivity of PET was 79% and the specificity 97%, with an overall accuracy of 92%. In a subset of 32 patients who also had CT after chemotherapy, the sensitivity of CT was 83%, the specificity 40%, and the accuracy 56%. Note that 16 patients had PET, but not CT, as the sole imaging modality at the end of chemotherapy. If we excluded those patients from the calculations, the sensitivity of PET would have been 92% and the specificity 95%, with an overall accuracy of 94% (30/32). A comparison between patients with positive 18F-FDG PET and patients with positive CT (Fig. 3) demonstrates a significantly lower disease-free proportion for patients with positive 18F-FDG PET (by the Kaplan–Meier method): 8% disease-free proportion at 15 mo with positive 18F-FDG PET and 52% disease-free proportion at 38 mo with positive CT (P = 0.0046). However, no significant difference was observed between disease-free proportions for patients with negative 18F-FDG PET or negative CT: Disease-free proportions at 62 mo after chemotherapy were 89% and 80%, respectively (P = 0.2075).
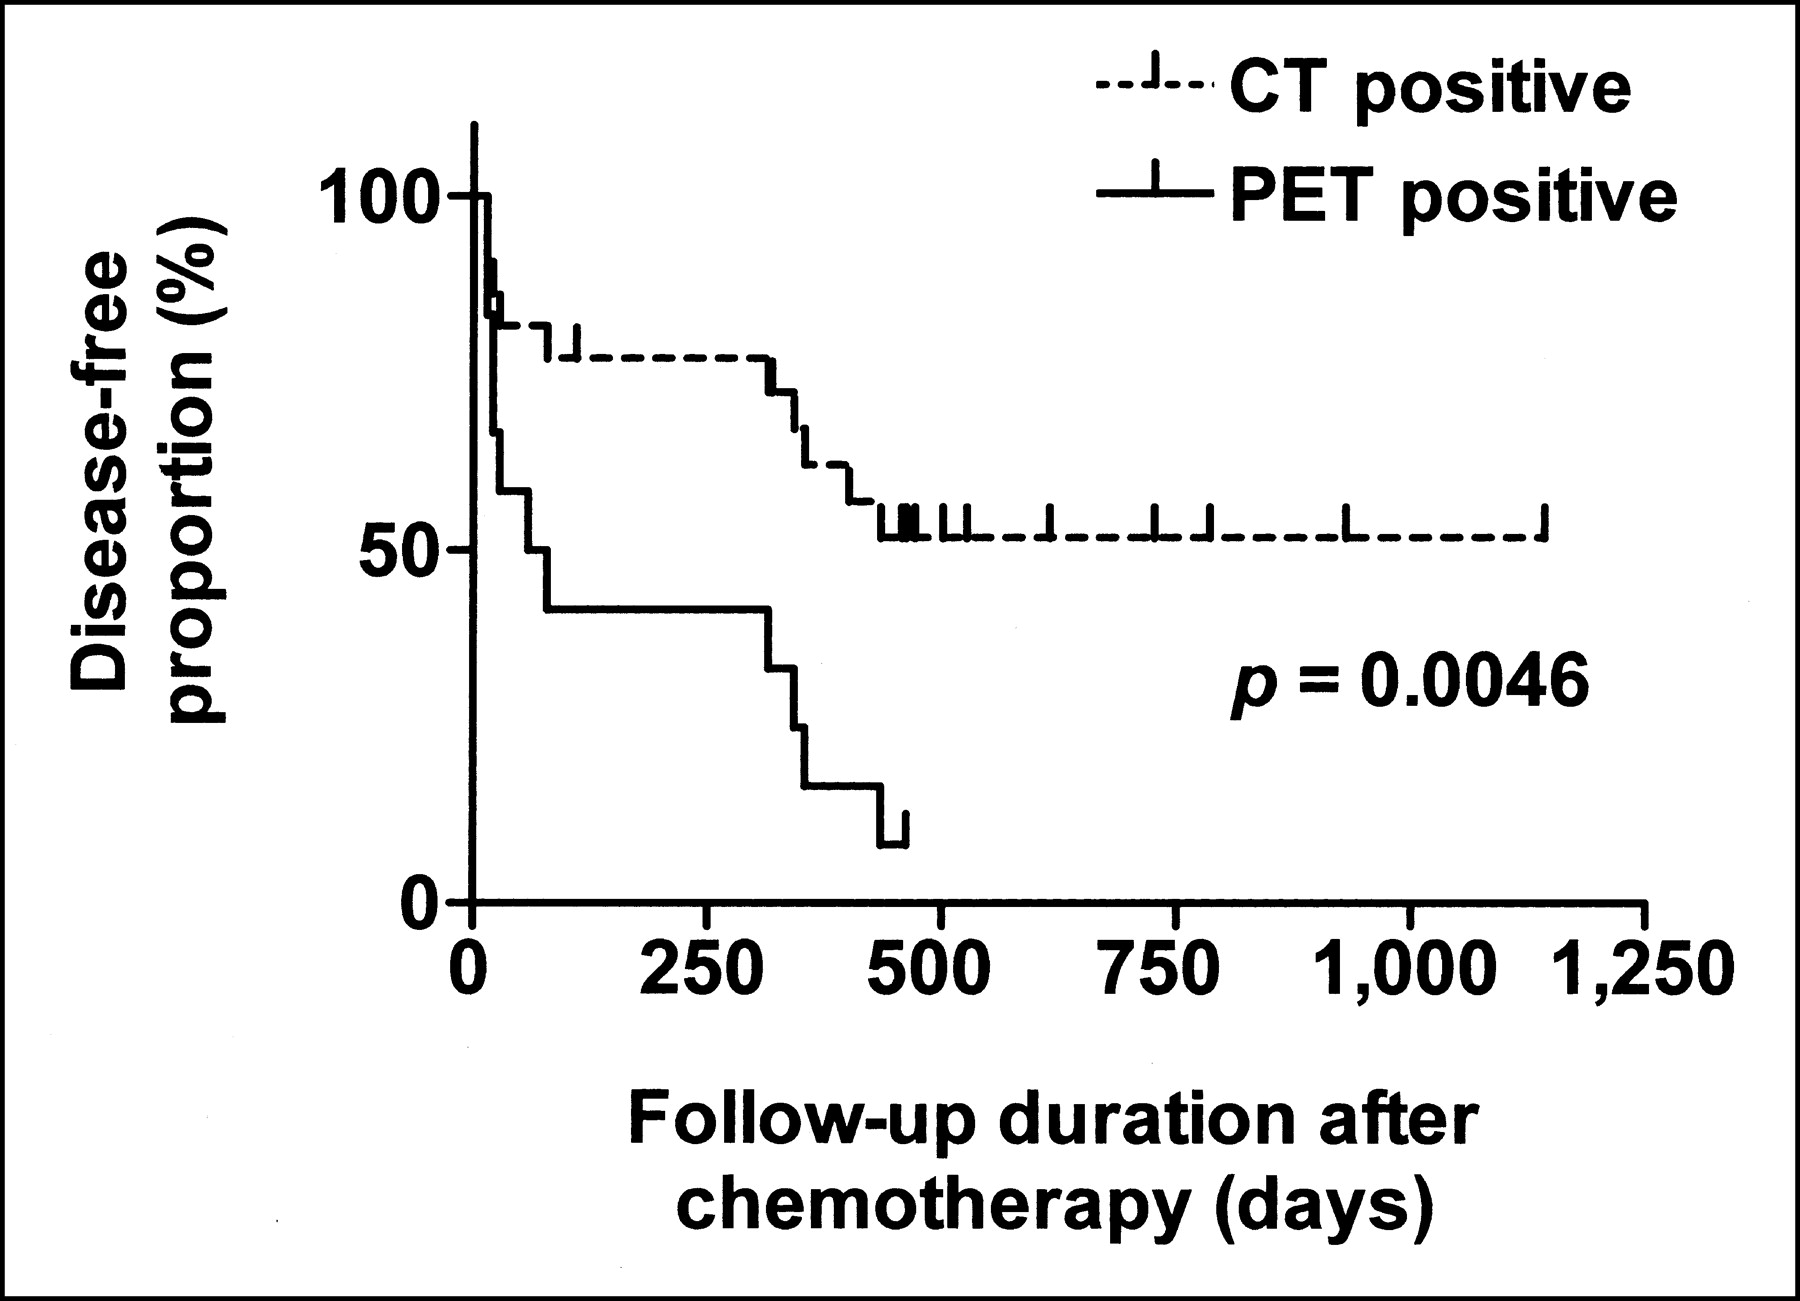
Kaplan–Meier estimate of disease-free interval in patients with positive CT or 18F-FDG PET studies. In patients with either negative CT or PET study, survival curves were almost identical and showed very low rate of relapse. Time intervals are in days.
Comparison Between 18F-FDG PET and CT
In the only case of false-positive 18F-FDG PET (which showed an abnormality in the mediastinum), CT was also falsely positive. In 1 case of false-negative 18F-FDG PET (with relapse in the right common iliac chain), CT was falsely negative as well. In the other 2 cases of false-negative 18F-FDG PET, no concurrent CT scans were available.
DISCUSSION
Commonly used imaging techniques for restaging and follow-up after chemotherapy in HD include 67Ga scanning and CT. 67Ga scintigraphy has been reported to have a sensitivity of 76%–100% and a specificity of 75%–96% in differentiating viable lymphoma from fibrosis (13). It has also been compared directly with 18F-FDG PET in different studies, mainly in staging assessment (14–17). Lin et al. reported a disease site sensitivity of 96% and 82% for 18F-FDG PET and 67Ga scintigraphy, respectively (17). This finding also seems in agreement with a higher tumor-to-background ratio that has been described with 18F-FDG compared with 67Ga (14). Using 67Ga as a lymphoma-seeking agent is also associated with many drawbacks, such as extended imaging periods up to 5–7 d; lowered sensitivity for abdominal lesions, especially hepatic lesions, for small lesions of <1.5–2 cm, for lesions of >5 cm because of central necrosis; and poor-quality images (18). Even though it would be fallacious to believe that 18F-FDG PET imaging is free of all of these limitations, they are considerably improved.
Anatomic imaging with CT, in pretherapy assessment, has a high sensitivity (91%) and specificity (100%) (19). In posttherapy assessment, a study published by Cremerius et al., in which 72 patients were included, reported a sensitivity of 84% and a specificity of 31% (20). This dramatic decrease in specificity in assessment after therapy results from the use of lymph node size as a criterion to determine whether active lymphoma is still present. This shortcoming of morphologic imaging reflects the longer time period required for nodes to normalize in size after therapy compared with glucose metabolic changes observed with 18F-FDG PET. In the neck, in the thorax, and at the aortic bifurcation, nodes of >1 cm are considered abnormal, whereas in the pelvis and the upper retroperitoneum the upper limit is 0.8 cm (21). In our study, we have used an upper limit of 1 cm in all regions of the body, which could lead to an overestimation of specificity and an underestimation of sensitivity for CT. In spite of that, we observed a rather poor specificity (40%) with a positive predictive value of 45%. Hence, positive CT after chemotherapy in patients with HD can hardly be used as a reliable diagnostic tool to predict relapses and the need for therapy consolidation. In comparison, 18F-FDG PET had a much higher specificity (97%) and positive predictive value (92%) and a significantly shorter median disease-free interval (79 d). The sensitivity of CT appeared to be higher (83%) than its specificity, with a negative predictive value of 80%. These values were not statistically different from those obtained with 18F-FDG PET (sensitivity, 79%; negative predictive value, 92%). However, the overall diagnostic accuracy clearly remained in favor of 18F-FDG PET (92% vs. 56%).
Not all patients had CT concurrent with PET. This might be due to the fact that referring physicians were satisfied with the PET results and did not feel compelled to order an additional diagnostic procedure. This raises the issue of possible bias in the CT data. If all patients had undergone CT, the comparison would have been more robust by increasing the confidence in the CT data. Excluding the patients who had PET but not CT did not change significantly the overall accuracy of the PET data. In the subgroup of patients without concurrent CT data, 2 of 16 patients relapsed on follow-up. At best, if CT was accurate in all of those patients (an unlikely event), the specificity of CT would remain relatively poor at 65% and the sensitivity would not change significantly. Therefore, the specificity of CT would still be much lower than the specificity achieved with PET. In all cases of falsely positive or negative 18F-FDG PET, CT, when available, did not provide additional information in helping to predict residual disease or relapse. In a posttreatment context, it appears that 18F-FDG PET has a better diagnostic accuracy than CT.
All false-negative 18F-FDG PET studies (3/3) that we observed occurred in patients who underwent their PET study within the first 49 d after the end of chemotherapy. Sensitivity and negative predictive values were both equal to 100% in the subgroup of patients who had their PET study later after the end of therapy. Possible explanations for this observation could be the important decrease in lesion size after chemotherapy to a point where the recovery of radioactivity concentration is severely impaired by partial-volume effects. Römer et al. also showed in a group of 11 patients with NHL that the metabolic rate of 18F-FDG in tumor could be significantly altered by chemotherapy treatments independently of tumor size (22). This change was visible as early as 7 d after initiation of treatment but was a better predictor of long-term clinical outcome at 42 d. There is also evidence, in different tumor types, that this effect can be observed after completion of chemotherapy (23,24). In addition, no imaging modality can detect microscopic residual disease and this might be the primary explanation for the negative PET studies, given that the time lag between the negative PET scans and the relapse was close to 1 y in all cases. The small numbers of patients with negative PET studies that will relapse preclude definite conclusions about the optimal timing for PET studies after chemotherapy.
SUV measurements of the most active lesion did not appear to be a useful predictor of long-term clinical outcome in patients with positive 18F-FDG PET studies after treatment. The disease-free interval was not significantly different between the high- and the low-SUV groups. In a published study that addressed the value of SUV parameters in posttherapy HD, Dittman et al. reported that the SUV was not superior to visual assessment to detect the presence of residual disease (11). However, it is interesting to note that in the only false-positive PET study we obtained, the SUV measurement was the lowest of all positive PET studies. Thus, in doubtful cases or when a false-positive result is strongly suspected, a cautious approach would be to obtain either a biopsy confirmation or a close repeated PET scan, as occurred in that particular case.
Only 2 patients with stage I disease were included in this study. Considering the excellent prognosis and the somewhat different treatment protocols used in patients with stage I disease, they can be viewed as a specific subgroup. The underrepresentation of this subgroup makes it difficult to extrapolate our results to patients with early-stage HD. In our data, we found a true relapse proportion of 9% (2/23) in stage II, 27% (4/15) in stage III, and 50% (4/8) in stage IV. Most likely, in patients with stage I, one would expect to observe a very low relapse rate associated to a high negative predictive value with 18F-FDG PET, reflecting the favorable outcome associated with early-stage HD (10,25).
All retrospective studies are subject to potential biases in patient selection and study interpretation and can be limited because intraobserver reproducibility cannot easily be assessed. Another limitation is that the PET and CT results may influence the outcome and, therefore, overestimate accuracy of these tests. However, oncologists rarely rely on a single modality in the decision-making process, and an integration of several data sources with confirmatory studies is generally used to guide therapy. Nevertheless, this remains a significant limitation of all retrospective imaging studies that cannot be overcome without a prospective trial in which the oncologist is unaware of the test results. In addition, it may sometimes also be difficult to identify what subset of the true incident patient population was studied, because inclusion criteria are defined a posteriori. Despite a small number of patients with early-stage disease, we believe that the patient population we studied fairly reflects the presentation and evolution of HD in our area because the majority of patients with HD undergo PET scanning after treatment. Furthermore, our hospital is the only center within a large geographic area to provide care for these patients, ensuring consistency in referral patterns as well as therapeutic and diagnostic approaches. The CT data would be subject to the same limitations as the PET data; however, our study clearly shows that morphologic imaging has a very poor specificity to predict an unfavorable outcome after treatment. Finally, not all patients in this study were examined with 18F-FDG PET immediately after chemotherapy. The rate of residual disease in patients studied >90 d after chemotherapy was lower than the rate of patients studied at 0–90 d (19% and 37%, respectively). This reduces concerns that patients imaged at the longer intervals might have been referred because of signs or symptoms suggesting recurrence—therefore, introducing a selection bias that could favor the test under assessment.
Radiation therapy was used in a substantial proportion of patients (31/48), not always before PET, because some patients had radiation treatment after a positive PET result. Despite this, the accuracy of PET was not affected by the timing of radiation therapy. In patients who had radiation therapy after PET, only 4 patients had residual disease on PET and all of these patients eventually relapsed. From these very limited data, one should not construe that radiation therapy is ineffective in this setting because our study was not designed to assess the efficacy of this treatment. Chemotherapy is highly effective in HD to eradicate malignant cells. This is probably the main explanation for the lack of observed influence of radiation therapy on PET accuracy, because most patients with a favorable outcome responded well to chemotherapy. Refractory HD is extremely difficult to treat, whether by chemotherapy or radiation therapy, alone or in combination, and this probably explains the relapse in PET-positive patients who underwent radiation therapy afterward.
A potential research avenue that remains to be explored is determination of the 18F-FDG PET value as a prognostic indicator very early after initiation of treatment. This information could guide important therapeutic decisions, such as decreasing the number of chemotherapy cycles administered to a patient or switching to a more aggressive protocol. Available published data originating from NHL patients in a limited number of patients suggest that this approach is promising (22). Furthermore, Kostakoglu et al. recently published a mixed series of 13 HD and 17 NHL patients with rapid tumor response assessment after only 1 cycle of chemotherapy using a coincidence camera and achieved good results to predict treatment failure with early scanning (26). This approach warrants a thorough comparison with scans obtained a few weeks after the end of chemotherapy.
CONCLUSION
Positive 18F-FDG PET after the end therapy in HD patients is a strong predictor of relapse. A negative PET study is also an excellent predictor of good prognosis, but some false-negative results were observed in PET studies performed early after the end of chemotherapy. The diagnostic accuracy of 18F-FDG PET after therapy is superior to that of CT. The use of SUV parameters in patients with positive PET studies did not help to predict a shorter disease-free interval.
Acknowledgments
The authors thank Dr. Patrice Beauregard, Dr. Thierry Alcindor, and Dr. Bassem Sawan for helpful comments and discussion. We also thank the technologists and cyclotron staff of the Metabolic and Functional Imaging Center for their assistance. Part of this work was supported by the Canadian Institutes of Health Research under the Clinician-Scientist Award Program.
Footnotes
Received Aug. 12, 2002; revision accepted Feb. 28, 2003.
For correspondence or reprints contact: François Bénard, MD, Clinical Research Center, Centre Hospitalier Universitaire de Sherbrooke/Hôpital Fleurimont, 3001, 12th Ave. N., Sherbrooke, Quebec, Canada, J1H 5N4.
E-mail: Francois.Benard{at}USherbrooke.ca
REFERENCES
In this issue


Jump to section
Related Articles
Cited By...
- Hodgkin Lymphoma Version 1.2017, NCCN Clinical Practice Guidelines in Oncology
- Hodgkin Lymphoma, Version 2.2015
- The Role of PET and PET/CT in Managing the Care of Lymphoma Patients
- Hodgkin Lymphoma
- PET/CT for Therapy Response Assessment in Lymphoma
- Role of PET/CT Scanning in Initial and Post-Treatment Assessment of Hodgkin Disease
- 18F-FDG PET for Posttherapy Assessment of Hodgkin's Disease and Aggressive Non-Hodgkin's Lymphoma: A Systematic Review
- Early 18F-FDG PET for Prediction of Prognosis in Patients with Diffuse Large B-Cell Lymphoma: SUV-Based Assessment Versus Visual Analysis
- Impact of Positive Positron Emission Tomography on Prediction of Freedom From Progression After Stanford V Chemotherapy in Hodgkin's Disease
- Risk-adapted BEACOPP regimen can reduce the cumulative dose of chemotherapy for standard and high-risk Hodgkin lymphoma with no impairment of outcome
- 18F-FDG PET for Evaluation of the Treatment Response in Patients with Gastrointestinal Tract Lymphomas
- Current Concepts in Lymph Node Imaging
- Hodgkin's Lymphoma: Evolving Concepts with Implications for Practice