


Abstract
PET imaging of D2 receptors or 18F-l-dopa metabolism are reference protocols to follow and study neurodegenerative diseases, but the accuracy of striatal PET imaging is limited by the partial-volume effect (PVE). For such studies, the geometric transfer matrix (GTM) method has been proposed to correct the regional mean values for PVE and is now widely used. Methods: The GTM method models the geometric interactions induced by the PET system between the anatomic regions in which PVE correction is performed. This implies estimation of the corresponding regional spread function (RSF). The literature describes 2 implementations for the RSF calculation; they differ in the way the point spread function (PSF) of the imaging system is modeled, but no comparison or discussion has been given. The first and reference implementation uses an accurate intrinsic detector PSF that is applied in the sinogram space. The second uses a global PSF that is applied in the image space. In this work, we compared the 2 GTM implementations for 3-dimensional (3D) PET striatal imaging using Monte Carlo simulations and a phantom study. We studied the robustness of the GTM correction with respect to residual registration errors between PET and anatomy and with respect to residual segmentation errors. Results: Despite the differences in RSF calculation and computation cost between the 2 implementations, similar recovery results were obtained (between 95% and 100%). The study of robustness of the GTM correction yielded 2 results. A realistic residual misregistration between the anatomic and PET images did not modify the algorithm accuracy but decreased its precision. Conversely, a realistic residual missegmentation of the anatomic regions submitted to GTM correction decreased the correction accuracy. Conclusion: A simple but efficient implementation in the image space of the GTM method yields accurate PVE correction in striatal regions in studies with 3D PET and enables clinical use. The method is less sensitive to residual misregistration errors between PET and anatomy than to residual missegmentation of the anatomy. Special care should be taken with segmentation of the regions to correct for PVE.
Dynamic PET studies are frequently used to investigate neurodegenerative diseases such as Parkinson’s disease (PD) or Huntington’s disease (HD) in humans (1) or in animal models. 18F-l-dopa or 11C-raclopride PET studies are the reference methods to study the basal ganglia and reveal the anatomofunctional status of the dopaminergic nigrostriatal pathway both at the presynaptic level and at the postsynaptic level (2). Those PET studies provide regional mean measurements that enable the study of presynaptic dopaminergic function or postsynaptic D2 receptor densities, respectively, through the kinetic analysis step. Unfortunately, PET measurements in the basal ganglia are flawed by the partial-volume effect (PVE). The PVE and the spillover effect hinder the quantitative capabilities of PET scanners for objects smaller than 2 to 3 times the spatial resolution of the scanner; this is the case for caudate–putamen structures, which are key targets studied in PD or HD. The PVE considered as the effect of the finite resolution of the scanner is both a crucial step in PET image formation for these cerebral studies and a mathematically ill-posed problem as a deconvolution.
PVE correction methods described in the literature may be grouped into 2 categories (3). In the first category, the PVE is corrected by considering additional parameters to be fitted (4) or fixed within the model that often underlie the tracer kinetic analysis. In the second category, the solutions to the ill-posed PVE correction problem are constrained through the use of a priori information (anatomic boundary, shape) on the objects that contain the activity. This latter category gathers many contributions and variants. Most of these algorithms are dedicated to the estimation of a PVE-corrected map corresponding to either a part of the image (5,6) or the whole image (7–9). The remaining algorithms from this category are dedicated to restoring the regional mean values (or regional time–activity curves [TACs]) for some regions of interest (ROIs) (3,10–14). Beyond the differences in the aims, the methods of the latter category differ in the thoroughness of the deconvolution approach and in the kind of a priori information. This a priori information usually consists of a shape constraint or labeled anatomic regions drawn from MR images.
In the framework of PET studies of neurodegenerative diseases, MRI anatomic information is usually available, as it is needed to distinguish between striatal deafferentation and striatal atrophy induced by the disease. PVE correction methods embedded in the tracer modeling are excluded because of the mixed physiologic and morphologic effects of the disease; methods that use anatomic a priori information are preferred. Finally, for these studies that involve kinetic analysis, methods adapted to correction of the regional mean value are preferred to pixel-based PVE correction because they yield less noisy regional values (15). The method proposed by Rousset et al. (11) (which we call the geometric transfer matrix, or GTM, method) takes the a priori information from an MRI acquisition and corrects the regional mean values. The original work (11) describes the principles of the method for 2-dimensional (2D) PET imaging. A recent contribution has demonstrated the operative performance of the method on ligand studies (16). In this method, PVE is modeled with the geometric interactions induced by the PET scanner between the regions in which a PVE-corrected mean value is searched. The initial work proposed estimation of the geometric interaction factors through a projection, followed by a tomographic reconstruction of the anatomic regions under study. In some later contributions (1,3,14,17), the geometric interaction factors were estimated more directly through spatial filtering in the image space. There has been no comparison study of performance between the reference variant (projection and reconstruction) and the image filtering variant of the GTM method. Beyond the performance comparison, this study is of interest because of the very different computational needs of the 2 implementations, especially for 3D imaging. Finally, the robustness of the PVE methods that use a priori information have to be assessed under realistic acquisition conditions in which registration or segmentation errors occur. Such a study had been performed for the PVE pixel-based correction methods (9,18) but remained to be done for the GTM approach.
The objectives of this article are 2-fold. First, we present a fast but simplified implementation of the original GTM idea (the image implementation), a 3D extension of the original GTM contribution (which we call the sinogram implementation) that accounts for the 3D acquisition mode of the currently operated PET scanners, and a comparison of these 2 implementations. Second, we present the robustness of the GTM method with respect to 2 sources of error: PET–MRI registration and segmentation in MRI. To validate the first part of the study, we used realistic Monte Carlo–simulated PET data and an acquisition on a cerebral phantom with striatal structures. The validation of the second part of the study relied on Monte Carlo–simulated PET data.
MATERIALS AND METHODS
Two Implementations of GTM Method
Principles of GTM Method.
The principles of the method are briefly recalled here, and further considerations can be found in the original article by Rousset et al. (11). We use the notations and assumptions of that article. The objects being acquired in PET are supposed to consist of N tissue structures Di with homogeneous activity Ti (i = 1,…, N). The true activities Ti can be estimated from a set of N ROIs ROIj, (j = 1,…, N) of volume Vj and mean activity tj, drawn on the PET image. According to the fifth equation of Rousset et al., one can write:
 Eq. 1 where x is the space coordinate in the image and RSFi(x) (where RSF is regional spread function) gives the contribution of structure Di to the PET measure at x. Finally, if one considers t the vector of measurements tj, T the vector of the true homogeneous activities Ti, and the N × N GTM with terms ωij defined as:
 Eq. 2 we can rewrite Equation 1 as t = GTM·T.
The ROIj may be any regions and they must be different from one another to provide a full-rank GTM matrix. These regions may have some voxels in common. Although not required by the GTM method, an ROIj set for which each ROI includes mainly 1 given tissue structure should be chosen for practical numeric considerations. If one takes the set of regions ROIj to be equal to the set Di, the diagonal terms of the matrix can be interpreted as the recovery coefficients of each structure and the off-diagonal terms as spillover coefficients. If the number of regions ROI is less than N, the problem is underconstrained and does not allow the identification of the true concentration. If the number of ROIs is greater than N, the problem is overconstrained and the true concentration may be estimated in the least squares sense (12).
Taking for granted the hypothesis that the objects being acquired consist of a finite number of structures with a homogeneous activity, the a priori information is introduced through delineation of the tissue structures Di corresponding to the homogeneous objects from the MR image. This task is performed in the discrete sampling of the MR image and implies the resampling of either the ROIj function or the RSFi function in Equation 2 to account for the intermodality registration.
Computation of RSF.
For the current acquisition conditions, we will consider that the center of mass for the object studied (brain with striatum) is at about the center of both the MRI scanner and the PET scanner. This choice reduces the generality of the work but focuses the study on usual acquisition conditions to infer operative results. Estimation of the different RSF maps appears to be crucial. Two implementations of this estimation have been proposed in the literature. The first is the original one given by Rousset et al. (11), which simulates exhaustively the interactions between the emitting objects and the scanner by using a transaxial PET simulator (19,20) (sinogram GTM approach); the second is an estimation obtained by spatial filtering in the image space with a gaussian kernel (image GTM approach). The sinogram GTM approach was demonstrated in 2 dimensions, and because most PET acquisitions are now performed in 3D mode, an extension to 3 dimensions is needed. In this 3D implementation, we accounted for most of the acquisition and reconstruction phenomena and considered the sinogram GTM implementation as the reference. Conversely, we chose to implement the image GTM approach with the aim of obtaining a fast and easily operated method.
Sinogram GTM Approach.
In the original implementation of the GTM method, the RSFi corresponding to the tissue structure Di was estimated with a 2D noise-free analytic simulator. For the 3D extension of this implementation, we used the projection module of a 3D analytic simulator originally written for whole-body scanning on the ECAT HR+ scanner (Siemens/CTI PET Systems, Knoxville, TN) (21) and adapted for this study (22). Compared with previous studies (11,19,20), 2 new effects are accounted for in our analytic simulator that act on the spatial resolution of the scanner operated in 3 dimensions. First, the projection module explicitly considers any 3D lines of response (LORs) defined by any crystal pair in coincidence, instead of only 2D transaxial LORs. These LORs are convolved with the intrinsic point spread function (PSF) of the 2 crystals; this corresponds to 2 successive convolutions with a 2D crystal PSF that models its response and the depth of interaction effect. Second, the blurred LORs are resampled as they are recorded on the scanner.
The simulated sinogram corresponding to each Di structure is reconstructed to form the RSFi with the same parameters as those used for the PET data to which the GTM algorithm will be applied. Attenuation is not simulated because it may be considered constant in the brain soft tissues and does not contribute to any acquisition effect in our application.
Image GTM Approach.
In this approach, the intrinsic PSF of the scanner and the effects of the reconstruction are compounded in a global PSF in the image space. From the above remarks, it appears that the resolution varies in the field of view (FOV) of the PET scanner and that the global PSF should be modeled with a nonstationary kernel. Yet we modeled the global PSF with a stationary 3D elliptic gaussian kernel for 3 reasons. First, many contributions, such as that of Mawlawi et al. (17), report results with this simple model; second, the striatal regions are always located near the center of the PET FOV; and third, this choice eventually enables operative clinical implementation. The RSFi(x) functions are obtained as the convolution of support of Di with the global image PSF. The choice of a stationary 3D gaussian kernel allowed us to use a fast and accurate recursive technique to perform the gaussian filtering. We used the ideas of Deriche (23,24), who proposed approximation of the gaussian filter with an exponentially based filter family that can be implemented through a recursive algorithm. This made the gaussian filtering fast and its computation time independent of the gaussian kernel width.
Choice of PSFs
Both sinogram implementation and image implementation use a specific response function to describe the geometric interactions between the object and the scanner. The first implementation requires the intrinsic PSF that accounts for the crystal response function. The second requires the image PSF that accounts for the scanner and reconstruction process response function. In our facility, clinical studies are performed on an ECAT HR+ scanner, and it was used to fit the different PSFs.
Sinogram Approach.
The shape of the intrinsic PSF was estimated with a 2-mm-diameter collimated pencil beam of γ-rays coming from an 18F source. For a ring detector geometry, we defined the intrinsic PSF hα(r,l) for a crystal belonging to ring rc, at azimuthal location lc along this ring, and where α is the angle between the direction of an LOR and the crystal normal direction. The PSF hα(r,l) is parameterized with the sum of 2 gaussian functions:
 Eq. 3 to better reproduce the tails (A < 1, εr > 1, and εl > 1) of the individual detector PSF. The transverse width σ1(α) of the gaussian functions increases when the angle α increases to account for the resolution degradation toward the edge of the FOV. The PSF widths σ1(α) and σr were tuned by matching simulated and measured data of a reconstructed 3-mm-diameter sphere filled with 18F and located at various radial distances from the center of the scanner FOV. We did not use a 1-mm pointlike sphere, as the analytic simulator is not meant to simulate objects much smaller than the crystal detector width (of the order of 4 mm for the ECAT HR+ scanner).
Image Approach.
The image GTM approach uses a convolution with a 3D gaussian kernel. We acquired experimental data for a 1-mm-diameter pointlike sphere filled with 18F. It was located 5 cm from the center of the scanner FOV, and the data were reconstructed using the same protocol as for the clinical PET data that are candidate to PVE correction. Considering the reconstructed sphere as the impulse response of the system (acquisition and reconstruction process), we fitted the measured profiles with a stationary gaussian kernel using different widths for the axial and transaxial directions.
Phantom Simulation and Acquisition
Monte Carlo Simulation.
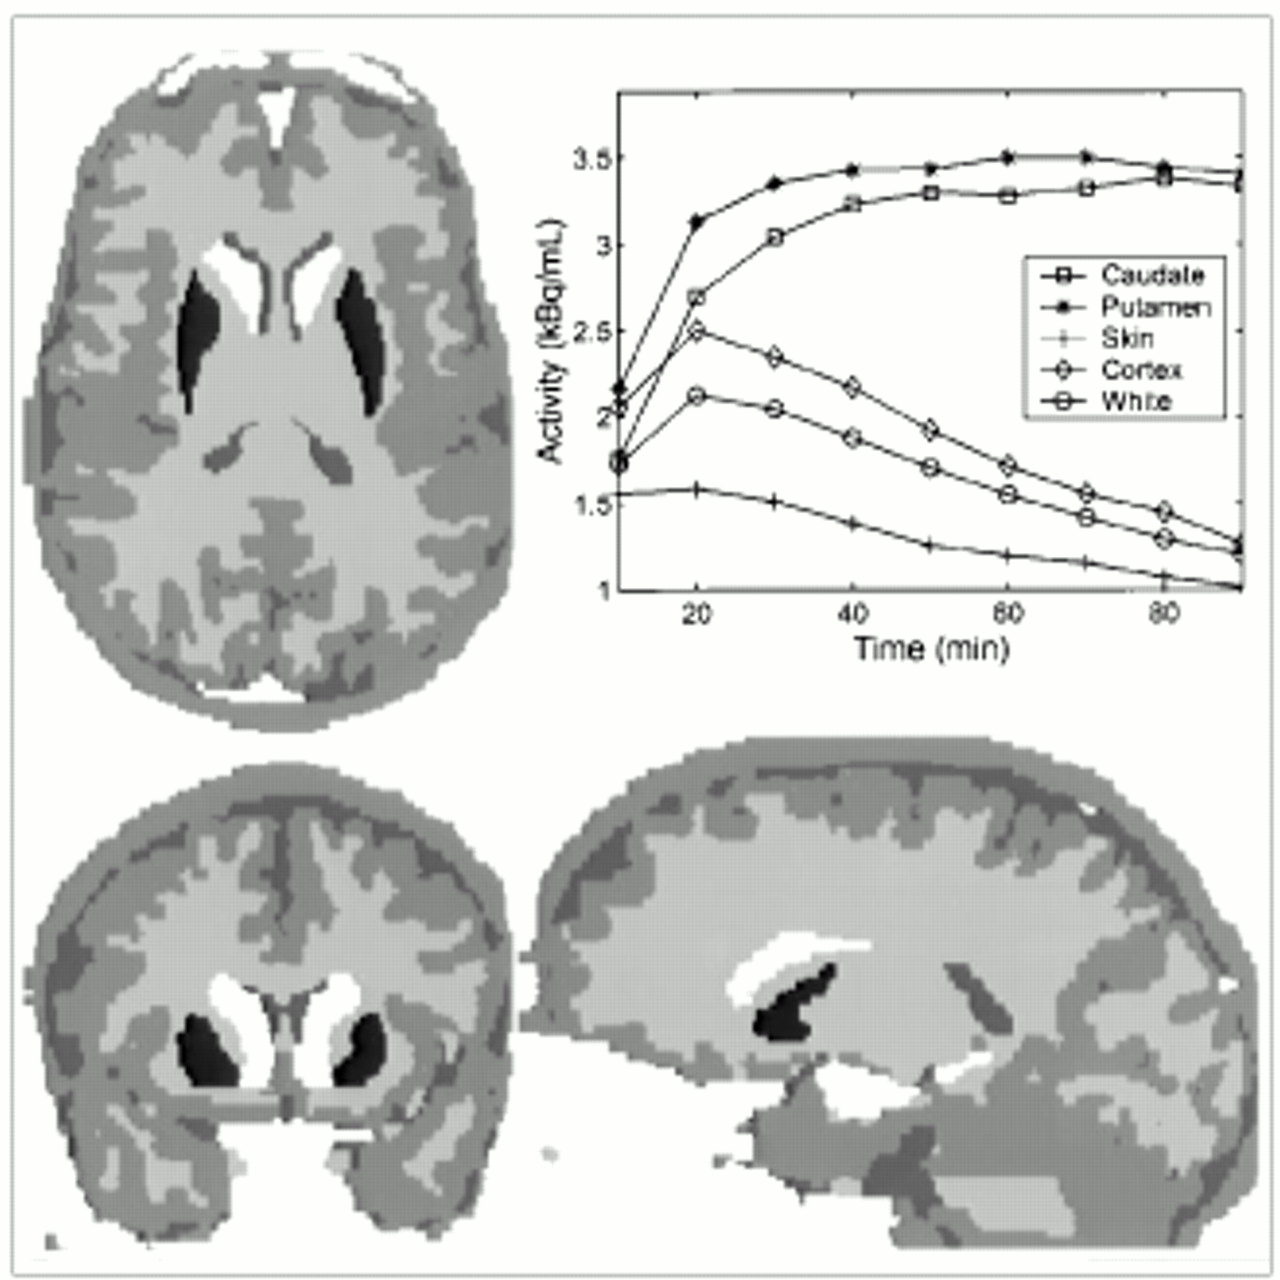
We simulated 2 reference datasets: an 18F-l-dopa–like dynamic study and an 11C-raclopride–like dynamic study. The numeric head phantom of Zubal et al. (25) was used; it consists of a volume of manually labeled anatomic regions segmented from an actual MRI acquisition. As is sketched in Figure 1, we selected 7 ROIs that usually show uptake in 18F-l-dopa and 11C-raclopride studies to create the reference anatomic volume: caudate (right and left), putamen (right and left), white matter, gray matter, and skin/muscle structures. The numeric phantom is a 256 × 256 × 120 voxel volume with a voxel size of 1.1 × 1.1 × 1.4 mm.

The 7 compartments considered in Monte Carlo simulations—skin/muscle, gray matter, white matter, right caudate, left caudate, right putamen, and left putamen—shown with arbitrary gray levels in axial, coronal, and sagittal views. Plot shows TACs used for each structure in 18F-l-dopa Monte Carlo simulation.
From an actual protocol using 18F-l-dopa tracer with nine 10-min frames, a physiologic TAC was derived for each structure. From these TACs and the numeric phantom, we generated 1 PET dynamic study with a Monte Carlo simulator (26) for the ECAT HR+ scanner. This simulator is, of course, distinct from the analytic simulator used in the sinogram implementation of the GTM algorithm. We reconstructed the data according to the brain protocol used in our laboratory: The filtered backprojection algorithm that we use is 3D reprojection reconstruction (27), with a Hann apodizing window and the Nyquist frequency cutoff (0.2 mm−1). The simulation did not consider random events, but attenuation and scatter were modeled and were corrected in the reconstruction process (28). The reconstructed simulated image size was a 128 × 128 × 63 voxel volume with an isotropic voxel size of 2.43 × 2.43 × 2.43 mm and contained 9 frames. The simulation was performed with realistic parameters for geometry (size and relative position of the structures in the FOV) and statistics (statistics for emission corresponding to a 333-kBq 18F-l-dopa injection).
Similarly, an actual 11C-raclopride study enabled us to obtain a second set of TACs. The simulated dynamic study contained 23 frames of various durations ranging from 30 s to 5 min (statistics for emission corresponding to a 370-kBq 11C-raclopride injection).
The Monte Carlo simulator has already been validated, as reported by Reilhac et al. (26). Nevertheless, a Monte Carlo simulation of a 3-mm-diameter sphere was performed for 2 reasons: first, to check the concordance between the PSF from the measured data and the PSF from the simulated data; second, to assess the goodness of fit of the gaussian kernel chosen in the image implementation approach.
Brain Phantom Acquisition.
We used an anthropomorphic head phantom. This phantom (Radiology Support Devices, Long Beach, CA) consists of a main cavity containing 4 small chambers that can be filled independently. The shape of the cavities mimics the cortex volume and the putamen and caudate nuclei of the striatum. The main cavity may be embedded in a synthetic head skull. The cavities are made of plastic, whereas the skull is a bonelike material that accounts for realistic acquisition conditions (shape, complexity, and attenuation). A PET dynamic acquisition was performed with the ECAT HR+ scanner. The internal cavities were filled with a solution of 18F (414 Bq·mL−1), and the internal chambers received a solution of 11C (332 Bq·mL−1). The protocol consisted of 20 acquisitions of 1 min each and 1 late acquisition of 10 min. The day after, a transmission scan of 20 min was performed. The acquisition conditions corresponded to a typical 18F-l-dopa brain protocol. The images were reconstructed with the brain algorithm described above. The decay correction step of the reconstruction process was disabled to synthetically create a temporal evolution of activity in the image. Samples from the 18F and 11C solutions were taken and counted in a well counter for cross-calibration. The anthropomorphic phantom underwent MRI on a Signa 1.5-T scanner (General Electric Medical Systems, Milwaukee, WI). The main cavity only was filled with water to yield good contrast between brain and striatum with a T1-weighted spoiled gradient-recalled acquisition in a steady state. This set of data enabled us to validate the whole process of the GTM correction method: Indeed, we registered the PET and MRI studies with an algorithm based on mutual information (29) and used the MRI acquisition to manually delineate structures of homogeneous activity. The walls of the internal cavities, which could be seen in the MRI acquisition, were not considered as part of the striatal nuclei.
Study of Robustness
Factors of Errors for Correction.
If one takes aside the noise amplification effect inherent in any deconvolution method, some specific factors of error modify the GTM correction performance even if the hypotheses of the method are fulfilled. The a priori information used by the GTM method involves delineation of the homogeneous Di structures either with a visual criterion (as in this work) or with a criterion of an automatic method. We chose to infer the regions ROIj in the MR image coordinates and from the Di structures with j = i: This can be performed through the selection of voxels of Di-corresponding RSFi with value above half the maximum of RSFi or through the morphologic closing of Di structures. This choice implies resampling of the PET data to account for the registration between the PET image and MR image. Consequently, the PET–MRI registration and the segmentation of the structures Di are considered parts of the PVE correction in the GTM method.
In considering the organization of our implementation and the sources of errors described above, one notices 2 points. First, the registration errors between the PET image and MR image introduce errors that affect only the measures tj; the registration error does not modify the GTM matrix for a given choice of the structures Di and regions ROIj. Second, from Equation 2, it appears that potential error in the delineation of the structure of homogeneous activity will bring some artifacts in the computation of RSFi and consequently in the ωij terms.
Robustness with Respect to Registration Error.
The misregistration is a major source of errors for the GTM method. Many multimodality registration algorithms for cerebral studies are currently available; most estimate a rigid-body transform between the images to be registered. In recent developments in registration methods, the matching criterion is most often a similarity measure at the voxel level and especially the mutual information criterion (29,30) that extends the early ideas of Woods et al. (31). Estimation of the registration error for a given algorithm is an active domain of study in itself. The signal-to-noise ratio, resolution in the images, and contrast in the images significantly affect the accuracy of the registration. In the comparative study reported by West et al. (32), a median error is defined to compare different registration algorithms, and typical error values are given for different conditions. Following this work, a median error ranging from 1.5 to 5 mm is expected for the studies currently performed in our laboratory based on images with the characteristics described in the Phantom Simulation and Acquisition section. This error range is confirmed by a study that we performed previously (33). Yet a simple visual quality check enables detection of a shift error greater than 2.5 mm. Consequently, the registration errors we studied corresponded to shifts ranging from 0.5 to 2.5 mm at the level of the striatum.
To be realistic, we generated rigid transforms that simulated the registration error of a given amplitude. We separated our simulations into 2 categories and considered either the translation-only error or the rotation-only error. For a given norm of translation, we generated 21 unit vectors that were directed toward randomly chosen points on the surface of a hemisphere, which were nontrivial directions of the image. For a given value of rotation error, we inferred the 21 corresponding rotation-only rigid transforms. To explore the range of current residual error yielded by any registration method (0.5–2.5 mm), we made the norm of the 21 translations vary from 0.5 to 2.5 mm and the angle of the 21 rotations vary from 1° to 5°. The effects of the registration error were studied with the 18F-l-dopa Monte Carlo PET simulation.
Robustness with Respect to Segmentation Error.
Missegmentation of the structures Di is another major source of errors. The segmentation error cannot be modeled or quantified easily. To study the effect of missegmentation, we varied the shape of the structures Di (34). The missegmentation process was obtained by delineating different sets of Di structures. We chose 1 structure that varied—the right caudate—and left the others unchanged. To describe the segmentation error with a 1-dimensional parameter, we generated a set of structures DRight Caudate and endowed them with good set properties. We generated several sequences of right caudate shapes DRight Caudatek, k = (1,…, 70) that followed the property DRight Caudatek ⊂ DRight Caudatek + 1. With this condition, we may parameterize the segmentation error of a given DRight Caudate structure by its error size relative to the true one. Given the right caudate nucleus available in the Zubal phantom (3,000 voxels), we varied the structure from a 1-voxel-thick eroded shape to a 1-voxel-thick dilated shape. The relative error size varied from −30% to +30%. The whole process is sketched in Figure 2. We started from the initial right caudate and obtained the internal layer (respectively, the external layer), which is between the original shape and the 1-voxel-thick eroded shape (respectively, the 1-voxel-thick dilated shape). Each of the obtained thin layers was split automatically into small patches of 35 voxels each. Then, we progressively added the patches to go from the small eroded shape to the dilated one. Each time we added a patch, we checked that the object still contained only 1 connected component. To get relevant results, we defined 30 different sequences of evolutions. To quantify the effects of a segmentation error on the GTM correction procedure and compare them with the effects of other sources of error, we used the 18F-l-dopa–simulated PET data.

Flow chart illustrating building of family of missegmented right caudate. (A) Original caudate. On left, 1-voxel eroded core is shown in light gray. On right, 1-voxel-thick internal layer is shown in gray and 1-voxel-thick external layer, from original shape, is shown in dark gray. (B) Addition of one tile after another. (C) Tessellated caudate.
RESULTS
Choice of PSFs
The image of the 3-mm-diameter sphere was used to tune the parameters σ1(α) and σr from Equation 3 for the sinogram approach. For the image approach, the values for full width at half maximum (FWHM) of the 3D gaussian kernel were fitted with the image of the 1-mm-diameter sphere. They yielded an axial value of 6.67 mm and a transaxial value of 7.06 mm.
To validate the PSFs used for the sinogram GTM approach and for the image GTM approach, we compared the profiles of the 3-mm sphere that we obtained either from measurements or from computing the RSFs of a 3-mm numeric sphere obtained with both GTM approaches. The resulting profiles are shown in Figure 3 with the sphere at 2 radial distances (5 and 10 cm from the center). The widths of the profiles are listed in Table 1. They were computed according to the specifications of the National Electrical Manufacturers Association (35). In addition, a Monte Carlo simulation of the sphere was performed for a radial distance of 5 cm from the center of the scanner FOV.
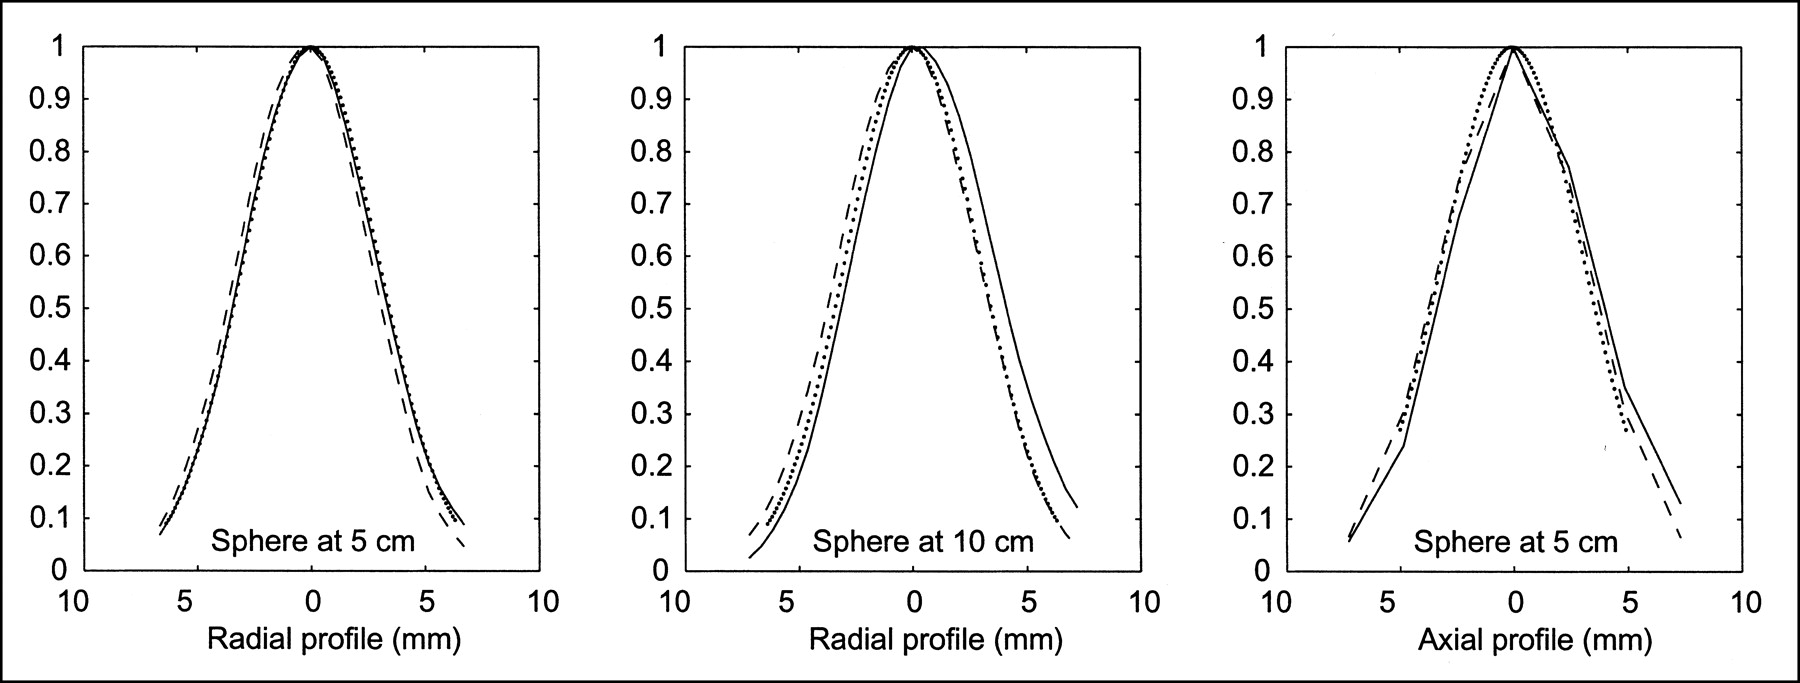
Profiles for 3-mm-diameter sphere at radial distances of 5 and 10 cm from center of FOV, including measured data (solid line), RSF for image GTM (gaussian) approach (dotted line), and RSF for sinogram GTM (simulation) approach (dashed line).
Full Widths of Profile Obtained for 3-mm-Diameter Sphere at Radial Distance of 5 cm From Center of FOV
Comparison of the 2 GTM Implementations
Although the PSFs used in both implementations were fitted with 18F-filled spheres, recovery performance is similar for the 18F- and 11C-simulated studies: The positron ranges are nearly the same.
Influence on GTM Matrix.
Table 2 reports the 2 GTM matrices obtained for the numeric phantom used in the simulations. The structures Di corresponded to the tissue structures with homogeneous activity that were considered in the simulation, and the regions ROIj were the voxels with a value greater than 50% of the maximum value of the RSFj(x) corresponding to Dj for j = (1,…, N). The diagonal terms reveal the recovery coefficients, and one can notice that smaller values are yielded by the image implementation, compared with the sinogram implementation, for the small central structures. If one considers the spillover coefficients greater than 0.15, which correspond to pairs of regions that actually interacted, the relative difference between the 2 approaches is less than 4%. For 3D PET, the computation time is about 1,000 times longer in the sinogram approach than in the image approach. To fulfill the comparison, we applied both implementations to the simulated phantoms (dopa and raclopride) and to the brain phantom acquisition. The Di structures were taken from the Zubal model (Fig. 1) for the Monte Carlo simulation and from the MR image for the realistic brain acquisition. The ROIs were derived as described above. Two sets of PVE-corrected values were obtained, one for each implementation (sinogram and image).
Comparison of Coefficients of GTM Matrices for the 2 Approaches
Monte Carlo Simulation.
The PVE-corrected TACs of concentration of ligand for the dopa and raclopride studies were compared with the known curves introduced into the simulation. We used the apparent recovery coefficient (ARC), defined as the ratio of the recovered activity to the known activity for each structure, as a figure of merit to compare the 2 implementations. In Figure 4, we plotted the 3 ARC values (uncorrected, GTM image, and GTM sinogram) for each frame of the simulated dynamic PET scan. The mean and SD values of the ARC for the 2 studies are reported in Table 3. The mean and SD values are consistent with those reported by Rousset et al. (11); the values vary between 93% and 104% for the mean and between 0.1% and 3.4% for the SD. The SD values indicate a slight advantage for the image implementation.

Plot of ARC with time that indexes PET dynamic simulations. Regional ARCs shown are uncorrected (solid line), sinogram GTM PVE corrected (dashed line), and image GTM PVE corrected (dotted line). First row displays curves on left caudate and second row on right putamen. First column displays curves from 18F-dopa simulation and second column from 11C-raclopride simulation.
ARC Obtained with Sinogram Implementation or Image Implementation
Brain Phantom Acquisition.
We fitted a monoexponential function to the corrected TAC of each structure to obtain the isotope half-life and concentration of the isotope. As criteria for validation, we used ARC; isotope half-life recovery; and initial activity concentration recovery, defined by the ratio of the recovered values to the calibrated (counted) ones. The values of half-life recovery, initial activity concentration recovery, and ARC for each implementation are given in Table 4 and can be compared with the values obtained when no correction is performed. The values for half-life recovery or initial activity concentration recovery obtained after correction vary from 89% to 100% for the sinogram approach and from 93% to 99% for the image approach. These values are in accordance with values reported in the literature (11). Small differences between the 2 implementations may be noted. The ARC mean criterion indicates better raw performance for the sinogram approach; the ARC SD is smaller for the image approach. The 2 implementations therefore do not induce the same bias on the correction: The bias is constant with contrast for the image implementation, whereas the bias varies with a small amplitude for the sinogram implementation.
Values of Recovery Coefficients for Striatal Phantom
The PVE recovery capability of the method is reproducible for each structure regardless of the implementation. No definitive difference may be found to distinguish between the 2 implementations for this realistic striatal phantom.
Robustness
To study the robustness of the GTM method, we used only the image approach, because both GTM implementations perform similarly.
Robustness with Respect to Registration Error.
For each simulated misregistration (translation or rotation) and for each structure, we computed the mean of the ARC (mARC) across all the frames of the dopa Monte Carlo dynamic study. To characterize these mARC values for a given amplitude of misregistration, we computed the mean and SD values of the mARC over all the drawings (21 transforms) for each given amplitude. Figures 5 and 6 show these values for the right caudate in the dopa simulation. The mARC mean value remains stable, whereas the SD increases from 2%–3% (with no registration error) to 6%–8% for a 2.5-mm translation error or a 5° rotation error.
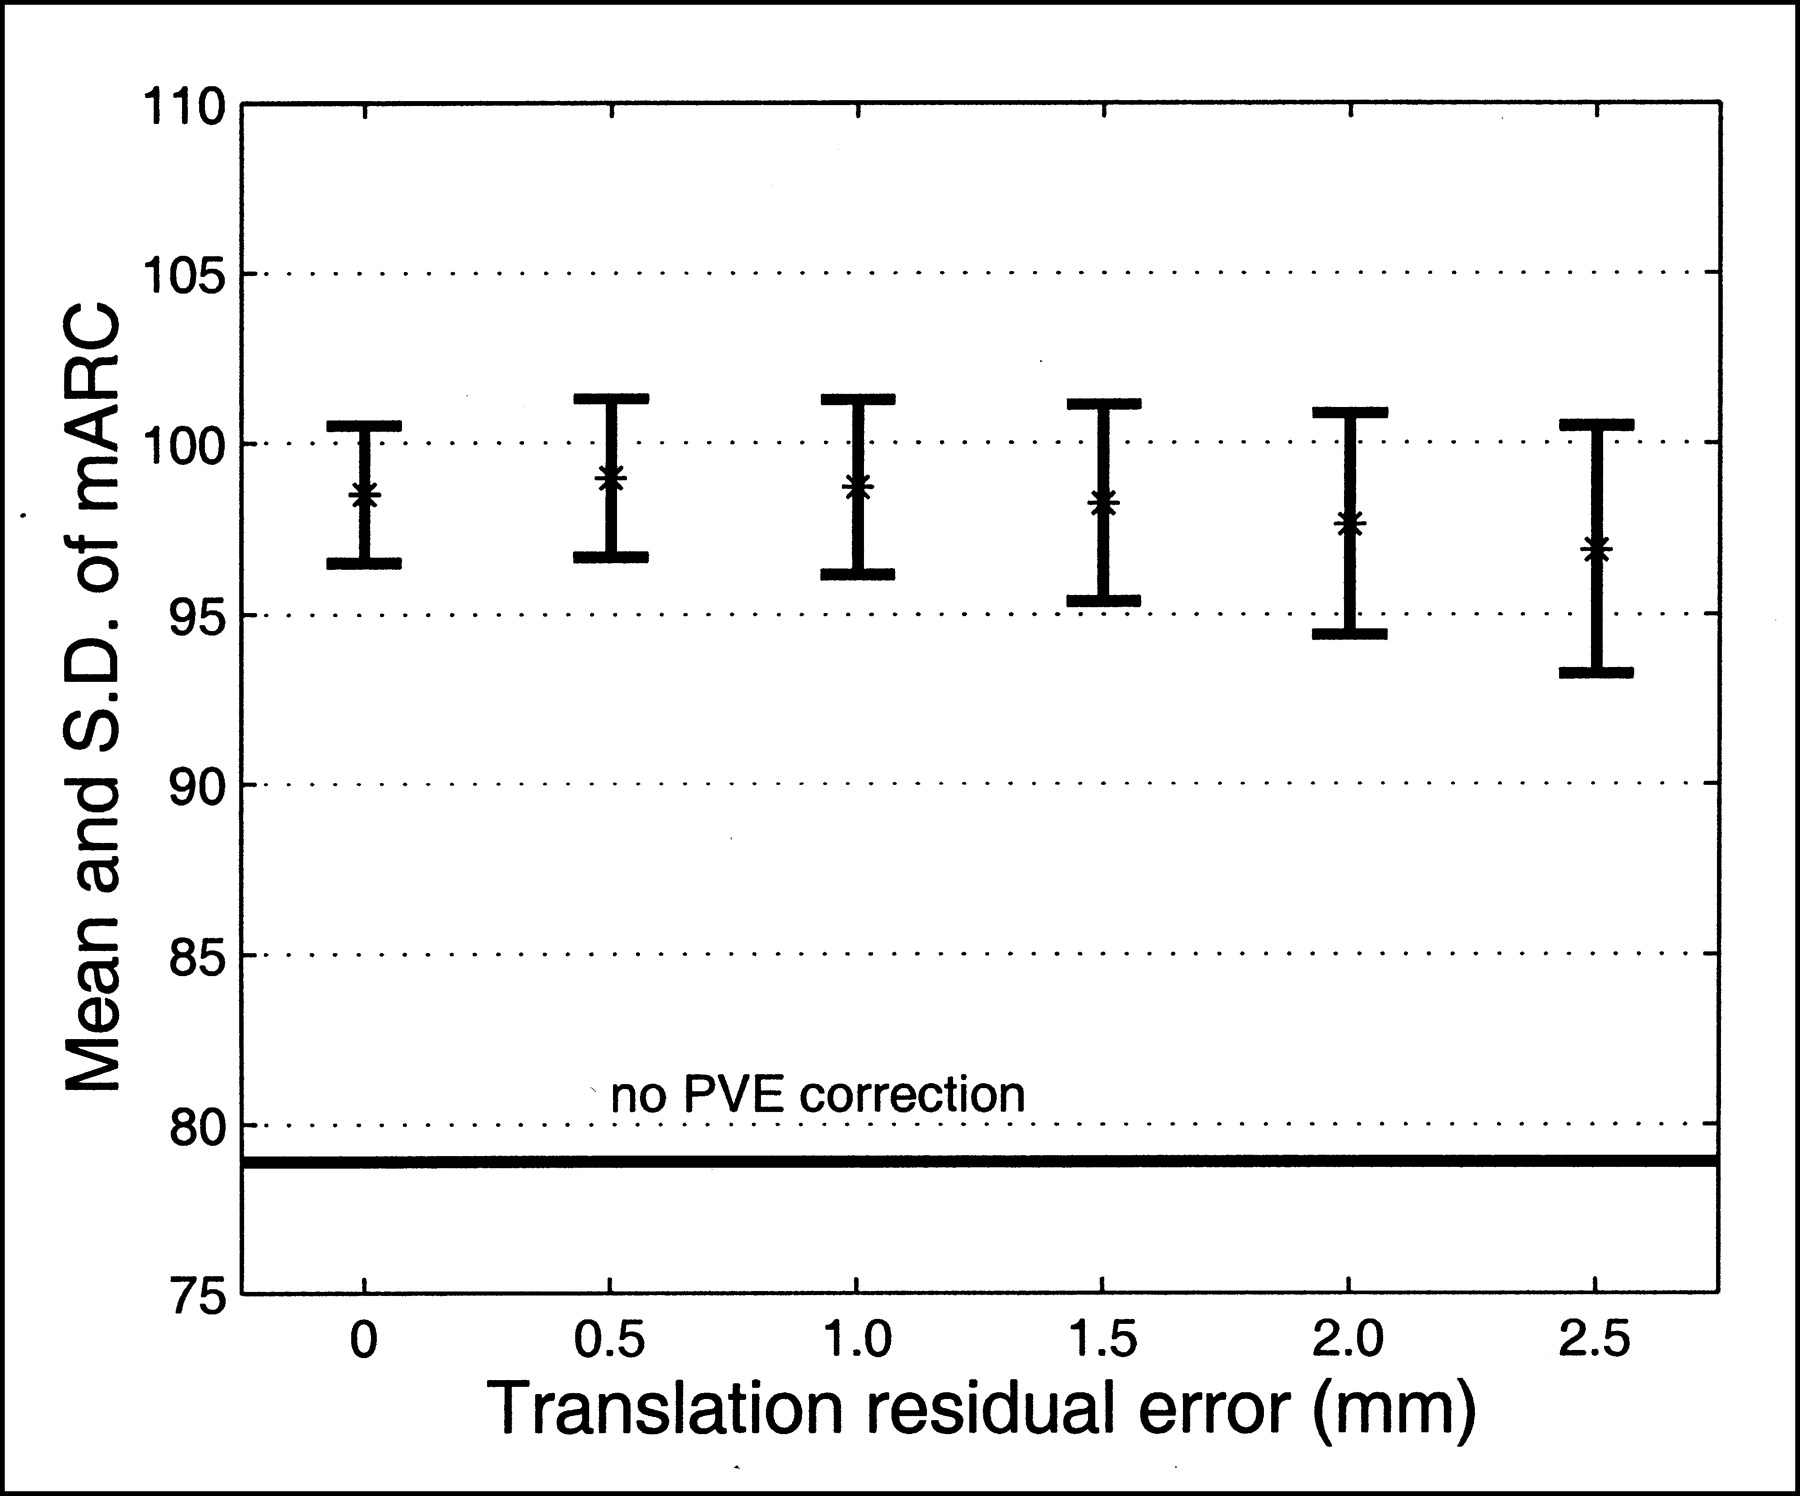
Robustness of GTM method with respect to translation error between PET and MRI: example of right caudate structure with 18F-dopa simulation study. Evolution of mean (%) and SD of mARC value is plotted against amplitude of translation residual error. One mARC value is obtained for each randomly generated translation error (21 drawings per amplitude).
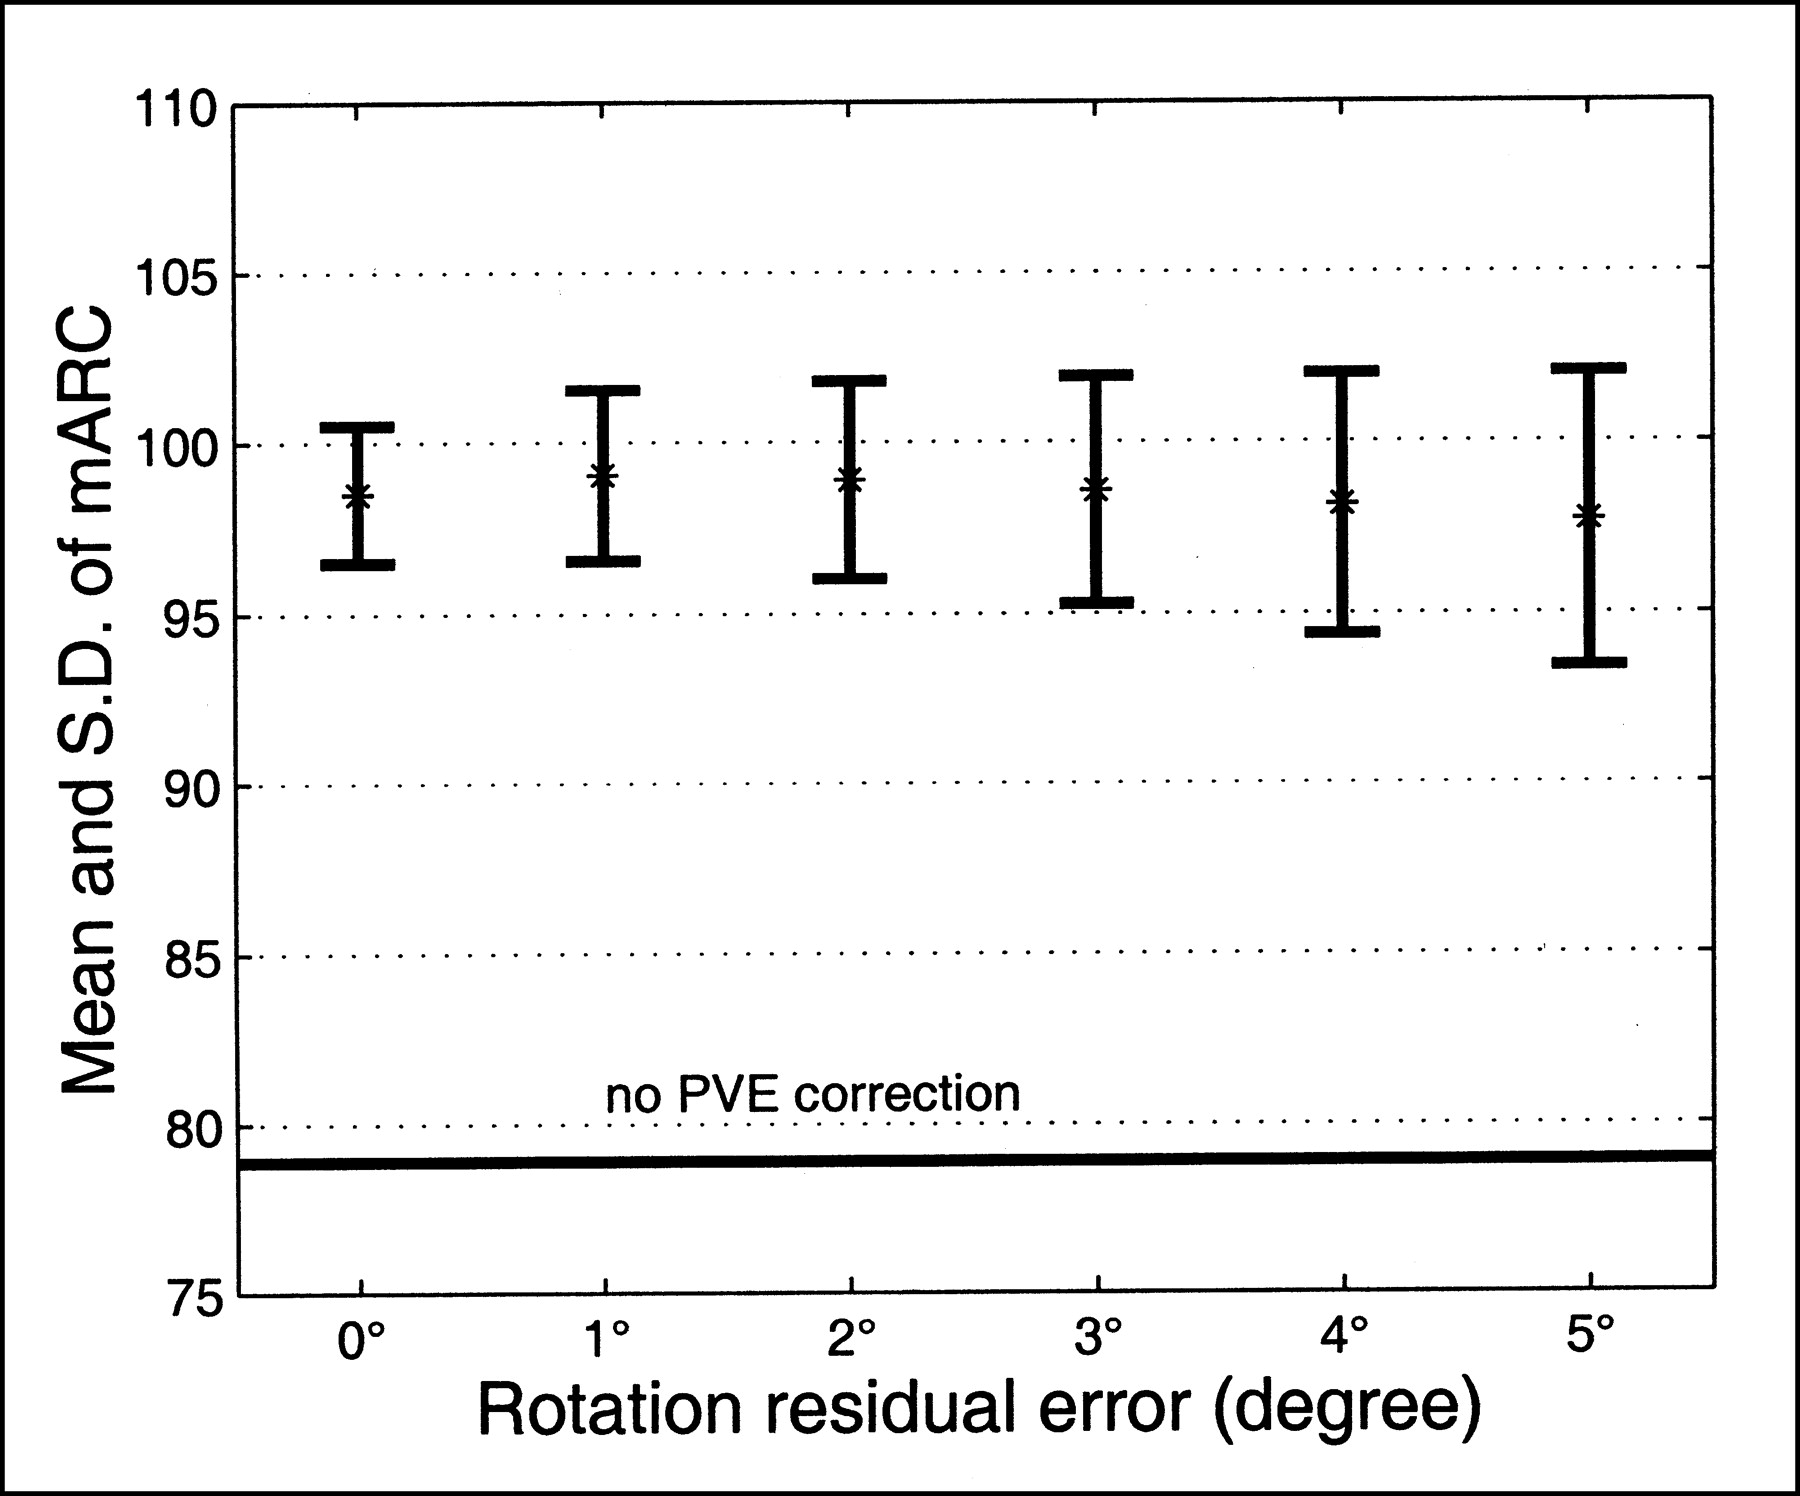
Robustness of GTM method with respect to rotation error between PET and MRI: example of right caudate structure with 18F-dopa simulation study. Evolution of mean (%) and SD of mARC value is plotted against amplitude of rotation residual error. One mARC value is obtained for each randomly generated rotation error (21 drawings per amplitude).
Robustness with Respect to Segmentation Error.
As described previously, the mean and SD values of the mARC were computed over all the configurations (30 configurations) for a given size of the missegmentation object. In Figure 7, these values are plotted for the right caudate in the dopa simulation. The mARC mean values vary from +7% to −7%, which corresponds to, respectively, a configuration with an undersegmented object and a configuration with an oversegmented object. The SD value of mARC remains stable. There is no spurious variation in the behavior of the correction method; the bias follows a piecewise decrease. For the unchanged objects, the GTM algorithm keeps performing correctly. Results for the unchanged objects, not reported here, showed that the bias of TACs after correction for those objects remained constant regardless of the shape of the right caudate.
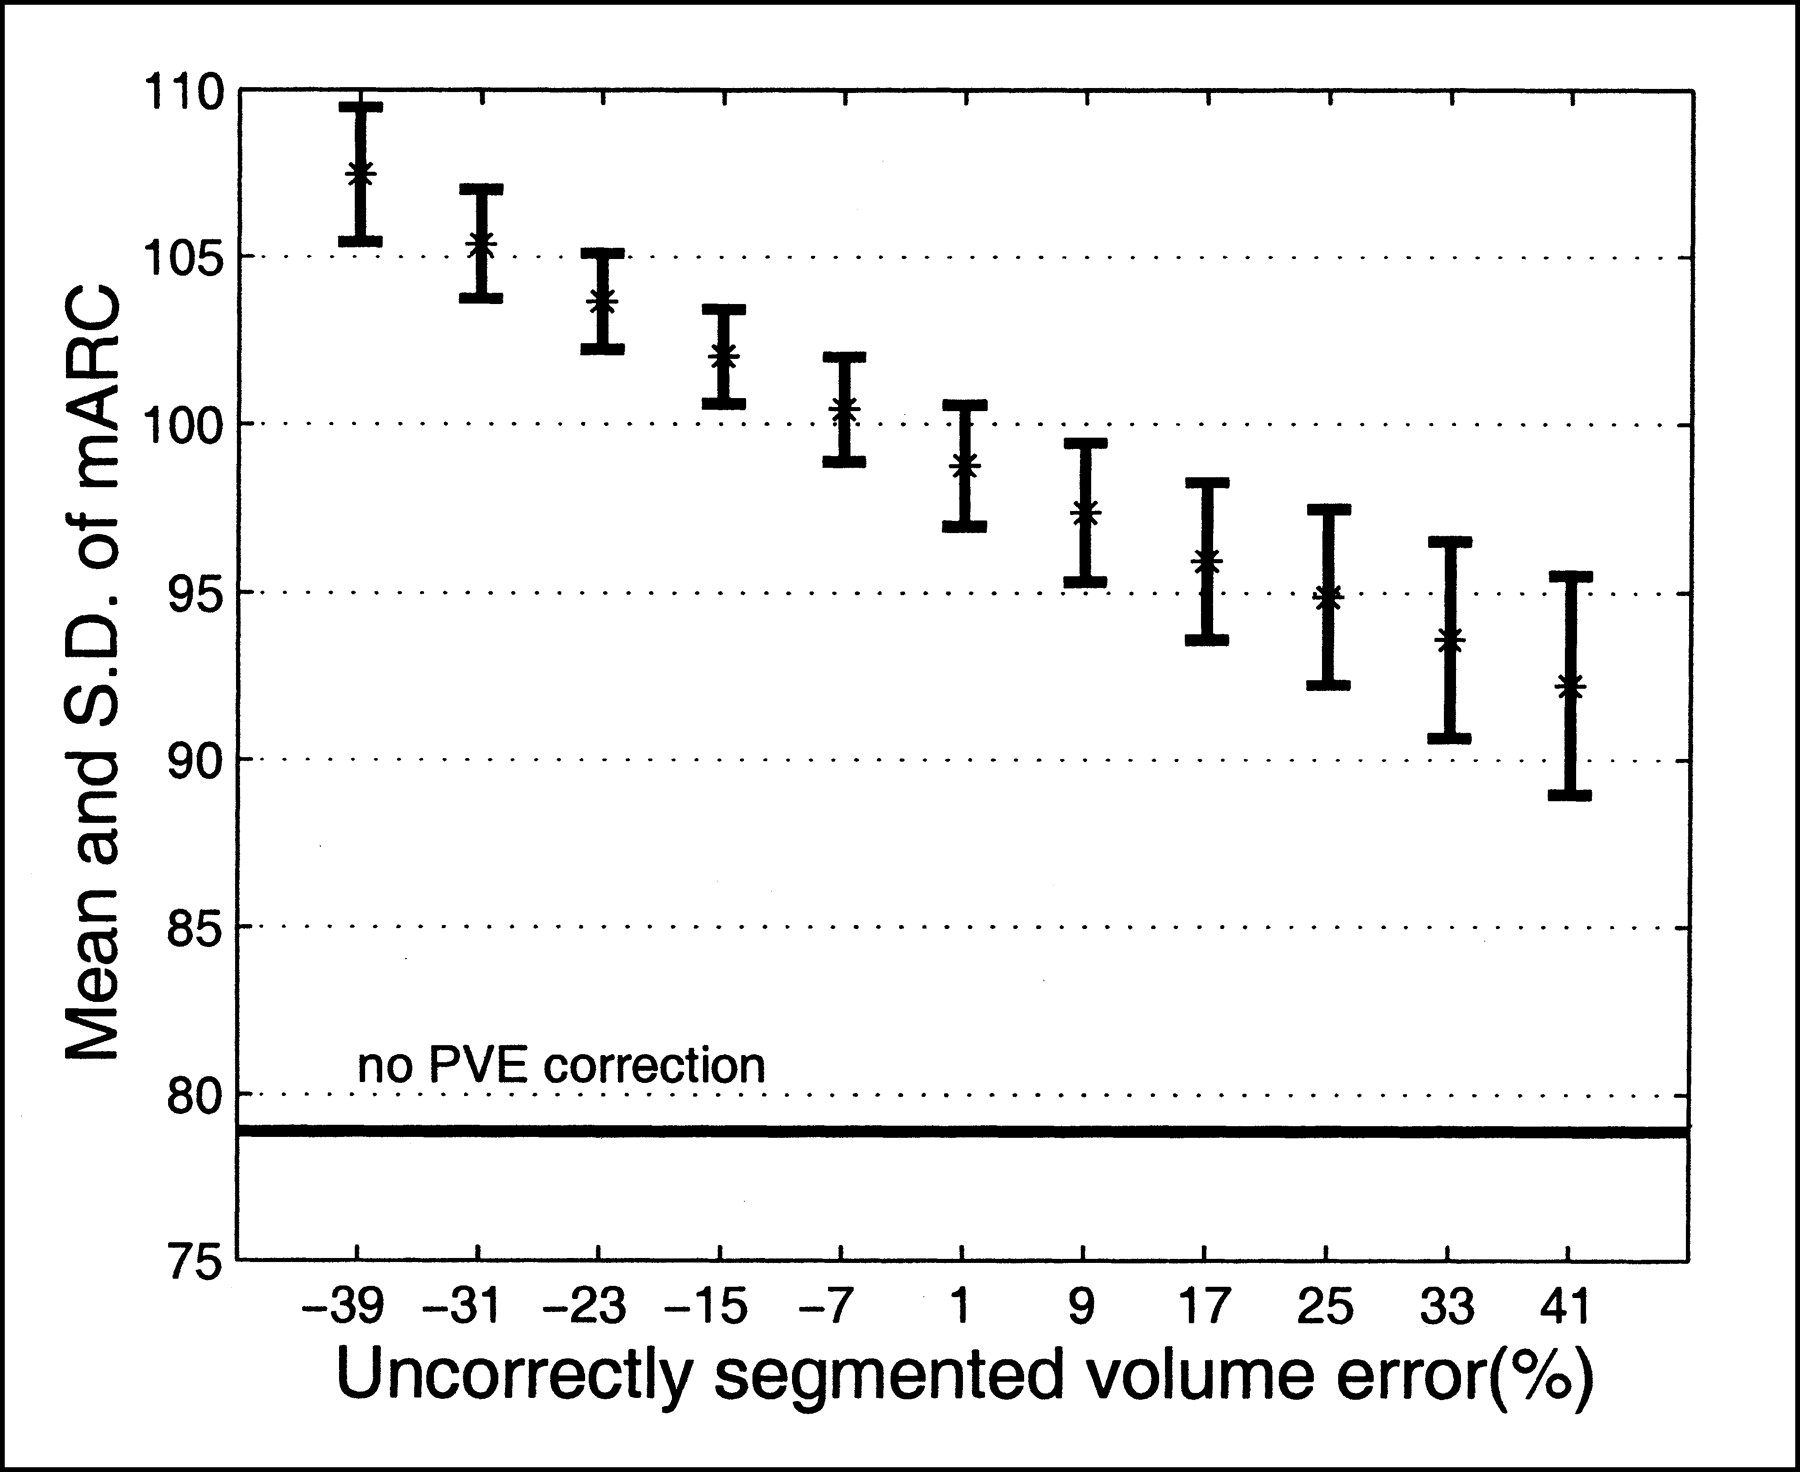
Robustness of GTM method with respect to segmentation error: example of right caudate structure with 18F-dopa simulation study. Evolution of mean (%) and SD of mARC value is plotted against amplitude of segmentation residual error (relative error size). One mARC value is obtained for each randomly generated segmentation error (30 drawings per amplitude).
DISCUSSION
The PVE correction technique studied in this article is dedicated to the restoration of activity in small subcortical structures and relies on the availability of anatomic information, which can be problematic. Yet patients with PD or HD who receive neuroprotective or restoration therapy undergo both functional 18F-l-dopa or 11C-raclopride PET and MRI, which brings the anatomic information. Dedicated PET scanners are used for studies of neurodegenerative diseases in animal models, and an equivalent need for PVE correction exists on a smaller scale. Most often, multimodality MRI and PET information is available for animal models of PD and HD, making the GTM technique practicable.
Pixel-based PVE correction enables the computation of parametric images, whereas regional PVE correction enables tracer kinetic analysis in areas carefully delineated. This latter strategy is preferable in several situations. One is the follow-up of neurodegenerative diseases (12,16,18), in which the labeling of structures containing lesions is necessary to account for potential atrophy and to distinguish between an effect of morphologic degeneration and a functional alteration of metabolism. This labeling yields ROIs in which quantitative receptor concentrations will be comparable during follow-up. Another situation in which regional PVE correction is preferable concerns TAC measurements in very small ROIs in studies with low signal-to-noise ratios, such as endogenous ligand studies (17).
To compare the 2 implementations of the GTM PVE correction, we corrected the Monte Carlo simulation studies and the phantom study with both approaches. The results for correction of the regional TACs obtained from the dynamic PET brain simulations show, for both implementations, an accuracy equivalent to that reported in the literature. The results for the physical phantom show some errors that may be explained by the segmentation and registration residual errors that could not be excluded from this validation.
The image implementation of the GTM correction method uses a stationary gaussian kernel filter to model the scanner acquisition and reconstruction processes of an emitting object. According to our study, this simple model is precise enough to recover activity in a structure near the center of the FOV of the PET scanner. A specific study is necessary to fit the axial and transaxial FWHMs of the kernel each time one modifies the reconstruction filter or the isotope to account for a very different positron range. The sensitivity of the GTM method to the FWMH of the kernel filter was noticed by Mawlawi et al. (17). We did not study the effect of an erroneous FWMH because we believe, like Strul and Bendriem (9), that FWHMs can be correctly derived from phantom studies. Our comparative study indicates that the 2 GTM implementations perform PVE corrections similarly for the application we considered. For imaging of striatal structures with a conventional PET scanner operated in 3D mode, this study showed that modeling of the scanner transfer function by a gaussian kernel is reasonable, indicating that operative PVE correction in a clinical environment is possible.
The 18F-l-dopa Monte Carlo simulation enabled us to assess the robustness of the GTM correction with respect to registration error. The simulation was performed under realistic conditions for PET–MRI registration for an object that strictly followed the hypotheses of the GTM method (7 homogeneous tissue structures). A simple quality control check of the accuracy of the retrospective registration procedures guarantee a typical residual shift error of about 1.5 mm. This value corresponds to a 1.5-mm translation error or a 3° rotation error, which we used in the simulations. A confidence interval for the recovery may be inferred by considering the results of our study: The accuracy of the recovery remains as good as that under ideal conditions (mARC ∼ 100%), but the precision cannot be better than 5%.
Our group previously showed that the sinogram and image approaches behave similarly with respect to misregistration (36). Both approaches similarly recovered the uncorrected TACs for every anatomic structure modeled in our study.
We again used the 18F-l-dopa Monte Carlo simulation study to assess the robustness of the GTM method with respect to segmentation error. No registration error was introduced, and the object strictly followed the GTM hypotheses. We simulated various segmentation errors by choosing the structure DRight Caudate to be different from the corresponding object introduced in the simulation. To study the effects of segmentation errors, we chose to generate a family of erroneous shapes systematically. In accord with our experience with hand-delineation of 3D objects, and considering the compact shape of the striatal nuclei, only specific shape variants were generated. We believed that the missegmentation problem could not be studied from a very small set of shapes segmented by human operators or given by one or a few segmentation algorithms. We preferred to generate a realistic set of missegmented data that could be compared with each other.
According to our findings, the recovery performance of the GTM method is degraded when realistic segmentation errors appear. Typical segmentation errors may be considered to be between the ideal and the extreme shapes of the dilated or eroded object. Considering the geometry of the striatum and the contrast conditions of the cerebral series that were studied, the accuracy of the recovery is degraded and cannot be greater than 95% (or less than 105%). For striatal imaging with nuclei of equally small size, the segmentation error influences recovery of the activity of only the erroneously segmented structure. Therefore, no additive effect from the potential multiple segmentation error is expected.
Given our implementations of the GTM PVE correction, the misregistration and missegmentation phenomena propagate errors in 2 ways. They contribute as additive terms to the relative error on the corrected activity, with this relative error being equal to (1 − ARC). If we consider the conditions of this study and the errors that remain after a classic registration or segmentation process (manual or automatic), the GTM PVE correction method appears to be more affected by segmentation residual errors than by registration residual errors.
CONCLUSION
For 18F-l-dopa and 11C-raclopride PET studies used for the follow-up of neurodegenerative diseases such as PD or HD, PVE correction of the regional mean activity is a crucial preprocessing step for kinetic analysis. The GTM method is dedicated to regional mean activity correction for PVE and uses a priori anatomic information. The method relies on estimation of the RSFs corresponding to structures with homogeneous activity, as delineated on MR images. From realistic Monte Carlo simulations and a validation using a realistic phantom of the striatum, we showed that exhaustively accounting for the intrinsic crystal PSF enables good PVE correction. We also showed that, for cerebral studies performed with current PET scanners operated in 3D mode, a simple description of the global PET system PSF with a gaussian kernel in image space yields comparably good PVE correction with very little computation cost. The image GTM approach is a fast and robust implementation of the GTM general scheme for PET striatal imaging and may easily be adapted to any PET system or any isotope. The GTM method relies on PET–MRI registration accuracy and on the segmentation of the structures for which correction is performed. Under the conditions of our study, the accuracy of the state-of-the-art multimodality registration procedures with light quality control does not perturb the accuracy of the GTM PVE correction method. We proposed a means to study the effect of the segmentation error on GTM correction accuracy, and we showed that it may be perturbed by the quality of the results obtained by the currently available automatic segmentation procedures; the GTM correction remains operative if careful quality control is performed on the segmentation step. Our findings indicate that the GTM method, like other PVE correction methods, probably will especially benefit from improvements in segmentation on individual MR images.
Footnotes
Received Mar. 25, 2002; revision accepted Aug. 8, 2002.
For correspondence or reprints contact: Vincent Frouin, MSc, Service Hospitalier Frédéric Joliot, 4 place du Général Leclerc, 91401 Orsay, France.
E-mail: frouin{at}shfj.cea.fr
REFERENCES
In this issue


Jump to section
Related Articles
Cited By...
- Lower Brain Glucose Metabolism in Normal Ageing is Predominantly Frontal and Temporal: A Systematic Review and Pooled Effect Size and Activation Likelihood Estimates Meta-Analyses
- An Anthropomorphic Phantom Study of Brain Dopamine Transporter SPECT Images Obtained Using Different SPECT/CT Devices and Collimators
- New Approach to Quantification of Molecularly Targeted Radiotracer Uptake from Hybrid Cardiac SPECT/CT: Methodology and Validation
- Regional variability of imaging biomarkers in autosomal dominant Alzheimer's disease
- Voxel-Based Analysis of Asymmetry Index Maps Increases the Specificity of 18F-MPPF PET Abnormalities for Localizing the Epileptogenic Zone in Temporal Lobe Epilepsies
- Muscarinic Receptor Upregulation in Patients With Myocardial Infarction: A New Paradigm
- Age-associated leukoaraiosis and cortical cholinergic deafferentation
- Design and Implementation of an Automated Partial Volume Correction in PET: Application to Dopamine Receptor Quantification in the Normal Human Striatum
- Estimation of the {beta}+ Dose to the Embryo Resulting from 18F-FDG Administration During Early Pregnancy
- Up-regulation of hippocampal serotonin metabolism in mild cognitive impairment
- Partial-Volume Effect in PET Tumor Imaging
- Partial-Volume Correction in PET: Validation of an Iterative Postreconstruction Method with Phantom and Patient Data
- Integrated Software for the Analysis of Brain PET/SPECT Studies with Partial-Volume-Effect Correction