


Abstract
We present software for integrated analysis of brain PET studies and coregistered segmented MRI that couples a module for automated placement of regions of interest (ROI) with 4 alternative methods for partial-volume-effect correction (PVEc). The accuracy and precision of these methods have been measured using 4 simulated 18F-FDG PET studies with increasing degrees of atrophy. Methods: The software allows the application of a set of labels, defined a priori in the Talairach space, to segmented and coregistered MRI. Resulting ROIs are then transferred onto the PET study, and corresponding values are corrected according to the 4 PVEc techniques under investigation, providing corresponding corrected values. To evaluate the PVEc techniques, the software was applied to 4 simulated 18F-FDG PET studies, introducing increasingly larger experimental errors, including errors in coregistration (0- to 6-pixel misregistration), segmentation (−13.7% to 14.1% gray matter [GM] volume change) and resolution estimate errors (−16.9% to 26.8% full-width-at-half-maximum mismatch). Results: Even in the absence of segmentation and coregistration errors, uncorrected PET values showed −37.6% GM underestimation and 91.7% WM overestimation. Voxel-based correction only for the loss of GM activity as a result of spill-out onto extraparenchymal tissues left a residual underestimation of GM values (−21.2%). Application of the method that took into account both spill-in and spill-out effects between any possible pair of ROIs (R-PVEc) and of the voxel-based method that corrects also for the WM activity derived from R-PVEC (mMG-PVEc) provided an accuracy above 96%. The coefficient of variation of the GM ROIs, a measure of the imprecision of the GM concentration estimates, was 8.5% for uncorrected PET data and decreased with PVEc, reaching 6.0% for mMG-PVEc. Coregistration errors appeared to be the major determinant of the imprecision. Conclusion: Coupling of automated ROI placement and PVEc provides a tool for integrated analysis of brain PET/MRI data, which allows a recovery of true GM ROI values, with a high degree of accuracy when R-PVEc or mMG-PVEc is used. Among the 4 tested PVEc methods, R-PVEc showed the greatest accuracy and is suitable when corrected images are not specifically needed. Otherwise, if corrected images are desired, the mMG-PVEc method appears the most adequate, showing a similar accuracy.
- picture archiving and communication systems
- correlative imaging
- neurology
- MRI
- partial-volume effect
- PET
- SPECT
Despite technologic advances, PET and SPECT remain characterized by relatively low spatial resolution, in most instances approximately 6 mm in full width at half maximum (FWHM). As a result, in structures with dimensions similar to the spatial resolution of the scanner (i.e., smaller than 2 times the FWHM), such as the neocortex, the apparent radiotracer concentration is influenced by surrounding structures, a phenomenon known as the partial-volume effect (PVE) (1). This effect is particularly critical when the relative proportion of brain tissue components is altered, such as when imaging degenerative diseases in which cortical atrophy is present (e.g., in Alzheimer’s disease [AD]). In these situations, at least part of the observed decrease in the cortical uptake of PET tracers (e.g., 18F-FDG) can be explained on the basis of PVE, thus potentially impeding our understanding of the disease.
PVE correction (PVEc) is theoretically possible if both the distribution of the tissue components within the functional images and the spatial resolution of the scanner are known. Specifically, high-resolution structural imaging, such as MRI, provides the necessary morphologic information which, coupled with the knowledge of scanner resolution, can be used to correct functional images for PVE and obtain accurate maps of distribution of the tracer in different brain tissues. Several PVEc approaches have been designed. Although there is consensus about the need for PVEc (2,3), none of the proposed PVEc techniques has thus far gained routine use in PET/SPECT imaging.
The first proposed PVEc method implemented a correction of whole-brain PET data for metabolically inactive cerebrospinal fluid (CSF) as measured on CT (4,5). In this method, whole-brain PET data were divided by the intracranial percentage of CSF (sulcal plus ventricular), thus providing average parenchyma values. However, gray matter (GM) and white matter (WM) values were not assessed separately. This correction led to an increase in the estimated whole-brain glucose metabolic rate (CMRGlc) of 9% (from 5.5 to 6.0 mg/100 g/min) in elderly healthy volunteers and 16.9% (from 4.5 to 5.26 mg/100 g/min) in age-matched patients with AD (5). The same approach was subsequently applied to region-of-interest (ROI) data, using corresponding fractional CSF values derived from coregistered segmented MRI (6). In temporal ROIs, the CSF fraction ranged from 8% to 17% in AD patients and from 1% to 5% in elderly controls.
In this approach, however, the assumption was that the tracer would be taken up by a single hot structure surrounded by cold tissues. In brain 18F-FDG and cerebral blood flow (CBF) studies for which this method was originally proposed, however, the GM is surrounded by both CSF (without significant activity) and WM (with a tracer concentration approximately 4 times lower than GM [7]), making the final corrected results dependent on the amount of WM included in the ROI. Moreover, the method did not take into account the 3-dimensional distribution of the tracer (i.e., did not take into account PVE from the slices above and below the ROI).
A more refined approach was subsequently proposed, based on simulation of the PET image generation process (referred to here as “virtual PET”). In its simplest implementation, the brain parenchyma as obtained by segmentation of MRI was degraded to the 2- or 3-dimensional resolution of the PET scanner to obtain a virtual PET image of the pure parenchyma (8,9). Correction of the PET images for PVE from the CSF was then performed on a pixel-by-pixel basis by dividing the real PET image by the corresponding virtual PET. This method was recently used in 18F-FDG PET scans of patients with AD, showing that PVEc removed only part of the brain hypometabolism typical of this disorder (10). This approach, however, again ignored the fact that tracer distribution within brain parenchyma is heterogeneous.
This method was subsequently improved to take into account the different contributions from GM, WM, and CSF (11). The first step in this approach was to generate a virtual PET for WM by multiplying the WM-segmented image by a WM tracer concentration measured in areas where PVE was negligible (e.g., centrum semiovale) and then degrading it to the PET scanner resolution. The WM virtual PET was then subtracted from the real PET image. The resulting image represented a selective real PET image of the GM. A GM virtual PET image was then generated as described previously from the GM-segmented MRI dataset convolved by the PET scanner resolution. To obtain a PVE-corrected GM PET image, the real PET of the GM was then divided by the GM virtual PET. This approach was validated on datasets from 2 PET scanners with different spatial resolution, showing in healthy subjects an average increase in apparent global CMRGlc of 29% and 24% for tomographs with medium and high resolutions, respectively, and rising to 75% and 65%, respectively, in AD patients. The difference in whole-brain glucose metabolism between healthy volunteers and individuals with AD consequently decreased from 31% to 17% (12).
This approach, however, assumes that GM tracer uptake is homogeneous throughout the brain (i.e., presents only a small fluctuation around a mean value), which obviously may not always be true. To address this issue, an iterative approach handling the contribution from manually selected GM substructures (e.g., amygdala, caudate, thalamus) was suggested and used in 17 patients with mesial temporal lobe epilepsy and hippocampal sclerosis to assess hippocampal benzodiazepine receptors (13–15). The application of this PVEc method revealed decreased 11C-flumazenil binding in the affected hippocampus in all patients, compared with only 11 of 17 before correction.
A more general approach to multicompartment analysis was subsequently proposed and used a matrix of geometry-dependent transfer coefficients that represented, for a given set of ROIs, the fractions of true activity exchanged between each couple of brain regions because of PVE (16).
Finally, because the WM virtual PET used in previous methods relied on the knowledge of “true” WM concentration, which may be more or less accurate depending on the setting of the measure, it was proposed that the methods needing this estimate may take advantage of the WM value calculated according to the matrix of transfer coefficients (17).
Apart from inaccuracies in PET data intrinsic to the technique (e.g., inaccuracies in this scatter, inaccuracies in the attenuation-correction process, or nonlinearity of the scanner), which will not be addressed here, the main sources of potential inaccuracies in PVEc methods based on the virtual PET include MRI–PET misregistration, segmentation inaccuracies, inaccurate estimation of the PET/SPECT resolution, inadequacy of the assumption of homogeneity of tracer concentration within an ROI, and sources of activity not considered in the model (e.g., outside the field of view [FOV]). Each of these factors can influence the final results by interfering at different steps of the process, potentially with opposite effects (i.e., leading to under- or overestimation) that may lead to unpredictable effects.
A comparison of 2 MR-based PVEc techniques found a 10% confidence interval for PVE-corrected GM values when tested with a large array of simulated errors (18). Among the sources of error, misregistration and segmentation inaccuracies had the greatest effect.
The aim of the present study was 2-fold: to develop software for the integrated analysis of brain PET studies with coregistered segmented MRI, coupling a module for automated placement of ROIs (19,20) with the implementation of 4 PVEc methods (9,11,16,17), and to systematically assess under controlled conditions the accuracy of each of these PVEc methods, using simulated 18F-FDG PET studies.
MATERIALS AND METHODS
ROI Definition
The first step in the PVEc software implemented here applied a set of ROIs defined a priori from the Talairach atlas (21) onto the segmented coregistered MR image, thus providing automated definition of GM structures. Given the PET/MRI coregistration, this set of ROIs could then be transferred onto the PET dataset for use in the subsequent steps. The original method was adapted as described previously in detail (19,20).
After manual identification by the observer of the center of the anterior (AC) and posterior (PC) commissures, the software automatically finds the limits of the box encompassing the supratentorial brain, realigns the brain to the AC–PC line, and corrects for residual malrotation around the y-axis by centering the interhemispheric fissure (automatically detected as the part of space above the AC–PC line with less GM). GM voxels are then labeled depending on their location with respect to the 1,056 small boxes composing the Talairach space, which have been assigned a priori to a set of cortical structures of interest, based on the Talairach atlas. For the present work, 7 supratentorial ROIs (medial and lateral frontal, parietal, and temporal cortices and occipital cortex) and a single ROI for subtentorial GM were defined for each side. Two additional ROIs were defined as the sum of all the voxels segmented as WM and CSF, respectively.
Note that in this process the subject’s brain image was not spatially normalized to Talairach’s atlas, but the proportional grid of the latter was applied to the subject’s PET images from knowledge of the individual’s Talaraich reference points.
PVE Correction Software
After generation of the individual’s ROIs, the 4 PVEc methods were successively applied (corresponding acronyms are from the initials of the authors who first described each method), providing for each ROI 4 alternative sets of PVE-corrected data.
Voxel-based correction was implemented as proposed by Meltzer et al. (9) only for the loss of GM activity as a result of spill-out onto extraparenchymal tissues (i.e., CSF and extracerebral structures), which are assumed to have negligible tracer uptake. This method will be referred to as M-PVEc.
Voxel-based correction for both the loss of GM activity as a result of spill-out onto non-GM tissues (i.e., CSF, WM, and extracerebral structures) and the gain in GM activity as a result of spill-in from adjacent WM was implemented as proposed by Müller-Gärtner et al. (11). This method assumes WM tracer uptake to be homogeneous (which is a reasonable assumption for 18F-FDG and regional CBF [rCBF] studies) and accurately measured in a large WM region, chosen in the present work as the center of the centrum semiovale (Fig. 1A). This method will be referred to as MG-PVEc.
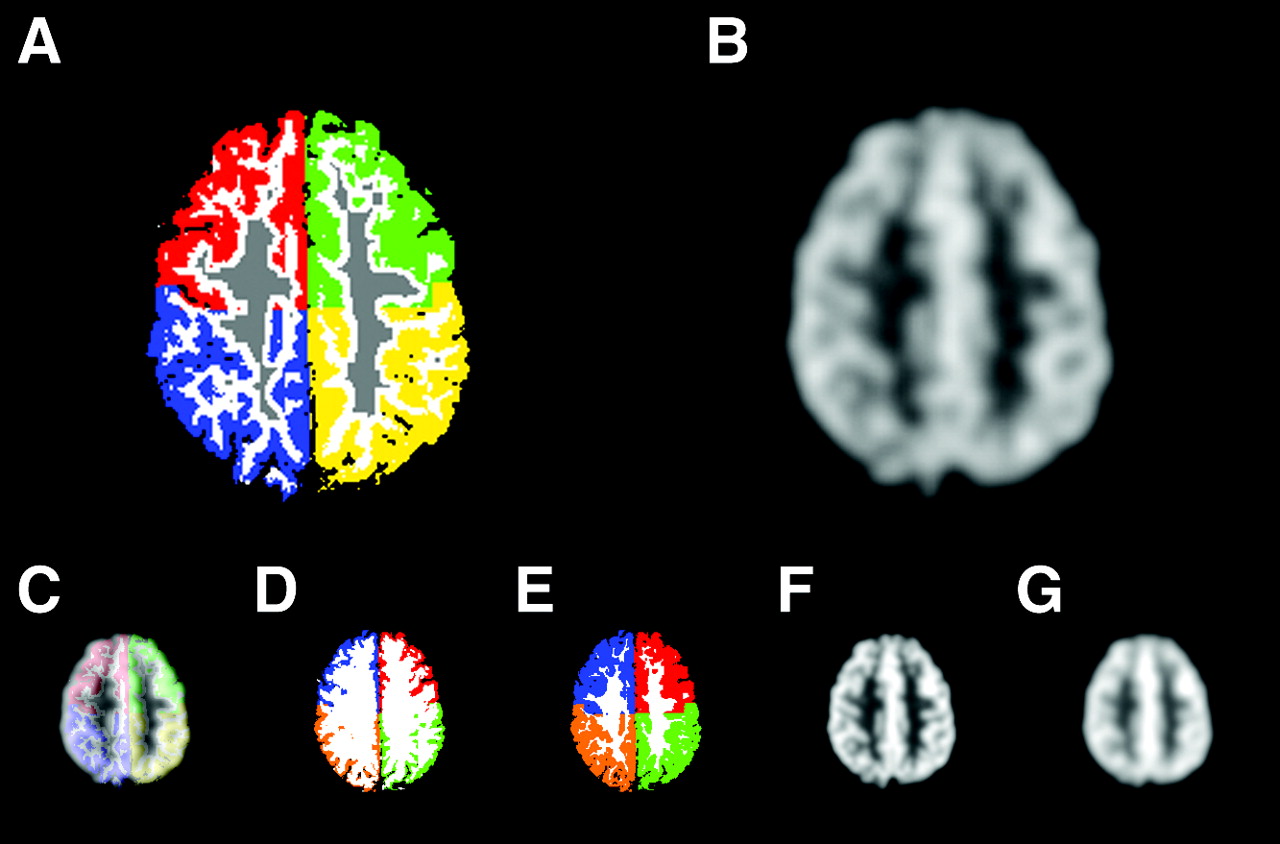
Representative slice at the level of the centra semiovalia from a 30-y-old healthy volunteer. (A) Segmented MRI used for PET simulation. GM ROIs are color coded (medial and lateral sections are pooled; left and right frontal lobe GM is green and red; left and right parietal GM is yellow and blue; WM voxels used for definition of mean WM value for MG-PVEc are gray; remaining WM is white). (B) Corresponding simulated PET slice. Also represented are the largest errors introduced in registration (with simultaneous display of segmented MRI and simulated PET with 6-pixel misalignment along the x-axis) (C); segmentation (with GM volumes of −9.7% and 10.1%) (D and E, respectively); and resolution estimate (with virtual PET as provided for feedback by the program, 8.7- and 13.2-mm FWHM) (F and G, respectively). Note that for registration and resolution estimate errors, detection of the error is possible by simple visual assessment.
The third method implemented was for correction of ROI values. This method, proposed by Rousset et al. (16), took into account both the spill-in and the spill-out effects between any possible couple of ROIs, thus constructing a transfer matrix, which, with the corresponding PET values, constituted a system of equations with a solution that provided “true” ROI values. This method will be referred to as R-PVEc.
Finally, the modification proposed by Rousset (17) to the MG-PVEc method was also implemented using the WM value calculated according to R-PVEc. This method will be referred to as mMG-PVEc (for modified MG-PVEc).
The interested reader is referred to the original papers for details on the general theories underlying these methods. The actual implementation of these 4 algorithms (M-PVEc, MG-PVEc, R-PVEc, and mMG-PVEc) is presented here.
M-PVEc.
First, the map of brain parenchyma (i.e., a coregistered segmented MRI, where GM and WM voxels were set to 1 and all other voxels to 0) was convolved by the in-plane point-spread function (PSF) of the corresponding PET image by gaussian filtering its fast Fourier transform (FFT). (We used for validation a 10.4-mm FWHM as a best estimate of the average resolution at the level of the cortex.) This provided a map of the spillover aspect of PVE, each voxel having a value ranging from 0 to 1, with 1 indicating that 100% of the activity contained in that voxel came from the brain parenchyma, whereas lower values indicated that a progressively decreasing fraction of the activity measured in that voxel derived from the brain. The map was then smoothed along the z-axis to also consider axial resolution, providing a correction map for the PET values. (In the validation process, we used a 3-point iterative smoothing with 1-8-1 weight factors replicated 3 times, obtaining the same axial FWHM as the simulated PET.)
The PET parenchyma voxels (i.e., voxels labeled as GM or WM in the segmented registered MRI) were then divided by the corresponding value in the correction map, and other pixels were zeroed.
MG-PVE.
The operator was interactively asked to select a slice in which a large WM region was present (throughout the validation procedure described here, this would always be the slice at the level of the centrum semiovale). The software then derived the mean value for the voxels labeled as WM in the corresponding segmented MRI slice, after a 4-pixel erosion of the edge of the ROI to avoid peripheral WM that might present large spill-in PVE from surrounding GM (Fig. 1A).
A WM virtual PET image was then generated by convoluting the WM map (i.e., the WM voxels in the segmented images, set to the measured mean WM value) by the in-plane PSF and then smoothing it along the z-axis to replicate the PET axial resolution. The WM virtual PET image was then subtracted from the real PET image to leave only the counts resulting from the GM structures.
The resulting images were then corrected in a way similar to that in the M-PVEc method, by dividing only the GM voxels by the corresponding values from the GM virtual PET image (i.e., a correction map obtained by in-plane FFT and axial smoothing of the GM map), whereas non-GM voxels were zeroed.
R-PVEc.
Each ROI was 3-dimensionally smoothed as in the 2 previous algorithms (in-plane FFT filtering and axial smoothing) replicating the PET resolution. The ROIs of structures supposed to concentrate the tracer (in our case the GM ROIs) were dilated using a 3 × 3 × 3 kernel, whereas the low-activity ROIs (here, the WM and CSF ROIs) were eroded accordingly. This was done to reduce the risk of having GM activity located outside the GM ROIs as a result of registration errors and to minimize the effect of misregistration on the accuracy of calculations. For each ROI, the percentage of the activity spilling into each dilated (or, for WM and CSF, eroded) ROI was measured and stored as a member of a transfer matrix. Because CSF does not have metabolic activity, the members of the transfer matrix that refer to the percentage of activity spilling from CSF were zeroed. The ROI set (including WM and CSF) was applied to the PET study to derive original PET values. The original PET values and the transfer matrix constituted a system of linear equations with the same number of equations and unknowns, the unknowns being the true mean ROI values. The transfer matrix was inverted by single-value decomposition to solve the system of equations, thus allowing the calculation of the unknowns that represented our best estimates of the true mean value of each ROI. Note that the estimated CSF value was forced to 0 by zeroing the transfer matrix members representing efflux from CSF. This allowed us to take advantage of a priori knowledge of the lack of appreciable metabolic activity in CSF to increase the accuracy of the estimates of 18F-FDG concentration in GM. (However, the software allows exclusion of this option in the analysis of studies in which there may be appreciable tracer concentration in CSF).
mMG-PVEc.
For this method, the software replicates the MG-PVEc process using the WM value provided by the R-PVEc module.
GM and WM virtual PET images generated for pixel-based correction methods (M-PVEc, MG-PVEc, and mMG-PVEc) were routinely displayed by the PVEc software (merged with a 4-to-1 intensity ratio), to allow visual comparison with the PET image being analyzed (Figs. 1F and 1G).
For each study, the software provided 5 sets of results deriving from the application of the ROI set on the uncorrected PET data and on the 3 corrected PET image sets (from M-PVEc, MG-PVEc, and mMG-PVEc) and from correction of PET data using R-PVEc.
Validation
Virtual PET Phantom.
To assess the performance of the different PVEc techniques in controlled conditions, 4 virtual PET phantoms were obtained by applying a simulated PET image generation process onto the segmented brain MRIs from 4 individuals selected to cover a wide range of brain atrophies.
The study set included 2 healthy volunteers (aged 32 and 80 y, with CSF volume = 8.0% and 16.5% of total intracranial volume, respectively) and 2 patients with Alzheimer’s disease (aged 63 and 76 y, with CSF volume = 23.3% and 29.3% of total intracranial volume, respectively).
The MRI dataset had been acquired at 1.5 T (Magnetom SP63; Siemens) with sequential acquisition of 2 interleaved sets of oblique axial slices (15 slices per set, slice thickness = 4 mm, slice interval = 4 mm), segmented into GM, WM, and CSF using an automated segmentation procedure (22).
The generation of virtual PET simulating the features of the ECAT EXACT 47 PET scanner (Siemens), described in detail elsewhere (23), was then applied to the segmented MRI studies. Briefly, to simulate the natural contrast between GM and WM in 18F-FDG PET studies, the procedure assigned predefined values of 255 and 64 to the GM and WM pixels, respectively, of the segmented images to obtain a 4-to-1 ratio (7), then rebinned the images onto the central 96 × 96 pixels of a 128 × 128 matrix to simulate the PET scanner detector ring size and applied a scale factor of 0.08 to simulate the total true counts of a typical 18F-FDG PET study.
Subsequently, a 190-view × 160-angle sinogram was obtained for each plane, and rows were smoothed with a 3-point smoothing filter (weight 1-1-1) applied from 1 (central column of the sinogram) to 6 times (periphery of the sinogram) to simulate detection-angle error and differential angular resolution from the center to the periphery of the detectors.
Finally, photon attenuation (using a linear attenuation coefficient of 0.088 cm−1), Poisson-distributed noise (generated by Montecarlo simulation), and measured attenuation correction were simulated, providing the final sinogram that was then reconstructed using a Hann filter with 0.4-pixel cutoff, 1.5 zoom factor, and 128 × 128 reconstruction matrix. Resulting images were then rebinned to 256 × 256, matching the original segmented MRI pixel size.
The resulting volumes were then smoothed along the z-axis applying a 3-point smoothing (weight factors 1-8-1) 3 times.
The same procedure was applied to a 166 × 166 pixel square matrix with a constant value of 128 used as a calibration phantom and to a matrix containing 3 pixels set to 1, located at 0, 40, and 80 pixels off center. This allowed us to measure the in-plane radial resolution of the simulator at these locations, which resulted in 9.7, 10.3, and 10.5 mm FWHM, respectively.
Error Sources.
The implemented PVEc methods were based on exact knowledge of the composition of each PET voxel, supposedly provided by a perfectly registered segmented MR image, and on the knowledge of the resolution of the PET images along the 3 axes.
Although these conditions apply to the virtual PET phantoms (which are intrinsically registered with the MR image from which they were generated), this is not the case for real PET studies. Indeed, errors are associated with currently available registration procedures (24); with the PSF, because the resolution of emission tomography is not constant across the FOV (degrading up to 40% from the center to the periphery for brain-dedicated scanners) (25); and with MRI segmentation (although it should be noted that the actual accuracy of segmentation techniques applied to human brain studies is not known because of the lack of a gold standard for such measurement).
To assess the performance of the PVEc procedures under a large range of conditions that could be expected in human brain PET studies, 3 types of error were introduced. The first of these was 7 degrees of registration error, ranging from 0 to 6 pixels. This was obtained by increasingly shifting the segmented MR image along the x-axis with respect to the virtual PET image (Fig. 1C). The second type was 11 degrees of segmentation error ranging from −13.7% to 14.1% of total GM volume, simulating a systematic shift of the GM/WM interface alternately into 1 of the 2 tissues. This was obtained by assigning first a progressively thicker GM strip at the GM/WM interface to WM and then assigning a progressively thicker WM strip to GM (Fig. 1D). The third type of error was 7 degrees of resolution mismatch, obtained using different in-plane resolutions ranging from 8.7 to 13.2 mm FWHM (including 10.4 mm, chosen as the optimal FWHM based on the values of the 3 simulated line sources) (Fig. 1E), whereas the axial resolution was kept constant to the value used in the PET simulation process.
Accordingly, for each of the 4 phantoms 7 × 11 × 7 (total, 539) values were obtained for each GM ROI and each of the 4 PVEc methods.
To assess the sensitivity of each PVEc method separately to each of these 3 types of simulated errors, subsequent data analysis was performed on 3 corresponding subsets of data, each characterized by a single source of error (e.g., the subset with segmentation error was formed by the results obtained in the 44 simulations without misregistration or resolution estimate error), pooled across the 4 phantoms. To estimate the overall accuracy of each PVEc method separately, the whole dataset comprising the 2,156 combinations of errors (539 for each of the 4 phantoms) was then analyzed.
Finally, to estimate the accuracy and precision of uncorrected and corrected measures under more realistic experimental conditions, a smaller subset of 825 error combinations, selected excluding easily avoidable errors (i.e., those derived from the use of poor coregistration techniques, incorrectly measured image FWHM, and poorly reproducible segmentation techniques) was also set up using error combinations obtained at or below 4 pixels misregistration, an FWHM estimate between −12.0% and 16.3% of the optimal value, and GM volume changes resulting from segmentation error within −5.3% and 5.5%.
Data Analysis
Both accuracy and precision of the uncorrected measures as well as of the 4 PVEc methods were evaluated.
Accuracy was estimated by GM and WM recovery coefficients (hereafter referred to as GMR and WMR, in analogy to the GMR used by Meltzer et al. (9)), defined for each ROI as the ratio between the measured and the true value. Thus, 100% would represent perfect correspondence between the value used in simulation and the measured value either before or after PVEc, whereas <100% would indicate underestimation and >100% overestimation.
Precision was measured by the coefficient of variation of the 15 GM ROI values (hereafter referred to as GCV). The GCV was calculated for each single dataset (i.e., for each combination of errors) as the CV of the values of the 15 GM ROIs. A GCV equal to 0% would indicate an internally perfect consistency of the results (i.e., perfect PVEc in the absence of noise, GCV being increased both by the enhancement of image noise intrinsic to PVEc and by residual uncorrected PVE).
On the 3 single-error subsets and the full dataset, differences in accuracy and precision of results of each PVEc technique were tested for significance by 1-way repeated-measures ANOVA, followed whenever applicable by post hoc paired t tests corrected for multiple comparisons according to Bonferroni. The significance level was set at P < 0.05.
All the software for automated ROI placement, PVEc, and PET simulation was written using Interactive Data Language (Research Systems Inc.). The statistical analysis was performed using GB-Stat (Dynamic Microsystems Inc.).
RESULTS
Table 1 reports the mean and SD of GMR, WMR, and GCV values obtained without correction and when applying the 4 PVEc schemes. The reported results were obtained assuming optimal conditions (no segmentation, registration, or PSF estimate error), separately for each of the 3 single-error subsets, averaged across all error combinations, and for the subset of 825 combinations of smaller errors.
Accuracy and Precision of Uncorrected and Corrected Data Over 4 Simulated PET Studies
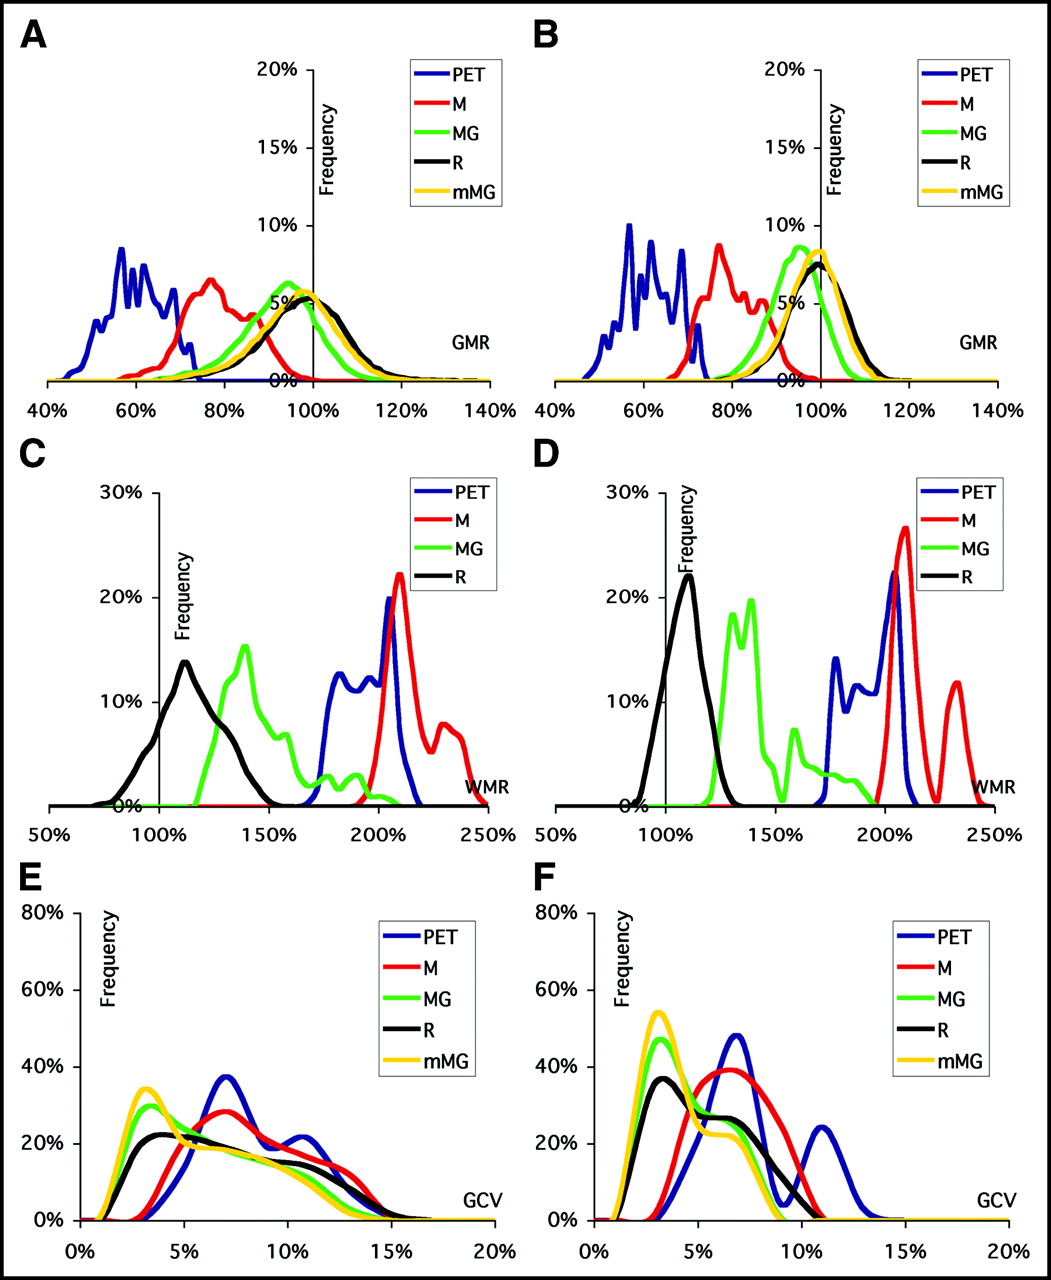
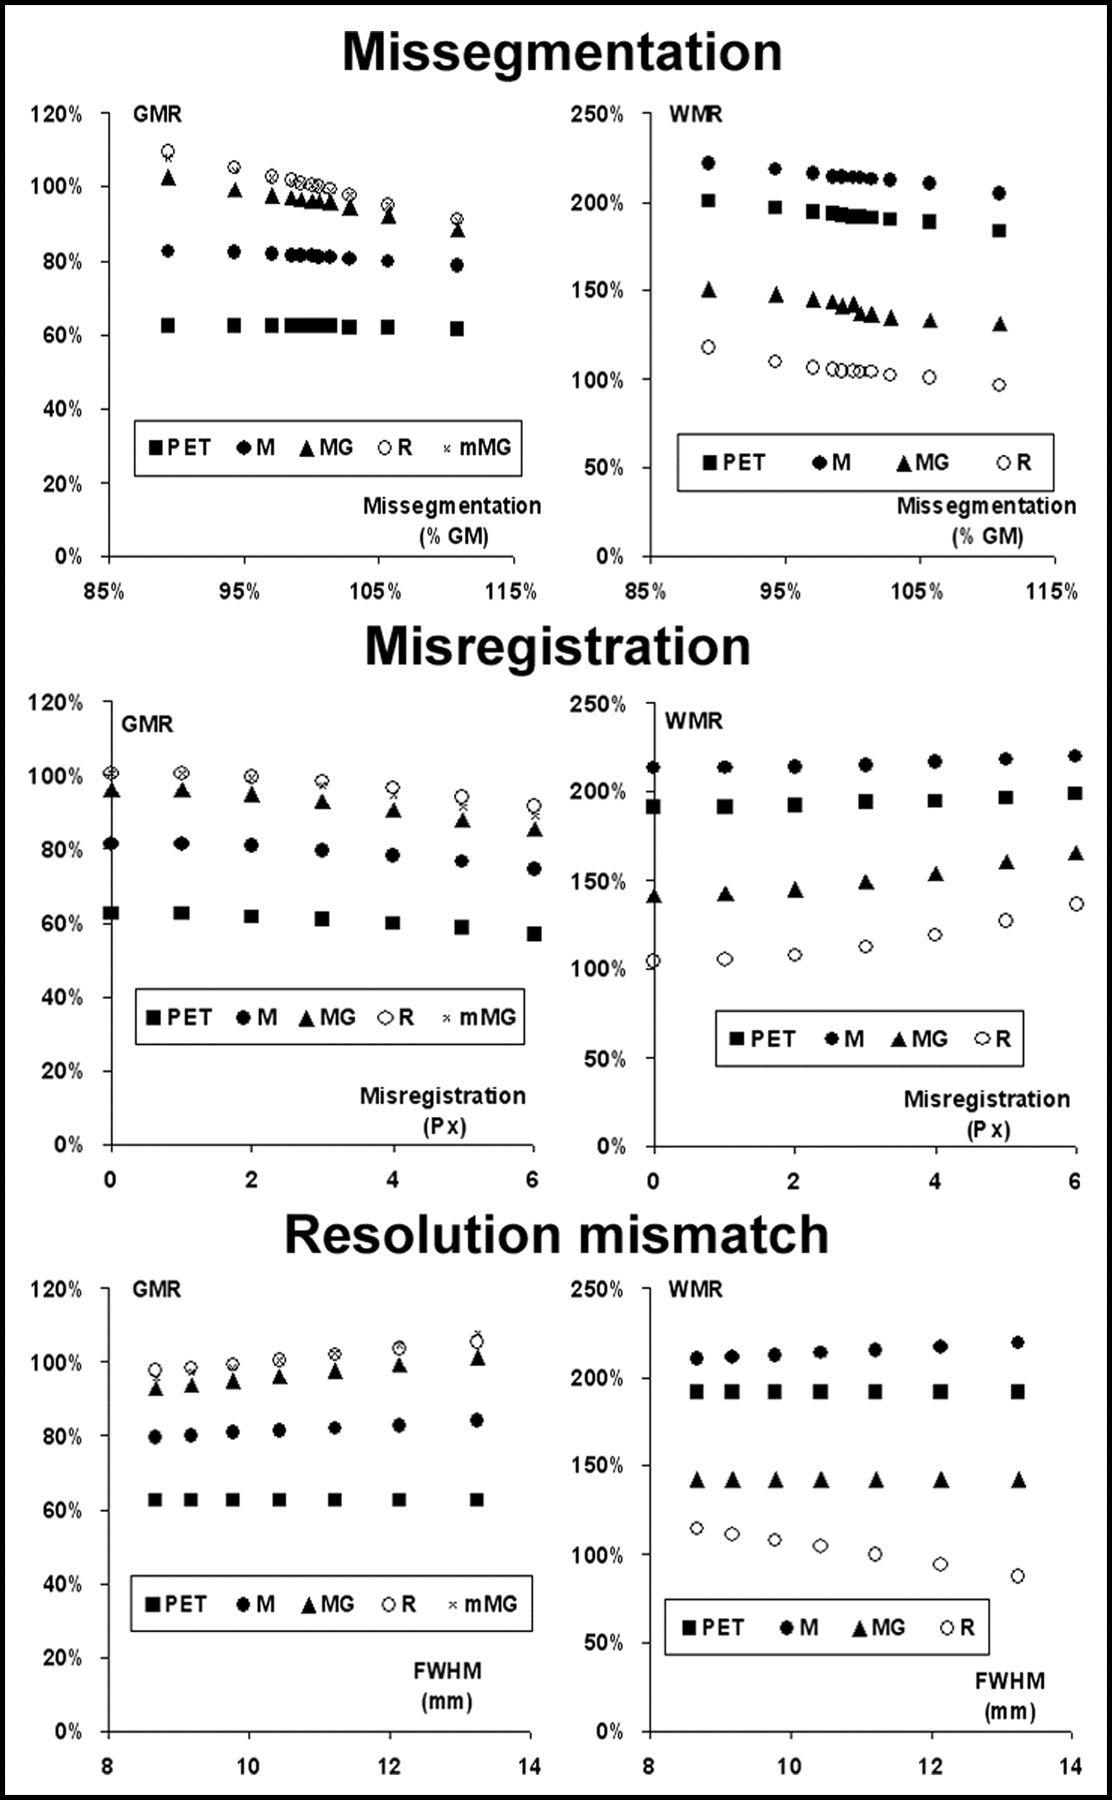
Examples of the corrected images provided by the M-PVEc, MG-PVEc, and mMG-PVEc methods are illustrated in Figure 2. Histograms of the frequencies of GMR, WMR, and GCV values are reported in Figure 3 for both the whole dataset and the subset with a reduced array of errors. In Figure 4 the mean GMR and WMR are plotted versus the different tested degrees of segmentation, registration, and resolution estimate errors. The corresponding plots for GCV are shown in Figure 5.
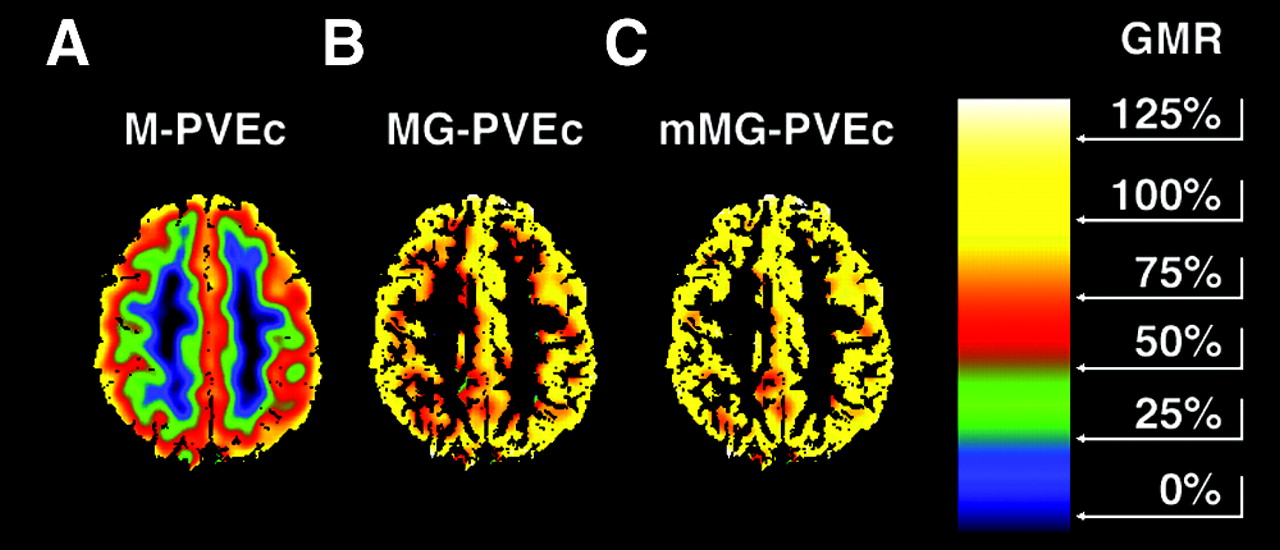
Same PET image as in Figure 1B, corrected for PVE according to M-PVEc (A), MG-PVEc (B), and mMG-PVEc (C) under optimal conditions. Color scale ranges from 0% to 150% GMR. A substantial residual underestimation of GM values remained after M-PVEc and was still present at the GM/WM interface when using MG-PVEc, because of the overestimation of WM, and was further decreased when using mMG-PVEc, as can be noted by the reduction of red pixels (GMR, 50%–75%) at the inner GM in C.

Frequency histograms of GMR (A and B), WMR (C and D), and GCV (E and F) for uncorrected (PET) and corrected (M, MG, R, mMG) values. Data are plotted for the results of validation on the full dataset ([A, C, and E] misregistration ≤ 6 pixels; FWHM estimate ranging from −16.9% to 26.8% of the optimal value; GM volume changes resulting from segmentation error ranging from −13.7% to 14.1%) and on the dataset derived by the introduction of a reduced span of errors ([B, D, and F] misregistration ≤ 4 pixels; FWHM estimate between −12.0% and 16.3% of the optimal value; GM volume changes resulting from segmentation error between −5.3% and 5.5%).

Effect of the 3 tested errors on the accuracy of the estimates of GM (left) and WM (right) ROIs before (PET) and after correction with the 4 PVEc techniques implemented.

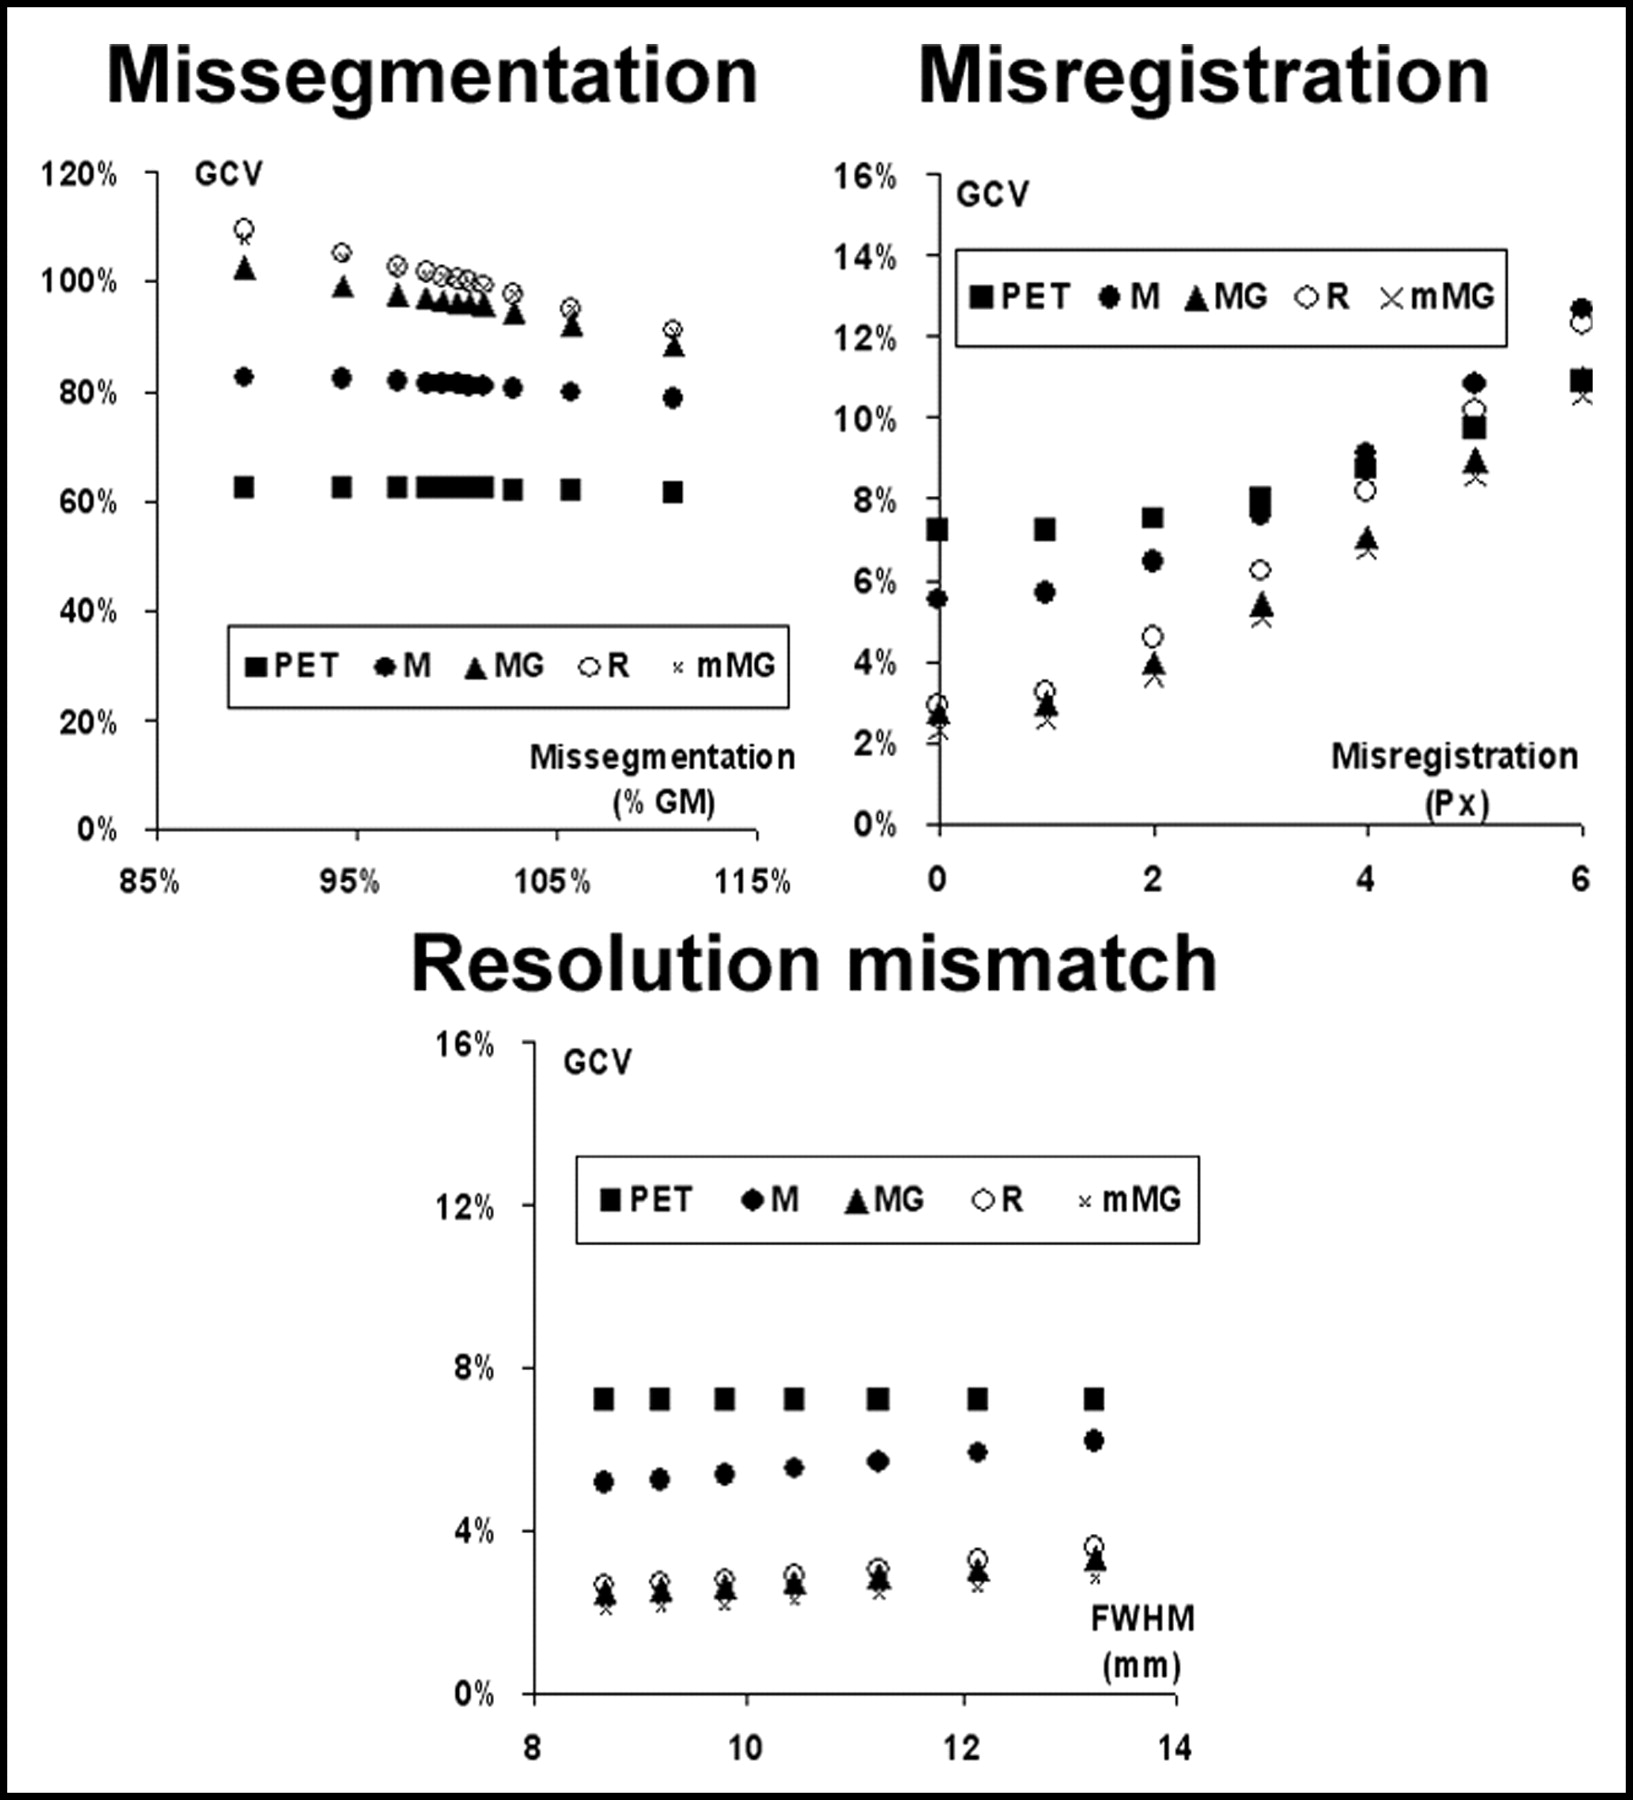
Effect of the 3 tested errors on the precision of the estimates of uncorrected GM values (PET) and after correction with the 4 PVEc techniques implemented. The coefficient of variation of the 15 GM ROIs (GCV) is plotted vs. the error introduced.
Accuracy
Even under optimal conditions, the uncorrected PET values were affected by a 37.6% underestimation for GM and a 91.7% overestimation for WM. PET data corrected with M-PVEc were still affected by large residual underestimation of GM and overestimation of WM tracer concentrations. Application of R-PVEc and mMG-PVEc resulted in a significantly improved suppression of PVE, with the mean GMR values obtained on the whole dataset within ±5% of the real value.
The accuracy of the GM concentration estimates, as assessed by GMR over the whole set of error combinations, was significantly different among PVEc methods, in the following order, beginning with the least accurate method: PET, M-PVEc, MG-PVEc, mMG-PVEc, and R-PVEc (Bonferroni-corrected P < 0.05 for all differences). Likewise, the accuracy of the WM concentration estimates also significantly differed among methods, in the following order, beginning with the least accurate: M-PVEc, PET, MG-PVEc, and R-PVEc (P < 0.05 for all). These same accuracy rankings were obtained when errors were introduced separately, independently of the source of error, with the exception of the segmentation error subset, with which R-PVEc was less accurate than mMG-PVEc (mean GMRs, 100.4% and 100.0%, respectively), and the FWHM error subset, with which there was no significant difference between mMG-PVEc and R-PVEc.
Precision
Precision of the GM concentration estimates, as assessed by GCV over all error combinations, was significantly lower when using uncorrected data and M-PVEc, with R-PVEc giving the highest GCV among the remaining 3 correction techniques.
For PET and M-PVEc, the high GCVs are clearly the result of variability in the data introduced by PVE, whereas for R-PVEc, this appears mainly to be the result of a greater sensitivity of this method to coregistration error, the major determinant of GCV for corrected data (Fig. 5, top right).
DISCUSSION
We have presented an integrated approach to brain 18F-FDG PET data analysis, coupling automated ROI placement with PVEc of resulting data. Implementing 4 distinct PVEc methods allowed a comparison of their accuracy and precision by running the software over a large range of segmentation, coregistration, and resolution estimate errors.
To the best of our knowledge, this is the only work that has systematically compared these 4 PVEc methods and assessed their relative accuracy. Previous studies were limited to comparison of M-PVEc and MG-PVEc using simulated 18F-FDG PET studies (18) or R-PVEc and mMG-PVEc (in a method modified to handle multiple GM compartments) using simulated 18F-6-fluoro-𝓁-dopa (18F-DOPA) studies (13,17).
Overall, the R-PVEc method provided more accurate results than the 3 pixel-based correction methods. Among the latter, the mMG-PVEc, which takes advantage of the accuracy of R-PVEc in determining the true WM value, was the most accurate, providing a mean GMR only 1.5% lower than that of R-PVEc when tested over the whole set of simulated errors.
The M-PVEc method presented a significantly lower precision than the other pixel-based PVEc methods, resulting from the coupling of residual uncorrected PVE coupled with the increase in noise inherent in the process of PVEc.
Of the tested sources of error, misregistration errors showed the strongest impact on the accuracy of corrected values and were also associated with the largest CVs of GM values, an index of imprecision of corrected data.
To obtain a conservative estimate of the accuracy of these correction methods, a large interval of the 3 tested errors was used for the validation process, encompassing the range of errors possibly encountered in the analysis of real studies. The range of tested resolution errors (from −16.9% to 26.8%) with respect to the average resolution (10.4 mm FWHM) estimated at the level of the main structure of interest (cortex) largely comprises the range of possible errors that arise from the use of fixed in-plane and axial resolutions in the correction process.
The resolution of real PET can differ substantially between the periphery and the center of the FOV, where the axial FWHM can be more than 40% smaller compared with the edge of the brain (for head-dedicated PET scanners working in multislice configurations using interplane septa) (25). This results in a maximum error in resolution of 20% when using an intermediate resolution, corresponding to a mean FWHM error (averaged across all FOV pixels) of 2.5%.
These differences are much lower for the in-plane resolution and are further decreased when the actual resolution of the images (including additional blurring as a result of positron range in tissue and the resolution of the reconstruction filter) is considered.
The limited impact of the errors in resolution estimate, deriving from the use of a fixed FWHM, confirms previous findings that this method, which has a small computation cost, provides accuracy equivalent to that obtained using a more accurate FWHM simulation in which the intrinsic detector PSF is applied to the image sinograms (26).
For coregistration errors, a systematic assessment of MRI/PET registration techniques disclosed a mean error of <5 mm when coregistering PET to T1-weighted MRI, with a maximum error of 6 mm when using methods based on the correlation of intensity value between PET and MRI voxels (24). Note that the latter evaluation also included poorer registrations, whereas we limited the introduced misregistration to a maximum of 5.9 mm (6-pixel shift), because this could be detected unequivocally on simultaneous displays of PET and coregistered segmented MRI (Fig. 1C).
The improved accuracy of mMG-PVEc compared with MG-PVEc derived from the significantly more accurate measure of WM value, because an error in this estimate will propagate linearly into GM correction (previous estimates of this effect report about 20% of the WM estimate error reflected in the GM estimate error) (11).
Unlike Rousset et al. (17), we found significantly better GMR using R-PVEc than mMG-PVEc, although the mean difference in accuracy between these 2 techniques was a mere 1.5% over the large number of simulations that we ran. Our results cannot be directly compared with those reported by Rousset et al., whose experimental conditions were different from ours, including a smaller ROI set and an extremely different tracer distribution (simulated 18F-DOPA studies were used as test objects).
Although our results demonstrated an excellent recovery of true GM and WM values, especially with R-PVEc and mMG-PVEc, coupled with an increase in data noise smaller than the variability introduced by PVE, 3 shortcomings of our simulation study should be considered.
First, all 4 tested PVEc methods make the implicit assumption that ROIs encompass structures that are homogeneous with regard to tracer distribution. Although in glucose metabolism studies this is a reasonable assumption for WM, and a negligible effect of WM heterogeneities on tested PVEc techniques was found by others, this may not be the case for GM structures, especially when large ROIs are used (18). Because a suitable size for the ROIs is desirable to limit noise amplification, care should be taken to design the ROI set so that each ROI encompasses structures with metabolism or CBF that is as homogeneous as possible.
Furthermore, heterogeneity resulting from the presence of focal lesions was not tested here, because there is currently no suitable segmentation method (i.e., there is no standardized method for separately segmenting pathologic tissues such as viable tumor, necrotic tissue, edema, or gliosis), which would be a prerequisite for performing a meaningful PVEc. It should be kept in mind, then, that the type of analysis presented here cannot be used in the presence of focal pathology, unless a suitable segmentation tool is available.
The ROI module used here allows, in principle, the designing of customized ROI sets by modifying the a priori assignment of the 1,056 Talairach small boxes. Moreover, given the modular structure of the software it is also feasible to use more sophisticated external ROI definition procedures as long as they provide a map of labeled GM voxels.
The second potential shortcoming of this work was that inter-ROI heterogeneity was not simulated. Instead, PET simulation in the validation process was performed starting from a homogeneous GM activity throughout the brain regions.
Accurate estimates of 18F-FDG heterogeneity across GM are not currently available, although partially PVE-corrected 18F-FDG PET results (corrected using M-PVEc and thus still significantly affected by PVE) have been reported for major supratentorial cortical GM structures, showing <15% CV, a degree of inter-ROI heterogeneity that would have only minor effects on the accuracy and precision of the PVE-correction techniques tested here (27).
Finally, extracerebral activity (e.g., extraocular muscles) was not considered in our simulations. Currently, unless these structures can be separately segmented and demonstrated to be homogeneous with regard to tracer uptake, spill-in from them cannot be handled within standard PVEc procedures. When applying these PVE-correction methods, careful inspection of the studies is thus recommended to ensure that these effects do not introduce bias in the results.
CONCLUSION
We have presented an integrated approach to brain PET analysis that takes full advantage of currently available techniques for a posteriori multimodality image registration. automatically providing tracer concentration values for a set of predefined ROIs corrected for PVE according to 4 PVE-correction schemes.
Application of the PVEc methods on simulated 18F-FDG PET studies, over a wide range of registration, segmentation, and resolution estimate errors, reduced the underestimation of the GM ROI values from −39.6% (ROI drawn on the registered MRI and applied to the PET; no PVEc) to −2.3% (applying R-PVEc) and further reduced it to −0.9% when more restrictive experimental conditions were simulated.
Comparison of the accuracy of the corrections demonstrated a greater accuracy of the ROI-based approach (R-PVEc). When voxel-based PVE-corrected images were desired, the mMG method appeared the most adequate, showing an accuracy only 1.5% lower.
This procedure, here validated on 4 simulated 18F-FDG PET datasets, provides a framework for the analysis of other nuclear medicine tomographic studies in which distributed GM tracer uptake is present (e.g., rCBF or benzodiazepine receptor PET and SPECT).
Further work is also needed to extend this validation to the analysis of simulated PET studies with different tracer distribution patterns, such as dopamine receptor studies.
Acknowledgments
This work was performed with PVEOut, a European Community–cofinanced research and technical development project (5th Framework Programme, contract QLG3-CT2000-594). Support by the Italian Ministry of Health (Progetto Alzheimer, Attività di ricerca finalizzata D.Lgs. 502/92 e D.Lgs. 229/99) is also gratefully acknowledged.
Footnotes
Received Aug. 5, 2003; revision accepted Oct. 23, 2003.
For correspondence or reprints contact: Mario Quarantelli, MD, Istituto di Biostrutture e Bioimmagini, Consiglio Nazionale delle Ricerche, Edificio 10, Via Pansini, 5, 80131 Napoli.
E-mail: quarante{at}unina.it
REFERENCES
In this issue


Jump to section
Related Articles
Cited By...
- StepBrain: A 3-Dimensionally Printed Multicompartmental Anthropomorphic Brain Phantom to Simulate PET Activity Distributions
- Reshaping the Amyloid Buildup Curve in Alzheimer Disease? Partial-Volume Effect Correction of Longitudinal Amyloid PET Data
- Dedifferentiation of caudate functional connectivity and striatal dopamine transporter density predict memory change in normal aging
- Partial-Volume Effect Correction Improves Quantitative Analysis of 18F-Florbetaben {beta}-Amyloid PET Scans
- Changes in Cerebral CB1 Receptor Availability after Acute and Chronic Alcohol Abuse and Monitored Abstinence
- MR Imaging-Based Correction for Partial Volume Effect Improves Detectability of Intractable Epileptogenic Foci on Iodine 123 Iomazenil Brain SPECT Images: An Extended Study with a Larger Sample Size
- Age-Related Metabolic Profiles in Cognitively Healthy Elders: Results from a Voxel-Based [18F]Fluorodeoxyglucose-Positron-Emission Tomography Study with Partial Volume Effects Correction
- {beta}-Amyloid burden in the temporal neocortex is related to hippocampal atrophy in elderly subjects without dementia
- Kinetic Modeling of 11C-SB207145 Binding to 5-HT4 Receptors in the Human Brain In Vivo
- Cerebral glucose metabolism in Fisher syndrome
- Relationships between Hippocampal Atrophy, White Matter Disruption, and Gray Matter Hypometabolism in Alzheimer's Disease
- Evaluation of the Serotonin Transporter Ligand 123I-ADAM for SPECT Studies on Humans
- Simultaneous 3-Dimensional Resolution Correction in SPECT Reconstruction with an Ordered-Subsets Expectation Maximization Algorithm
- Characterization of Normal and Infarcted Rat Myocardium Using a Combination of Small-Animal PET and Clinical MRI
- Brain White-Matter Volume Loss and Glucose Hypometabolism Precede the Clinical Symptoms of Huntington's Disease