


Abstract
The serotonin 4 receptor (5-HT4 receptor) is known to be involved in learning and memory. We evaluated for the first time the quantification of a novel 5-HT4 receptor radioligand, 11C-SB207145, for in vivo brain imaging with PET in humans. Methods: For evaluation of reproducibility, 6 subjects were scanned twice with 11C-SB207145 on the same day. A further 2 subjects were scanned before and after blocking with the selective 5-HT4 receptor inverse agonist piboserod (SB207266). Arterial blood samples were drawn for the calculation of metabolite-corrected arterial input functions. Regions of interest were delineated automatically on the individual's MR images coregistered to the PET images, and regional time–activity curves were extracted. Quantitative tracer kinetic modeling was investigated with 1- and 2-tissue-compartment models using plasma input functions and the simplified reference tissue model (SRTM). Results: 11C-SB207145 readily entered the brain and showed a distribution consistent with the known localization of the 5-HT4 receptor. Using plasma input models, the time–activity data were well described by the 2-tissue-compartment model in all regions and allowed for the estimate of binding potentials relative to the reference region (BPND: striatum, 3.38 ± 0.72; hippocampus, 0.82 ± 0.19; parietal cortex, 0.30 ± 0.08). Quantification with the 1-tissue-compartment model, 2-tissue-compartment model, and SRTM were associated with good test–retest reproducibility and time stability. However, the SRTM-generated BPND values in the striatum were underestimated by 20%−43% in comparison to the 2-tissue-compartment model. The blocking study with piboserod confirmed that the radioligand was selective for the 5-HT4 receptor, that the cerebellum was a suitable reference region devoid of specific binding, and that nonspecific binding was constant across brain regions. Conclusion: In vivo imaging of cerebral 5-HT4 receptors can be determined reliably using 11C-207145 PET with arterial input in humans. SRTM showed high reproducibility and reliability but bias in the striatum, and therefore, the use of SRTM should be considered carefully for individual applications.
The serotonin 4 receptor (5-HT4 receptor) is a G-protein–coupled serotonin receptor with its highest cerebral density in the basal ganglia and medium density in the hippocampus (1). Animal studies have found 5-HT4 partial agonists to have procognitive and memory-enhancing effects (2–4), possibly mediated by a modulation of other neurotransmitter systems (5) such as the dopaminergic (6), GABAergic (7), and acetylcholinergic systems. Thus, 5-HT4 agonists are shown to facilitate at least in part the release of the neurotransmitter acetylcholine in the frontal cortex (8) and hippocampus (2). Moreover, 5-HT4 receptor stimulation in a transgenic mouse model (9) increases cerebral levels of the soluble amyloid precursor protein that is believed to be neuroprotective and enhance memory consolidation (10).
Recently, a new radioligand, 11C-SB207145, was introduced for PET imaging of the 5-HT4 receptor and was shown in pigs to enter the brain readily and distribute consistently with the known 5-HT4 densities (striatum > thalamus > cortical regions > cerebellum) (11). In the minipig, 11C-SB207145 time–activity curves are described equally well by 1-tissue-compartment and 2-tissue-compartment kinetics, and in all brain regions the simplified reference tissue model (SRTM) with fixed k2′ provides stable and precise binding-potential estimates that correlate strongly with in vitro binding, as measured in the same pigs' brains (12). Preliminary data on 6 human subjects showed the same rank order of binding and slower tissue kinetics, compared with the in vivo pig data (11). The radiotracer metabolism was, however, not reliably assessed in this initial study on humans because continuing metabolism of tracer in plasma samples limited the quantification.
This study provides the first comprehensive quantification of the binding of 11C-SB207145 to cerebral 5-HT4 receptors in the human brain in vivo. Tracer quantification was investigated with 1- and 2-tissue-compartment models and SRTM on test–retest and blocking datasets. The outcome measures of interest were the binding potential relative to the reference region (BPND) and relative to plasma (BPP) and the total distribution volume (VT). The models were assessed in terms of their goodness of fit, reproducibility, and reliability on test–retest data and parameter estimation stability over different scan durations.
MATERIALS AND METHODS
Test–Retest Study
Six healthy subjects were included in the test–retest part of the study (age range, 21–44 y; 3 men and 3 women), which was performed at Copenhagen University Hospital, Rigshospitalet, Copenhagen, Denmark. The subjects were recruited by newspaper advertisements, and the study was approved by the Ethics Committee for Copenhagen and Frederiksberg ([KF]01-274821). Exclusion criteria included pregnancy, a history of or present neurologic or psychiatric disease, abuse of alcohol or drugs (including sedatives), head trauma, a family history of mental illness in first-degree relatives, use of a drug within the last 3 mo known to act on the serotonergic/noradrenergic system, and signs suggesting a neurologic disorder. 11C-SB207145 was synthesized through a modification of a method described earlier (11) using a fully automated radiosynthesis system (13). Briefly, 11C-methyl iodide, made from in-target–produced 11C-methane using a gas-phase methylation system, was reacted with the labeling precursor SB206453A in the presence of base. After preparative high-performance liquid chromatography (HPLC) and formulation, 2–4 GBq of 11C-SB207145 were produced.
Subjects received a 20-s bolus injection of 11C-SB207145 (mean, 572 MBq; range, 512–601 MBq) with good specific radioactivity (mean, 48.4 GBq/μmol; range, 34.2–71.0 GBq/μmol) and radiochemical purity (>99%) (Table 1). A 2-h dynamic emission scan (6 × 5 s, 10 × 15 s, 4 × 30 s, 5 × 2 min, 5 × 5 min, and 8 × 10 min) was acquired on an 18-ring Advance scanner (GE Healthcare) operating in 3-dimensional acquisition mode with an approximate in-plane resolution of 6 mm. The frames were reconstructed using filtered backprojection (6-mm Hann filter and 8.5-mm axial ramp filter) into a sequence of 128 × 128 × 35 voxels (2.0 × 2.0 × 4.25 mm) and corrected for randoms, dead time, scatter, and attenuation (14).
Subject Information for the Test–Retest and Blocking Parts of the Study
Esterase Inhibition in Plasma
An earlier study had described a continuing metabolism of 11C-SB207145 ex vivo in plasma samples (11). Initial experiments on the effect of immediate cooling of arterial samples on ice were performed. 11C-SB207145 was added to whole blood stored at 37°C. The samples were immediately cooled on ice for 7 min, centrifuged at 4°C for 8 min, and placed on ice until analyzed by HPLC. Adding ascorbic acid to the samples resulted in a redistribution of radioactivity from red blood cells into plasma and was given up. 11C-SB207145 is an ester, and we investigated the stability of 11C-SB207145 in human plasma by spiking plasma samples with the tracer in the presence of dichlorvos, a pesticide that is known to inhibit plasma esterases. Samples were incubated at 37°C or 22°C; withdrawn after 20, 40, or 60 min; and placed on ice until analyzed by HPLC.
Input Function Measurement
Arterial blood samples for measurement of the radioactivity concentration were drawn at 5- to 10-s intervals during the first 2 min and subsequently at the mid-frame times. In addition, 7 samples (3.5, 10, 17.5, 32.5, 55, 85, and 115 min) were acquired for metabolite measurements. After withdrawal, the blood samples were immediately heparinized, and dichlorvos (1 μg/mL blood) was added to avoid further decomposition of the radiotracer. Because dichlorvos is slowly hydrolyzed in aqueous solution, a concentrated solution in acetonitrile (20 mg/mL stored at −20°C) was diluted 100-fold with water on the morning of the study. Heparinized blood tubes were spiked with the diluted solution to give a dichlorvos concentration of 1 μL/mL of blood. Whole-blood and plasma radioactivity concentration was measured in a well counter (COBRA 5003; Packard Instruments).
The fraction of unmetabolized tracer in arterial plasma was determined using a column-switching HPLC method (15). Briefly, plasma samples (4 mL) were passed through a 0.45-μm filter and injected into a small capture column eluted with 2% 2-propanol in phosphate buffer (pH 10) at a flow rate of 5 mL/min followed by online measurement of the polar fraction (Packard flow scintillation analyzer). The capture column was then back-flushed with 50% aqueous acetonitrile to elute the trapped parent compound, which was measured online and integrated using Chromeleon software (Dionex). For late plasma samples, HPLC fractions were collected and measured in a well counter.
Protein Binding Measurements
The degree of protein binding was estimated by measurement of the free fraction, fP, of 11C-SB207145 using equilibrium dialysis, because preliminary experiments suggested that the tracer was too sticky for ultrafiltration. First, the necessary length of incubation was assessed in a temporal study (n = 2). Five hundred microliters of plasma with 0.5 mg of dichlorvos and about 500 kBq of 11C-SB207145 were dialyzed against 500 μL of buffer, with a semipermeable cellulose membrane retaining proteins larger than 10 kDa in Teflon (DuPont)-coated dialysis chambers (AmiKa; Harvard Bioscience), at 37°C for 20, 40, 60, 80, 100, 120, 140, 160, or 180 min. After incubation, 400 μL of both plasma and buffer were measured in a well counter and the free fraction was determined as fp = Cbuffer/CP = free/(free + protein-bound), Cbuffer being the radioactivity concentration in buffer, CP in plasma (12). For the 4 remaining test–retest subjects, the fP was measured in triplicate solely from data acquired after an incubation of 140 min.
MRI
Structural MRI was conducted on a 3-T Trio scanner (Siemens). A high-resolution 3-dimensional T1-weighted sagittal magnetization-prepared rapid gradient-echo scan of the whole head was acquired for each subject. Scans were corrected for gradient nonlinearity distortions (16).
Blocking Study
Two healthy male subjects (aged 37 and 29 y) were included in the blocking part of the study, which was performed at the Vivian M. Rakoff PET Centre, Centre for Addiction and Mental Health, Toronto, Canada. 11C-SB207145 PET scans were acquired before and after administration of the selective 5-HT4 inverse agonist, piboserod (SB207266) (17). This part of the study was approved by the Research Ethics Board for Human Subjects at the Centre for Addiction and Mental Health, Toronto, Canada, and the same exclusion criteria as for the test–retest study were applied. Subjects underwent a baseline PET scan followed by a second scan approximately 4 h after receiving an oral dose of 150 mg of piboserod (SB207266). The methods for synthesis, scanning, and input function measurements were similar to those of the test–retest study: 11C-methylation of SB206453 (hydrochloride salt) with 11C-iodomethane was performed inside an HPLC sample loop using a previously described loop method (18). After purification and formulation, 11C-SB207145 was obtained in 20%−25% radiochemical yield (uncorrected for decay, from 11C-CO2) at 25 min after the end of bombardment.
The subjects were given an injection of 11C-SB207145 (mean, 359 MBq; range, 329–389 MBq) with a good specific activity (mean, 26 GBq/μmol; range, 20–32 GBq/μmol) and high radiochemical purity (>95%) (Table 1). The PET scans were obtained using a Biograph HiRez XVI PET tomograph (Siemens Molecular Imaging), and the 2-h dynamic emission scans (30-s background, 8 × 15 s, 3 × 60 s, 5 × 2 min, 5 × 5 min, and 8 × 10 min) were acquired in 32-bit list mode. The images were reconstructed using filtered backprojection (5-mm gaussian filter and a ramp filter at Nyquist cutoff frequency).
Input Function Measurement
Blood sampling was done during the first 15 min using an online automatic sampler (PBS-101 Programmable Blood Sampler; Veenstra Instruments) and thereafter manually at mid-frame times. HPLC analysis of plasma samples (2.5, 4, 7, 10, 15, 30, 45, 60, and 75 min) was performed through minor modifications of the method of Hilton (19) using a small capture column (4.6 × 20 mm) packed in-house with Oasis HLB, 30 μm (Waters); back-flushed with 25% acetonitrile, 75% H2O, and 0.1N ammonium formate, pH 4; and measured with a 10-μm Luna C18 column (250 × 4.6 mm; Phenomenex). Column effluents were monitored through a flow detector (Flow-Count; Bioscan) operated in coincidence mode.
MRI
MRI was performed using a Signa Excite HD 1.5-T scanner (GE Healthcare). Axial 3-dimensional volumetric T1-weighted images were acquired using a fast spoiled gradient-recalled sequence.
Image Processing
Scans from all 8 subjects were processed the same way. The temporal frames of the PET emission scans were aligned to correct for motion artifacts (20) and a frame (15–20 min) with flowlike tracer distribution was aligned to the MR images using a program with manual translation and rotation (in-house software). The MR images were segmented into gray matter and white matter by means of Statistical Parametric Mapping (SPM2; Wellcome Department of Cognitive Neurology). A total of 19 regions in both hemispheres were automatically delineated (21) on each subject's MR images in a user-independent fashion with the Pvelab software package (www.nru.dk/downloads/software) (22). Striatum was constructed as a volume-weighted average of the caudate nuclei and the putamen. The regions of interest were applied to the PET data, and decay-corrected time–activity curves were derived. The superior frontal and parietal cortices, hippocampus, and striatum were chosen as regions of interest to reflect low-, moderate-, and high-binding regions.
Plasma Input Function
We compared several models for fitting the fraction of measured parent compound as a function of time. For test–retest subject 5, metabolite measurements were available only for the first 30 min for the test scan, and the first measurement for the retest scan was missing. Because no systematic differences in the metabolite profiles were evident for the available data between test and retest, a common parent fraction derived from the pooled data was used for subject 5. For blocking subject 2, the 75-min metabolite points failed and the 60-min points were excluded as they were deemed outliers.
The 2 most optimal models based on visual inspection of the fit were the Hill function (23) and a biexponential function with the slowest exponential constrained to the difference in washout in plasma and the reference region (cerebellum) (24). The parent arterial plasma input function was calculated as the total measured plasma activity multiplied by the fitted parent fraction and constrained to be equal to a sum of exponentials after the peak.
Kinetic Modeling
Three kinetic models were investigated using the test–retest data (1- and 2-tissue-compartment models and SRTM). We estimated 2 different binding potentials (BPND = VT/VND – 1 and BPP = VT − VND, VT and VND being the distribution volumes in the target and in the reference regions, respectively) (25) using the 1- and 2-tissue-compartment models with blood volume fixed at 0.05 mL/cm3. As a noninvasive reference tissue method, we explored SRTM (26) to derive estimates of BPND. All modeling was performed using in-house software at GlaxoSmithKline implemented within Matlab (version 7.5; The MathWorks); the plasma input models used a Levenberg–Marquardt optimizer, and SRTM used a basis function implementation (27). The outcome parameters from the right and left hemispheres were averaged, and the different models were compared using the Akaike information criteria, test–retest reproducibility and reliability, and time stability.
A time stability analysis was performed to determine the minimal scanning duration for reliable estimation of the outcome measures of interest. The distribution volume (VT) or BPND was calculated for a range of truncated datasets using the 1- and 2-tissue-compartment models and SRTM. Estimation was performed on datasets corresponding to durations of 120, 110, 100, 90, 80, 70, 60, and 50 min. The hippocampus and striatum were used for the analysis as they were deemed representative of moderate- and high-binding regions, respectively. The outcome parameters were normalized to the value obtained from the full 120-min scan analysis, and the mean and SD for all test–retest scans were plotted as a function of the scan length.
A significance level of 0.05 was adopted throughout. The Akaike information criteria were used to assess the goodness of fit with a penalty for increasing the number of parameters in the model. For the descriptive analysis of the test–retest data, a relative test–retest difference was calculated per region as
The mean of Δ% across subjects is a measure of systematic differences (bias), and the SD of Δ% is referred to as the average test–retest difference and characterizes the reproducibility (28).
Reliability was assessed using the intraclass correlation coefficient (ICC), determined as:
MSSBetween is the mean sum of squares between subjects, and MSSWithin is the mean sum of squares within subjects. An ICC score of −1 denotes no reliability, and +1 denotes maximum reliability.
Simulations of Cerebral Blood-Flow Changes
To assess the potential impact of cerebral blood-flow alterations on the outcome parameters, VT or BPND, flow changes were simulated by taking the population average from the test–retest data for K1, k2, k3, k4, and the parent plasma input function to construct noise-free population time–activity curves for cerebellum, striatum, and hippocampus. To simulate stationary changes in blood flow lasting for the entire scan, we multiplied K1 and k2 by 1.15 or 0.85 in cerebellum, striatum, and hippocampus and constructed new time–activity curves based on the common input function. The relation between change in K1 and k2 and change in blood flow, F, can be estimated using the Renkin–Crone model: K1 = F × (1 − e−PS/F) and k2 = F × (1 − e−PS/F)/VND. If baseline F is assumed to be 0.5 mL cm−3 min−1 and baseline K1 is 0.23 mL cm−3 min−1, then PS, the permeability surface area product, is 0.31 mL cm−3 min−1. Thus, a 15% increase in K1 is equivalent to an 80% increase in blood flow and a 15% decrease in K1 is equivalent to a 40% reduction in blood flow. Gaussian noise was added on the basis of the residuals of the associated 2-tissue-compartment modeling of the measured data. Kinetic modeling of the resulting noisy time–activity curves was performed with the 2-tissue-compartment model and SRTM to investigate whether there was any bias in the estimation of BPND values in the striatum and hippocampus.
RESULTS
The initial experiments showed significant metabolism of 11C-SB207145 when the radiotracer was added directly to whole blood and immediately cooled on ice for 7 min (79% parent compound remaining). At 37°C and 22°C, 11C-SB207145 was rapidly degraded in human plasma (Fig. 1). The addition of as little as 0.25 μg of dichlorvos per milliliter of plasma fully inhibited any further radiotracer degradation, even at 37°C (Fig. 1). The metabolism of 11C-SB207145 in vivo was even faster and was fairly constant across subjects, with the coefficients of variation (CV = SD/mean × 100%) increasing from around 11% for the early HPLC samples to around 24% for the late samples (>45 min). The constrained biexponential and Hill metabolite models were reasonably good descriptors of the parent fraction, with the Hill function typically yielding a slightly better goodness of fit. However, because the Hill function–derived input function led to infinite distribution volume estimates for some scans, the constrained biexponential model was used for all scans (Fig. 2).
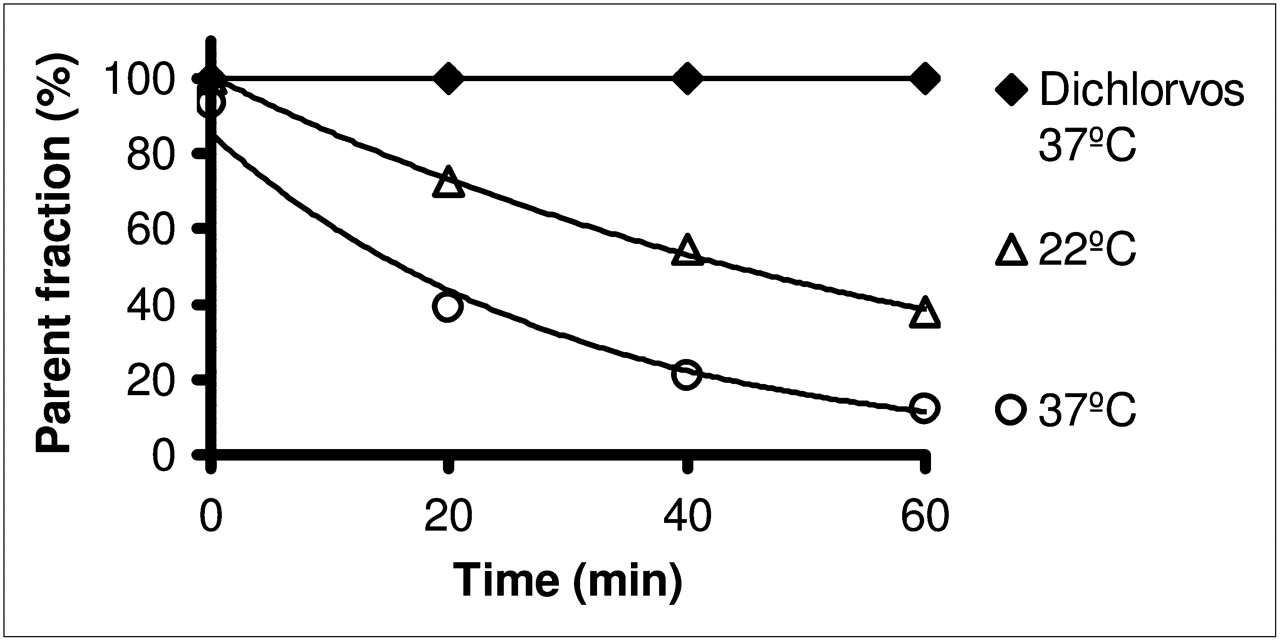
Time-dependent metabolism of 11C-SB207145 in plasma at 22°C and 37°C. Metabolism is prevented when dichlorvos is added. Exponential fits correspond to half-lives of 18 min at 22°C and 44 min at 37°C.

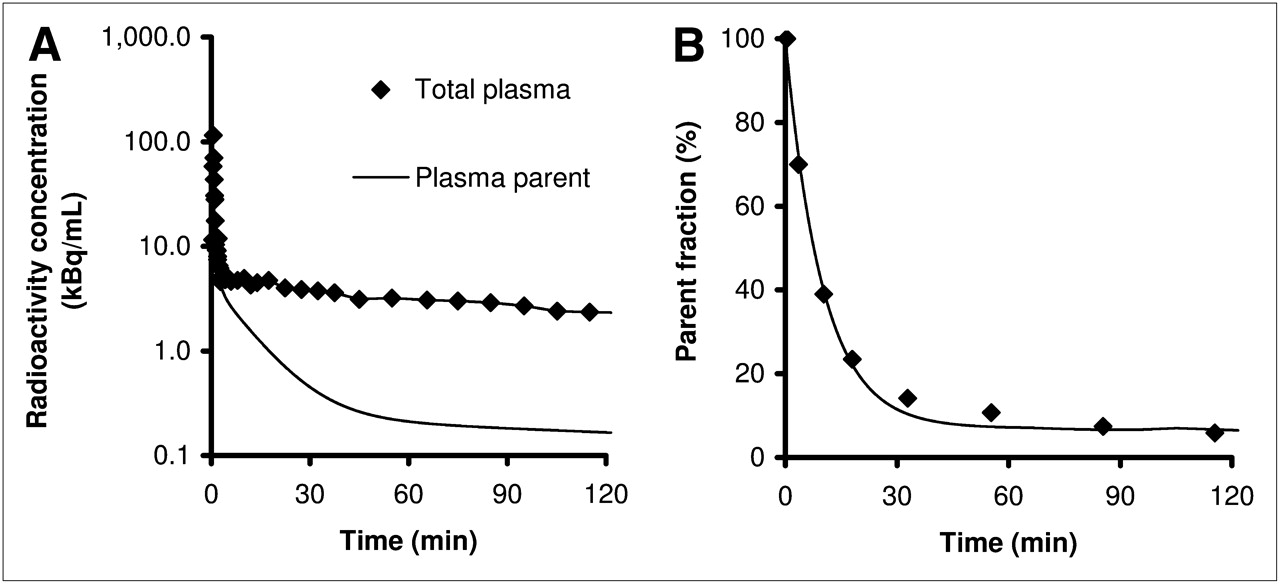
(A) Total radioactivity concentration in plasma and metabolite-corrected plasma radioactivity from 36-y-old 69-kg woman after injection of 512 MBq of 11C-SB207145. (B) Metabolite measurements of representative subject. Fit is constrained biexponential function (25).
Equilibrium dialysis was able to estimate the stable free fraction by 140 min. The average free fraction of unbound tracer in plasma, fP, was 0.25 (range, 0.08–0.43) (n = 7; we failed to obtain measurements in subject 3 and retest measurements in subjects 1, 2, and 5). The fP correction was not applied to BPP in order to derive BPF, binding potential relative to free plasma concentration, because we found no correlation between fP and BPP in hippocampus (r = −0.41, P = 0.36) and a strong negative correlation between fP and BPF (r = −0.87, P = 0.01). No correlation was observed between fP and VND, age, sex, time of the day, or amount of injected cold tracer.
An example of the 11C-SB207145 tissue time–activity curves from a representative subject is shown in Figure 3. Slower kinetics were observed in the highest-binding striatal region, which displayed a later peak and slower washout than all other regions.
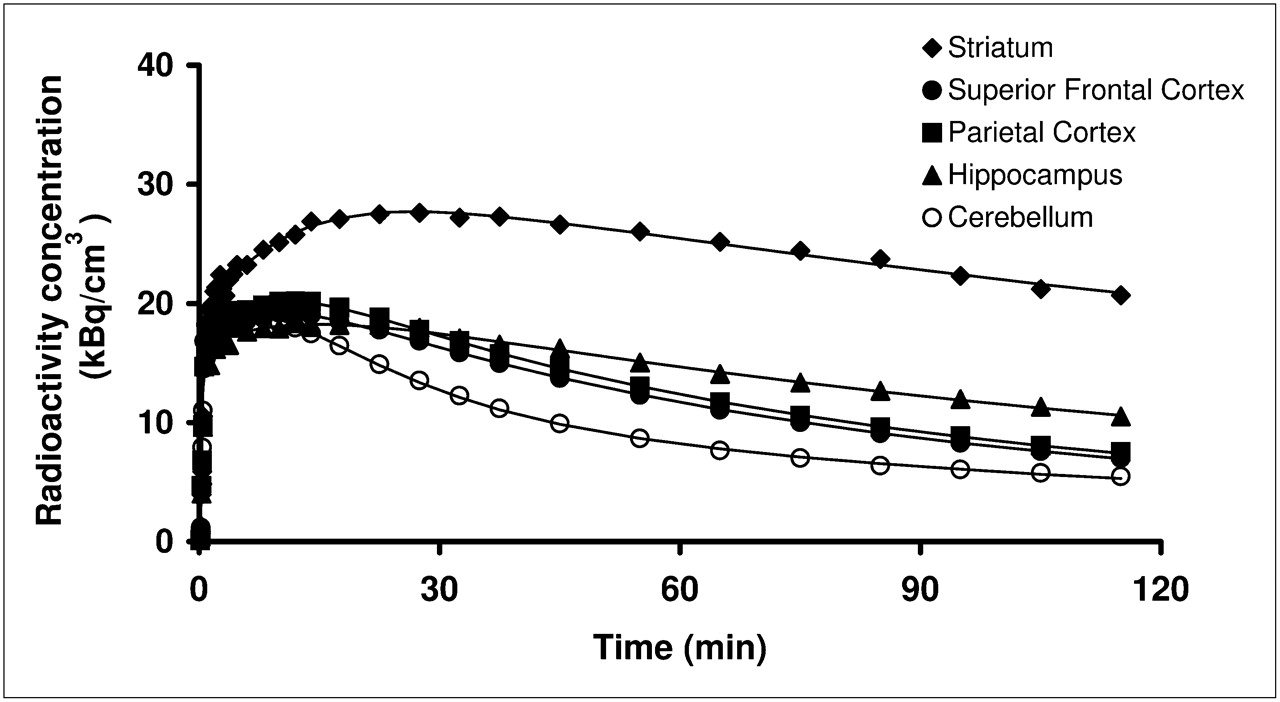
Regional time–activity curves after injection of 512 MBq of 11C-SB207145. Striatum shows highest and latest peak and slowest washout because of high density of receptors, whereas superior frontal and parietal cortices show faster washout. Cerebellum devoid of specific binding has fastest washout. Fits with 2-tissue-compartment modeling are shown.
The results of the kinetic modeling are shown in Table 2. The 2-tissue-compartment model was superior to the 1-tissue-compartment model, as judged by the Akaike information criteria in all regions. There were systematically higher binding potentials relative to plasma at the second scan than at the first scan for both 1- and 2-tissue-compartment modeling, that is, relative percentage test–retest differences (Table 2) were significantly different from zero (paired t test). We found no significant differences between test and retest scans with regard to the area under the curve for cerebellum normalized to injected dose (paired t test, P = 0.24), injected activity (P = 0.67), injected mass (P = 0.56), VND (P = 0.57), or parent plasma clearance (P = 0.19).
Parameter Estimation
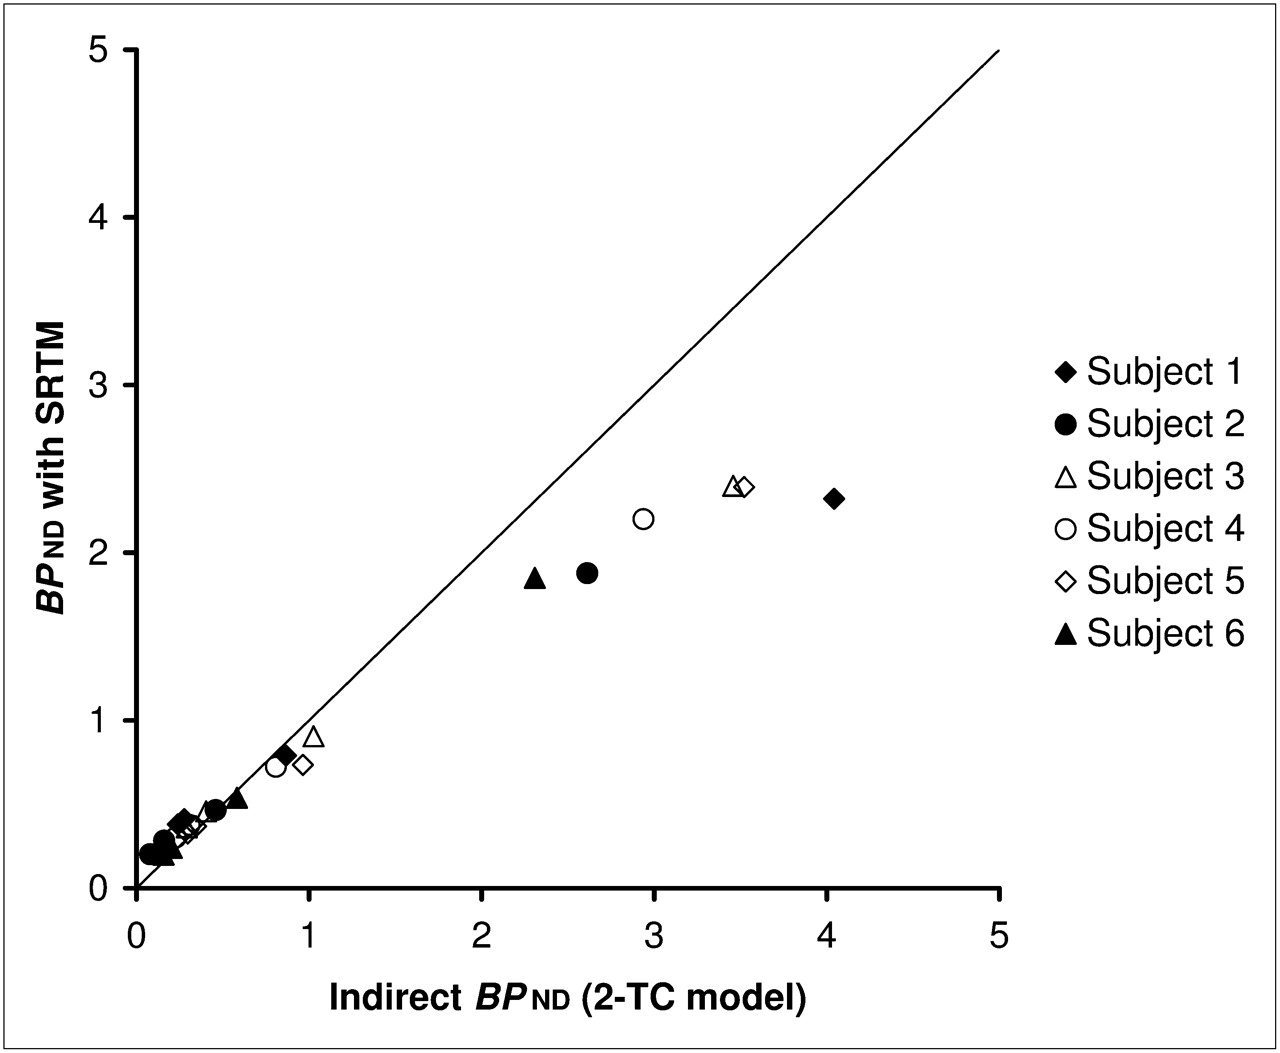
We observed a slight overestimation of BPND in the cortical regions and an underestimation (of 20%−43%) in the striatum when using SRTM, as compared with 2-tissue-compartment modeling (Fig. 4). Applying SRTM by fixing k2′ did not change the results significantly (29), and an irreversible model did not improve the fits.

BPND estimated with SRTM, compared with BPND determined indirectly from VT (2-tissue-compartment model [2-TC] with arterial input) using test scans of test–retest dataset. Graph shows that bias is introduced in areas of high binding with SRTM (on average, 30%; range, 20%−43%). Solid line is line of identity.
The time-stability analyses revealed no major bias or variance after 100 min in either the hippocampus or the striatum with any of the models (Fig. 5). For SRTM, a slight bias was present with a scan length of 100 min in hippocampus.

Time stability using 2-tissue-compartment model (2-TC) (A and C) and SRTM (B and D) for striatum (A and B) and for hippocampus (C and D) for test and retest scans. Error bars represent 1 SD.
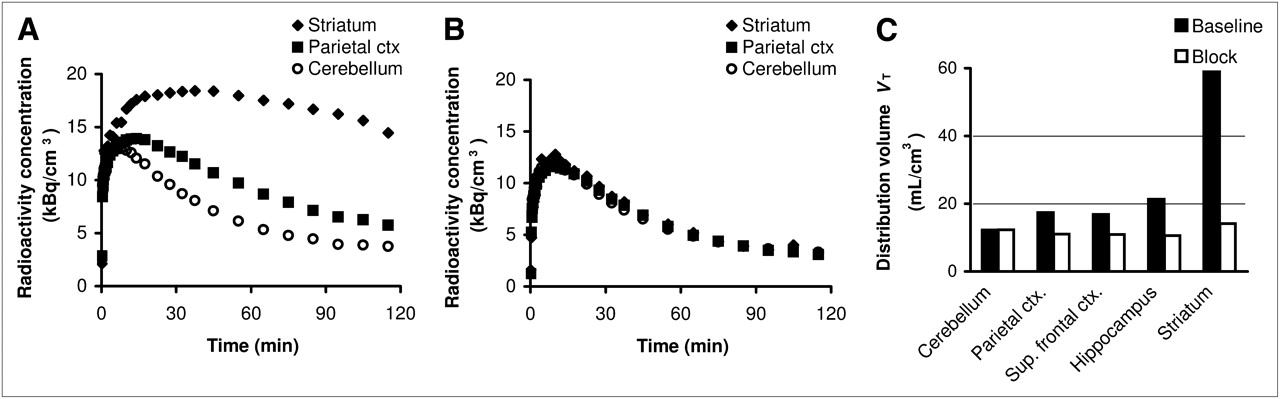
Blocking by piboserod (SB207266) reduced time–activity curves and resultant binding outcome measures in all regions studied to the level of the cerebellum, and cerebellar distribution volumes were not changed (Figs. 6 and 7). We compared the VT and BPND from the blocking part and test–retest part (Table 3) for differences across sites and found slightly higher values in cortical regions and striatum favoring the blocking part.

Baseline (A) and blocked (B) 11C-SB207145 scan of 29-y-old man before and after oral administration of piboserod (SB207266). Mean images from 30 to 120 min after injection are normalized to injected dose (ID) to obtain normalized uptake value. Chosen orthogonal sections pass through striatum.

Time–activity curves for baseline (A) and blocked (B) scans of 29-y-old man. After 150-mg oral administration of structurally dissimilar compound piboserod (SB207266), 11C-SB207145 distribution volumes (C) are reduced to level of cerebellum at baseline (n = 2). Ctx = cortex; sup = superior.
Comparison of VT and BPND Between Centers
Extremely large simulated blood-flow changes did not induce changes in BPND when 2-tissue-compartment modeling with arterial input was used, and no changes in BPND above 4% were observed with simulated global or local blood-flow changes. Even for SRTM, extremely large blood-flow changes induced only a small bias in BPND, with a +6.6% bias for an 80% increase in blood flow and a −8.6% bias for a 40% reduction in blood flow. If the changes in blood flow in the reference and target regions were the same, an even smaller bias was observed.
DISCUSSION
As described previously (11), 11C-SB207145 readily crosses the blood–brain barrier in humans and yields a heterogeneous distribution consistent with the known 5-HT4 receptor localization. The kinetics of the radioligand are reversible and well described by a 2-tissue-compartment plasma input model. In addition, SRTM with cerebellum input was able to successfully quantify binding of the radiotracer, although with a bias of 20%−43% in the slowest kinetic regions of the striatum. The bias is most likely a result of violations of SRTM assumptions that require 1-tissue kinetics in the cerebellum (30), although noisy measurements at late time points of the input function can lead to BPND values that are too high with the 2-tissue-compartment model in high-binding regions. SRTM yielded low test–retest differences (6%−10% in moderate- to high-binding regions and 12%−14% in low-binding regions), high reliability (ICC, 0.76–0.88), and good time stability. The low-binding cortical regions have small binding potentials in the range of 0.3–0.4; however, the observed reproducibility and reliability support the use of cortical binding potentials in future clinical studies.
The lack of major differences found between the blocking experiment and the test–retest experiment (Table 3) supports the use of 11C-SB207145 across sites. The slightly higher values in the blocking experiment are most likely due to a higher resolution of the tomograph in Toronto.
Time Stability
The time stability analysis allows for an assessment of the stability of the model and selection of the optimal scan duration. For acquisitions of 100 min or longer, all 3 models yielded relatively stable outcome parameters in terms of bias and variance, although a slight bias was present at 100 min for hippocampus when SRTM was used. Thus, 100 min of dynamic data are suitable for quantitative assessment of 5-HT4 receptors when arterial input is used; however, 120 min are recommended when SRTM is to be used.
Blocking
After blocking with a structurally dissimilar selective 5-HT4 inverse agonist (piboserod), the distribution volumes in all regions were reduced to the level of the cerebellum in the baseline scan, with the cerebellum remaining unchanged. These data support the use of the cerebellum as a reference region and the assumption of homogeneous nonspecific binding. In addition, they confirm the selectivity of the specific signal for the 5-HT4 receptor.
Metabolite Measurements
We chose to use a constrained biexponential model for the parent fraction in plasma although the goodness of fit was marginally improved with the Hill function and the measured rate of metabolism was slightly underestimated. Use of the Hill function–derived input had led to problems in estimating finite VT in the cerebellum for several scans. These estimation problems could be due to an accumulation of radioactive metabolites in the brain, but previous rat experiments have revealed that at 180 min after injection, the major radioactive component in rat brain is SB207145 (11). A more likely explanation is a bias in the late metabolite measurements, which suffer from high noise and potential bias, because of subtraction of background radioactivity. Applying the constrained biexponential parent fraction model significantly increased the robustness of the outcome measures and is acceptable, as a secular equilibrium should be reached between the cerebellum and the parent plasma concentration late in the scan.
Cerebral Blood-Flow Simulations
Even for extreme changes in blood flow (+80% or −40%), little bias was introduced in the parameter estimation. For 2-tissue-compartment modeling, the changes were less than 4%. For SRTM modeling, the bias was slightly higher but still less than 9% and was even less for global cerebral blood-flow changes. Thus, local blood-flow changes, as seen in, for example, Alzheimer disease, with stable cerebellar perfusion might lead to a small bias.
CONCLUSION
11C-SB207145 can be used for quantitative PET measurements of 5-HT4 receptors in the human brain. The distribution volumes and binding potentials can be reliably estimated using 2-tissue-compartment modeling with arterial input measurements. Use of SRTM to avoid invasive arterial cannulation gives high reproducibility and reliability at scan times of 120 min but bias with lower values in high-binding regions. Thus, the use of SRTM should be considered for individual applications.
Acknowledgments
Karin Stahr, Bente Høy, Anita Dole, and Kirsten Honsyld are thanked for invaluable technical assistance, and Niels Vidiendal Olsen is acknowledged for his help with arterial cannulation. We are grateful for the support by The Lundbeck Foundation, Rigshospitalet, and the Danish Medical Research Council. The John and Birthe Meyer Foundation is gratefully acknowledged for the donation of the cyclotron and PET scanner. Robert A. Comley, Marc Laruelle, Eugenii A. Rabiner, and Roger N. Gunn are GlaxoSmithKline employees and report owning shares in GlaxoSmithKline but declare that they have no financial interest in or financial conflict with the subject matter or materials discussed in this article.
Footnotes
-
COPYRIGHT © 2009 by the Society of Nuclear Medicine, Inc.
References
- Received for publication September 29, 2008.
- Accepted for publication March 30, 2009.


Jump to section
Related Articles
Cited By...
- Evidence for a serotonergic subtype of major depressive disorder: A NeuroPharm-1 study
- International Union of Basic and Clinical Pharmacology. CX. Classification of Receptors for 5-hydroxytryptamine; Pharmacology and Function
- In Vivo Evaluation of 18F-MNI698: An 18F-Labeled Radiotracer for Imaging of Serotonin 4 Receptors in Brain
- The 5-Hydroxytryptamine4 Receptor Agonists Prucalopride and PRX-03140 Increase Acetylcholine and Histamine Levels in the Rat Prefrontal Cortex and the Power of Stimulated Hippocampal {theta} Oscillations