


Abstract
The NU 2-1994 standard document for PET performance measurements has recently been updated. The updated document, NU 2-2001, includes revised measurements for spatial resolution, intrinsic scatter fraction, sensitivity, counting rate performance, and accuracy of count loss and randoms corrections. The revised measurements are designed to allow testing of dedicated PET systems in both 2-dimensional and 3-dimensional modes as well as coincidence gamma cameras, conditions not considered in the original NU 2-1994 standard. In addition, the updated measurements strive toward being more representative of clinical studies, in particular, whole-body imaging. Methods: Performance measurements following the NU 2-1994 and NU 2-2001 standards were performed on several different PET scanners. Differences between the procedures and resulting performance characteristics, as well as the rationale for these changes, were noted. Results: Spatial resolution is measured with a point source in all 3 directions, rather than a line source, as specified previously. For the measurements of intrinsic scatter fraction, sensitivity, and counting rate performance, a 70-cm line source is now specified, instead of a 19-cm-long cylindric phantom. The longer configuration permits measurement of these performance characteristics over the entire axial field of view of all current PET scanners and incorporates the effects of activity outside the scanner. A measurement of image quality has been added in an effort to measure overall image quality under clinically realistic conditions. This measurement replaces the individual measurements of uniformity and of the accuracy of corrections for attenuation and scatter. Conclusion: The changes from the NU 2-1994 standard to the NU 2-2001 standard strive toward establishing relevance with clinical studies. The tests in the updated standard also are, in general, simpler and less time-consuming to perform than those in the NU 2-1994 standard.
For more than 10 y a concerted effort has been made to standardize performance measurements of PET scanners. Initially, a task group from the Society of Nuclear Medicine (SNM) defined a set of measurements, which was published in 1991 (1). Shortly after this task group began its work, the National Electrical Manufacturers Association (NEMA) formed a committee with members from all of the PET manufacturers, including 2 members from the SNM task group. The SNM tests were adopted and refined by NEMA, resulting in the NU 2-1994 document of performance standards for PET scanners (2). In parallel with the SNM task group, the European Economic Community underwent a concerted action to develop measurements for PET scanners. This work resulted in the International Electrotechnical Commission (IEC) Standard (3). Although there is some overlap between the NEMA and IEC standards, many of the specific details of the measurements (i.e., phantoms, acquisition procedures, or data processing methods) are different. Therefore, one does need to make a choice between these 2 standards when testing and specifying the performance of a PET scanner. Recently, the NEMA standard has been updated (4) by a committee, comprising members from manufacturers of dedicated PET scanners and coincidence imaging systems, as well as 2 members from the original SNM task group. During the development of the standard over the past few years, input was also sought from experienced PET users and experts in PET instrumentation. Although the new NEMA NU 2-2001 standard supersedes the original NU 2-1994, it does not resolve the differences between the NEMA and IEC standards.
Since the publication of the NU 2-1994 standard, there have been several developments in PET scanner technology. The NU 2-2001 standard is an attempt to respond to this changing technology. In particular, 3-dimensional (3D) imaging has become an important acquisition and reconstruction mode, whereas the previous standard assumed only 2-dimensional (2D) imaging. It became necessary to standardize how oblique lines of response (LORs) would be handled during measurement of scanner performance in 3D mode.
In addition, all coincidence gamma cameras have a very large axial field of view (FOV), typically 30–40 cm. Yet, the standard NEMA phantom defined in NU 2-1994 is only 19-cm long, and the tests using this phantom assumed that the axial FOV of the scanner was ≤17 cm. Before 1991 all commercial PET scanners did, in fact, have an axial FOV shorter than 17 cm. Today there are also several dedicated PET systems with an axial FOV as large as 25 cm, so the NU 2-1994 tests cannot adequately accommodate these scanners or the coincidence gamma-camera systems.
An issue related to the axial FOV is that the 20 × 19 cm NEMA phantom was designed to represent a compromise between brain imaging and body imaging. In the last 10 y, whole-body 18F-FDG studies have become the predominant type of PET study performed by most centers, driven partly by the available reimbursement through Medicare and local insurance carriers. Therefore, it is more relevant than before to measure the performance of PET scanners under conditions that better represent whole-body studies. In fact, a brain is much smaller than the NEMA phantom (although the head volume is comparable to the phantom volume), whereas a body is much larger. However, because most PET systems before 1991 operated in 2D mode with septa and with an axial FOV of <17 cm, the counting rate data acquired with the NEMA phantom served as a reasonable test of the scanner performance for both conditions. This is no longer true for a modern 3D PET system without septa, particularly if the axial FOV is >17 cm. Therefore, the most significant change in the NU 2-2001 standard, compared with the NU 2-1994 standard, is the change from a 19-cm-long phantom to a 70-cm-long phantom (albeit with a line source) for several of the tests, including sensitivity, scatter fraction, counting rate performance, and count loss correction. The 70-cm-long phantom is a better approximation to the activity distribution in whole-body studies, because the effects of out-of-field activity (OFA) are included in the performance measurement. The 20 × 19 cm NEMA phantom, on the other hand, continues to be used to test the performance of scanners used primarily for brain imaging, particularly for scanners that are dedicated brain imaging instruments.
Another major change in the updated standard is the addition of an image quality test. This measurement attempts to reproduce a clinical situation (an FDG whole-body study) and to take all aspects of camera performance and clinical imaging into consideration, including image reconstruction. The phantom used for this measurement is the IEC body phantom (3) with hot and cold spheres with an additional cylindric insert to simulate lung, as well as a second phantom to provide activity outside the scanner to simulate body uptake. This test was designed to mimic an FDG tumor study, with typical background activity and hot sphere contrasts encountered in those studies. The test is performed with a standard acquisition protocol that allows comparison between different types of PET scanners.
This article presents a description of each test and discusses the changes from the NU 2-1994 standard, along with illustrative data using several different PET systems. The NEMA Standards Publication NU 2-2001 (4), which provides more detail than presented here, is available from NEMA (1300 N. 17th St., Suite 1847, Rosslyn, VA 22209, www.nema.org). Readers wishing to perform the measurements should consult this document for a complete description of the procedures.
MATERIALS AND METHODS
The performance tests are divided into 2 groups. The first group includes the basic intrinsic measurements of (a) spatial resolution, (b) sensitivity, (c) scatter fraction, and (d) count losses and random coincidences. The second group includes measurements of the accuracy of corrections for physical effects, specifically (e) count losses and random coincidences, and (f) overall image quality. The only radioisotope that is used is 18F. It is our experience that other radioisotopes (e.g., 68Ga or 22Na) are not as simple to calibrate for the sensitivity and count losses measurements, and their longer positron ranges preclude their use for measuring spatial resolution. Each test requires that the operating parameters of the scanner be adjusted, as they would be for a typical patient study, including the energy window, axial acceptance angle, coincidence time window, and slice thickness. The only exception to this requirement is for the measurement of spatial resolution, where finer sampling than is used clinically is allowed. The data processing and reconstruction algorithms should also be the same as those used for a typical patient study, with the exception that some tests require the use of filtered backprojection with a ramp reconstruction filter or single-slice rebinning (5) for standardization among systems. Système Internationale d’Unites (SI) units are used for all reports of performance measurements. For all studies, fully tomographic data are acquired (i.e., rotating scanners must rotate to provide complete angular sampling).
Spatial Resolution
The spatial resolution of a system represents its ability to distinguish between 2 points of radioactivity in an image. The purpose of the measurement of spatial resolution is to characterize the widths of the point spread function (PSF) in the reconstructed image of compact radioactive sources. The width of the PSF is reported as the full width at half maximum (FWHM) and full width at tenth maximum (FWTM). The spatial resolution is measured in the transverse slice in 2 directions, radially and tangentially, and in the axial direction.
For all scanners, point sources of 18F (<1-mm extent in any direction) are imaged in air. The point source consists of a small quantity of concentrated radioactivity inside a glass capillary (wall thickness, <0.5 mm). The resolution is measured with the sources at 6 locations. Two axial positions are selected—namely, the center of the axial FOV and a position one fourth of the axial FOV from the center. For both axial locations, the source is imaged at 3 positions, (a) x = 0 and y = 1 cm (to avoid the exact center of the scanner where the sampling density of lines of response may be very high), (b) x = 0 and y = 10 cm, and (c) x = 10 and y = 0 cm.
The data are reconstructed with filtered backprojection using an unapodized filter (ramp filter with a cutoff at the Nyquist frequency); the image pixel size should be smaller than one third of the expected FWHM. No smoothing of the data is performed. The FWHM and FWTM of the PSFs are determined in all 3 directions by forming 1-dimensional (1D) response functions through the peak of the distribution in the 3 orthogonal directions. The width of these profiles at right angles to the direction of measurement is ∼2 times the FWHM in those directions, rather than a single pixel, to reduce measurement variability. The FWHM and FWTM are calculated by linear interpolation between adjacent pixels at one half or one tenth of an estimate of the maximum value of the response function. This maximum value is determined by a parabolic fit using the peak value and its 2 nearest neighboring points. The radial, tangential, and axial resolutions for each radius, averaged over both axial positions, are reported.
Intrinsic Scatter Fraction
The scattering of annihilation photons leads to falsely positioned coincidence events. Variations in design cause PET scanners to have different sensitivities to scattered radiation. The intrinsic scatter fraction is a measure of the relative system sensitivity to scatter. For a given source distribution, a lower scatter fraction is more desirable, regardless of the accuracy of the method for scatter correction, because correction techniques cannot compensate for the noise introduced by the unwanted events and can, potentially, add bias to the image. Here, we define the scatter fraction to be the ratio of scattered events to total events, which are measured at a sufficiently low counting rate that random coincidences, dead-time effects, and pileup are negligible. Total events, therefore, are the sum of unscattered events (trues) and scattered events.
The phantom in this measurement, as well as that of count losses and randoms, comprises a 20-cm-diameter solid polyethylene cylinder with an overall length of 70 cm. The data for the measurement of intrinsic scatter fraction are taken from the low-activity scans of the measurement of counting rate performance, when the count loss and randoms rates are both <1% of the true rate. Activity is placed in a line source that is threaded through a hole in the cylinder at a radius of 4.5 cm and parallel to the central axis. It should be noted that the line source (∼2.3-mm inner diameter, ∼3-mL fillable volume) is sufficiently large to preclude problems with bubbles, despite its length, provided reasonable care is taken during filling. For consistency, the phantom is rotated such that the line source is at the lowest position (i.e., nearest to the patient bed), because the measured result will depend on the relative orientation of the line source and the bed.
Data are sorted into a sinogram, which is the 2D projection space representation (projection ray vs. angle) of a transverse plane. Oblique LORs are assigned to the slice where the LOR crosses the scanner axis using single-slice rebinning (5). Because the transaxial physical FOV of scanners varies, a fixed diameter of 24 cm (4 cm larger than the phantom diameter) is used for the calculation of scatter, as was done in the NU 2-1994 standard. The sinogram profile is used to calculate the number of scatter events within the FOV and the number of trues within a 2-cm radius of the source. The scatter within the peak is estimated by assuming a constant background under the peak, the level of which is determined by the average of the intensities near the edge of the peak (at ±2 cm). The sinogram profile is analyzed as a function of angle and the results are averaged. The scatter fraction for each slice and the average of the slice scatter fractions are reported.
Sensitivity
The sensitivity of a scanner represents its ability to detect annihilation radiation. In the NU 2-2001 standard, the absolute sensitivity of a scanner (expressed as the rate of detected coincidence events in counts per second [cps] for a given source strength, expressed in MBq) is measured. The measurement technique is based on the method of Bailey et al. (6). Because the emitted positrons annihilate with electrons to create a pair of γ-rays, a significant amount of material must surround the source to ensure annihilation. This surrounding material also attenuates the created γ-rays, prohibiting a measurement without interfering attenuation. To arrive at an attenuation-free value of the sensitivity, successive measurements are made with a uniform line source surrounded by known absorbers. The sensitivity with no absorber can be extrapolated from these measurements.
In the NU 2-1994 standard, the sensitivity was measured using a standard distributed source and reported as the rate of coincidence events for a given activity concentration in that phantom (20-cm diameter, 19-cm long). For scanners with an axial FOV longer than 19 cm, however, this measurement could underrepresent the efficiency of the scanner. For other measurements (e.g., scatter), a 70-cm-long phantom is used, as a way to standardize the phantom. A 70-cm-long uniform cylinder, however, would be impractical to fill and to handle. For those reasons, it was decided to move from the historical but arbitrary method of measuring sensitivity with a cylindric phantom to one less affected by the self-attenuation of a uniform cylindric source.
A 70-cm-long plastic tube is filled with a known amount of radioactivity, sufficiently low that count losses and randoms are negligible. The tubing is encased in metal sleeves of varying thickness and imaged, suspended in the center of the transverse FOV. Alternatively, the radioactivity can be placed in the smallest metal sleeve, as long as it is well sealed. Consideration was given to the sleeve material; it was agreed that the metal does not need to be specified, because the measurement is self-consistent. Single-slice rebinning is used to assign oblique LORs to the slice where the LOR crosses the scanner axis. The counting rate in the absence of attenuation Ro is determined by fitting the measured counting rates Rj as a function of sleeve thickness Xj:
 Eq. 1 The attenuation coefficient μ may be unknown, because the composition of the metal sleeves is not specified; in addition, small amounts of scattered radiation present will cause μ to deviate from the narrow-beam value for the metal used. For these reasons, both Ro and μ are determined by the fitting process. The total sensitivity Stot is given by Ro, divided by the measured activity (in MBq). The slice sensitivity Si is determined by scaling Stot by the fraction of total counts contained in slice i for the thinnest sleeve (R1,i):
 Eq. 2 where
 The measurement of total sensitivity is repeated with the source offset radially 10 cm from the center of the transverse FOV. The total sensitivity and slice sensitivities for both radial positions are reported.
Counting Rate Performance
Most patient PET studies are not performed under conditions of low counting rate losses or negligible randoms rates. At higher activity levels, coincidence events are lost because of system dead time, whereas the rate of random coincidences rises. It is necessary to measure the counting rate performance (both dead-time losses and randoms) as a function of activity to understand the scanner’s behavior for a wide range of scanning conditions.
The 70-cm polyethylene cylinder with a line source described for the measurement of the intrinsic scatter fraction is used in this measurement. For this procedure, however, the line source is filled with a known initial amount of activity sufficiently high that both the peak trues rate and the peak noise equivalent count (NEC) rate (7) can be measured. This starting activity is determined empirically for each scanner and acquisition mode; the manufacturer will generally provide a recommended initial activity. Data are taken until the randoms and dead-time losses are negligible. To avoid potential problems with nonuniform dead time associated with the off-center line source, completely tomographic data are acquired. Sinograms are generated, and oblique sinograms are collapsed into a single sinogram for each slice while preserving counts by using single-slice rebinning.
The total counting rate within a 24-cm transverse FOV is determined as the activity decays. The background, resulting from randoms and scatter, is estimated as was done for the intrinsic scatter fraction measurement. The true event rate Rtrues is then determined by subtracting the randoms + scatter background from the total rate Rtotal. The randoms rate Rrandoms is calculated as:
 Eq. 3 where SF is the intrinsic scatter fraction. The scatter rate Rscatter is given by:
 Eq. 4 Finally, the NEC rate is computed as a function of activity:
 Eq. 5 where k = 2 if the scanner clinically does on-line randoms subtraction (i.e., the estimate of randoms is noisy) and k = 1 otherwise (i.e., the estimate of randoms is noise-free). The total, true, randoms, scatter, and NEC rates are plotted against an effective activity concentration, computed as the total activity in the line source divided by the total volume of the cylindric phantom (22,000 mL). This effective activity concentration, though an arbitrary scaling of the line source activity, corresponds closely to clinical activity concentrations and the counting rates seen at those clinical concentrations. From the counting rate plot, the peak true counting rate and peak NEC rate are determined and reported, along with the activity concentrations where these peak rates occur.
Accuracy of Corrections for Count Losses and Randoms
To achieve quantitative measurements of source activity distributions under widely varying conditions, PET scanners must have the capability to compensate for dead-time losses and randoms. The accuracy of these corrections, particularly at the highest counting rates encountered in clinical imaging, is reflected by the bias with which the scanner reports counts.
The accuracy of corrections for dead-time losses and randoms is determined from the counting rate performance data, described above. The data are reconstructed with all count-rate–dependent corrections (i.e., for dead-time losses and randoms) applied. A large (18-cm diameter) region of interest (ROI) is defined, centered on the phantom, and the residual error ΔR as a function of effective activity concentration is given by:
 Eq. 6 where Rextrap is determined from the low counting rate data, where there are negligible dead-time losses or randoms, and is assumed to be a linear function of activity. A large ROI is used, as opposed to a small region centered on the line source, to reflect any inaccuracies in randoms subtraction over the entire phantom. The errors are calculated for each slice, and the largest and smallest errors over all slices are plotted as a function of effective activity concentration. The maximum absolute value of the bias is also reported for activity values at or below the activity level of the peak NEC rate.
Image Quality Measurement
Because of the complex interplay of different aspects of system performance, it is desirable to be able to compare the image quality of different imaging systems for a standardized imaging situation that simulates a clinical imaging condition. The purpose of this measurement is to produce images simulating those obtained in a whole-body study with both hot and cold lesions. Spheres of different diameters are imaged in a simulated body phantom with nonuniform attenuation. Activity is also present outside the scanner.
The phantom consists of a torso phantom (3,8), containing hot and cold spheres (wall thickness, ≤1 mm) in a warm background. The hot spheres have inner diameters of 1.0, 1.3, 1.7, and 2.2 cm; the cold spheres have inner diameters of 2.8 and 3.7 cm. A 5-cm-diameter insert with an attenuation coefficient approximately equal to the average value in lung (density, 0.30 g/mL) is also placed in the center of the phantom, and measured attenuation correction is performed. The background is filled with 18F at an activity concentration typical of what is seen in patient FDG studies (370 MBq/70-kg patient, or 5.3 kBq/mL). The hot spheres are sequentially filled with activity concentrations of 8 and 4 times that of the background (2 sequential acquisitions). This process is efficiently accomplished by first putting the background activity in one eighth of the background’s volume, withdrawing sufficient volume to fill the spheres, and then filling the rest of the background with nonradioactive water. After 1 half-life has elapsed, another sample of background activity (measured at the same time as the initial aliquot) is used to increase the background activity back to the starting level and reduce the hot sphere activity ratio to 4:1. The line source of the 70-cm-long phantom is filled with sufficient activity to yield an effective activity concentration (as defined above) equal to that of the background in the torso phantom; the 70-cm-long phantom abuts the body phantom to approximate the clinical situation of having activity outside the scanner FOV.
The acquisition protocol being simulated is to scan an axial distance of 100 cm in 60 min. The data acquisition time is determined by considering the axial distance Δz that the bed is translated between positions in a whole-body study (typically less than the axial FOV). The acquisition time Tacq is calculated by:
 Eq. 7 Tacq includes both emission and transmission scan durations and any other nonimaging transition times (e.g., for bed movement or transmission source loading or unloading). This normalization of the scan duration is essential because of the wide range of axial FOVs in current-generation PET systems. Three replicate measurements should be acquired to improve the reliability of the results.
The data are reconstructed with all available corrections applied, using the standard reconstruction algorithm and usual parameters for whole-body studies. To quantitate the image quality, ROIs with diameters equal to the physical inner diameters of the spheres are drawn on the spheres and throughout the background. Twelve background ROIs are drawn in the central slice, as well as in slices ±10 mm and ±20 mm away, for a total of 60 background ROIs of each size. The coefficient of variation of the means in these background ROI values for each sphere size is taken as a measure of the background variability. The hot sphere contrast recovery coefficient (CRChot) is calculated as:
 Eq. 8 where Chot and Cbkgd are the average of the counts measured in the hot sphere ROI and the average of the counts in all background ROIs, respectively, and ahot /abkgd is the ratio of the activities in the hot sphere and background. The cold sphere CRC (CRCcold) is calculated as:
 Eq. 9 where Ccold is the average of the counts measured in the cold sphere ROI. The hot and cold sphere CRCs for the 6 spheres, as well as their corresponding values of background variability, are reported.
In addition, the accuracy of the corrections for attenuation and scatter is assessed by drawing an ROI in the region of the lung insert. The residual error (ΔClung) is calculated for each slice as:
 Eq. 10 where Clung is the average of the counts in the lung insert ROI. Transverse and coronal images are also reported because of the difficulty in devising appropriate quantitative measures to express all aspects of image quality.
RESULTS AND DISCUSSION
Spatial Resolution
The measurement of spatial resolution accomplishes several goals. It characterizes the shape of the reconstructed PSF at both the FWHM and the FWTM levels, in the 3 orthogonal directions, radial, tangential, and axial. This allows a best-case evaluation of scanners, taking into account the variation in resolution with radial distance. The data are taken only at low counting rates, so that potential problems at high counting rates (e.g., event pileup) are not encountered.
The measured spatial resolution will depend on the acquisition and reconstruction sampling. Figure 1 shows the transverse resolution on an ADAC UGM C-PET scanner (ADAC UGM, Philadelphia, PA) (9) for various sampling schemes. The radial sampling ranged between 0.5 and 4.5 mm; this was achieved by varying the transverse FOV between 128 and 576 mm and the number of radial samples from 128 to 256. The transverse angular sampling was 0.94° or 1.88°. Image pixel sizes ranged between 0.5 and 4.0 mm. The resolution achieved under clinical protocols can be noticeably worse than the best possible value, obtained with 0.5-mm radial sampling and 0.5-mm pixels. For example, in clinical brain imaging on this scanner, 2-mm radial sampling and 2-mm image pixel size are used, degrading the resolution by >1 mm from the best achievable value.
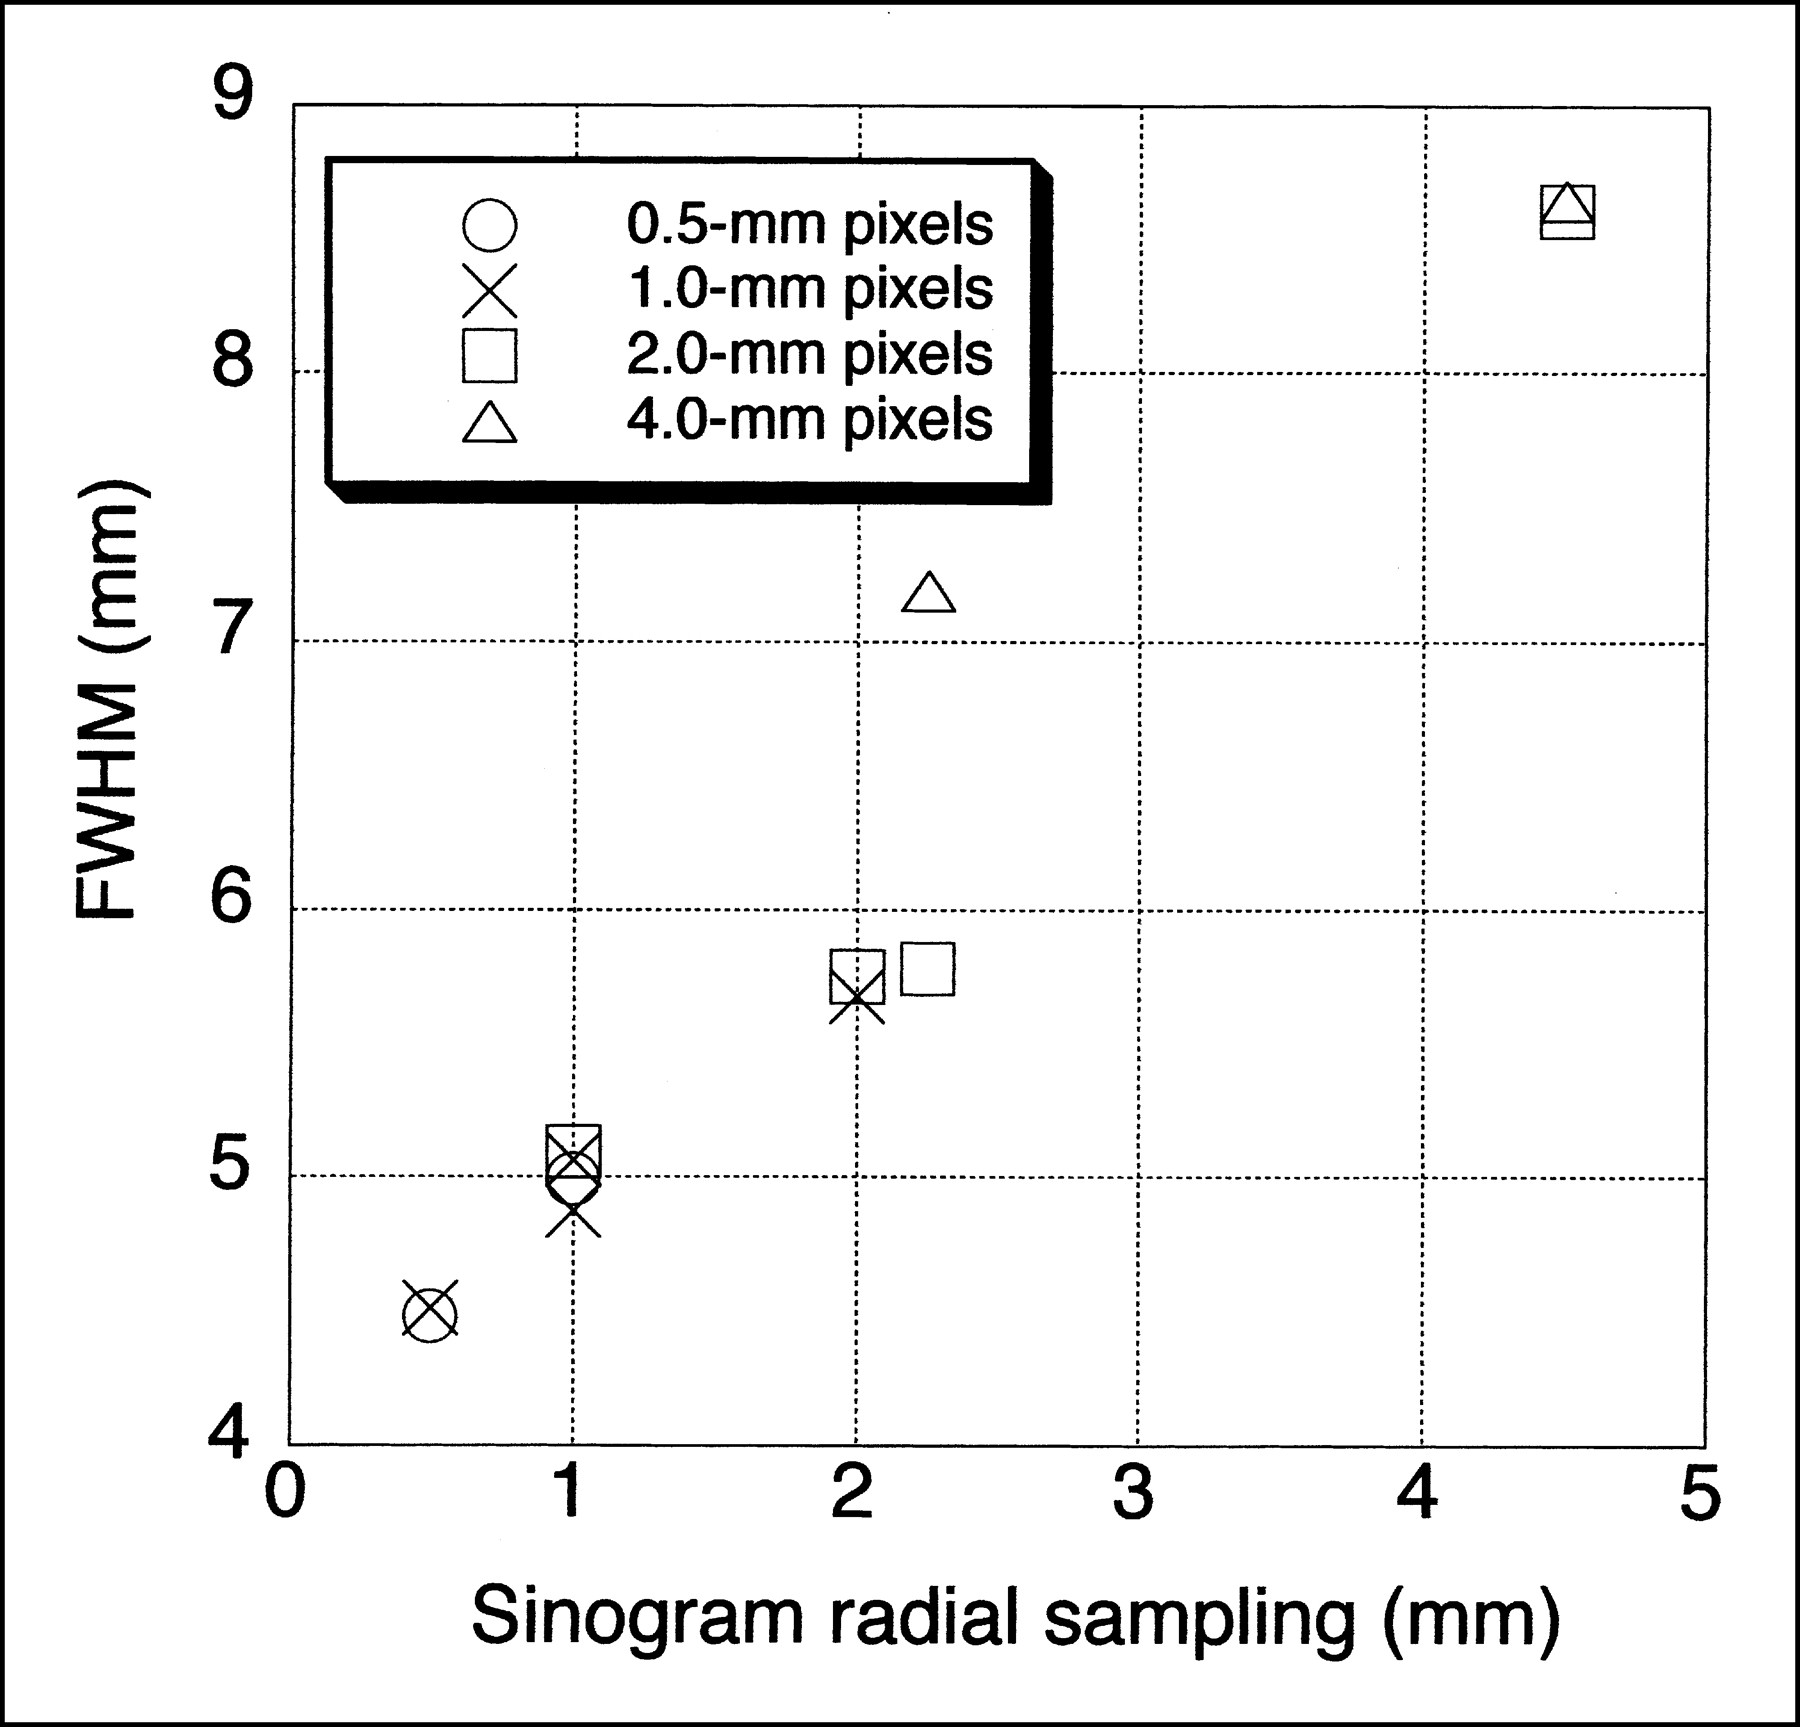
Effect of acquisition and reconstruction sampling on transverse spatial resolution. FWHM values for central point source are shown for ADAC UGM C-PET scanner as function of radial sampling in sinogram and image pixel size. Following NU 2-2001 protocol, best spatial resolution would be measured; clinical parameters typically have 2- to 4-mm sinogram radial sampling and pixel size, which result in significantly degraded resolution on this system.
The measurement of transverse spatial resolution was specified in the NU 2-1994 standard to use a line source positioned perpendicular to the plane (i.e., parallel to the scanner z-axis). The updated standard specifies that a point source be used. Slight misalignments of a line source with the scanner axis will lead to degraded resolution compared with that measured with a point source. The resolution measured with a point source, therefore, can be expected to be slightly better than that determined with a line source (approximately several tenths of a millimeter).
Another difference between the previous and updated standards is in the specification of the width of the profile drawn for the purposes of generating the 1D response functions. The profile width can affect the measured spatial resolution if the response is not a gaussian function. Transverse resolution values (FWHM and FWTM) for the ADAC UGM C-PET scanner are compared in Table 1 for profile widths of 2 × FWHM, as specified by the standard, and 1 mm (2 pixels). The data had 0.5-mm radial sampling, 0.5-mm pixels, and a 4-mm slice separation. The results are for the source at x = y = 0 cm; because this scanner has continuous sampling, as opposed to a discrete ring of crystals, the FWHM at y = 0 cm is the same as that at y = 1 cm. A narrow profile (1–2 pixels), in general, leads to a lower FWHM, whereas a wide profile, as specified by NU 2-2001, results in a higher FWHM because of a potentially more asymmetric PSF. However, the narrower profile can also lead to a more variable result, whereas the wider profile is less sensitive to the relative position of the point source with respect to a voxel. In selecting a width of 2 × FWHM, the task force determined that reproducibility of the result was of highest importance.
Effect of Profile Width on Spatial Resolution
Because the images are reconstructed with sharp filters, the resolution results also do not directly indicate the spatial resolution expected in tissue with limited statistics. Clinical data are usually reconstructed with a smooth filter, or a different reconstruction algorithm entirely, the choices of which are very subjective in nature and, therefore, difficult to standardize. Assuming all other performance parameters are equal, a scanner with better intrinsic spatial resolution measured with filtered backprojection in air will have better spatial resolution in a clinical situation as well. For the purpose of understanding and predicting clinical resolution, it may be of interest to repeat the measurement under clinical conditions. However, it can be particularly misleading to measure spatial resolution in an image reconstructed with an iterative reconstruction algorithm, because the resolution achieved with these algorithms is highly dependent on the local distribution of activity (10). It was for this reason that filtered backprojection was specified as the reconstruction algorithm for this particular measurement. It should be noted that the intrinsic spatial resolution measurement also does not directly provide information that can be used to perform quantitative partial-volume corrections.
The reader is cautioned that the sampling in the axial direction of ring-based PET scanners may not be sufficient to produce a meaningful measure of axial resolution with the new standard. The value for the FWHM measured at a single axial location with such a system can vary dramatically, depending on the location of the source with respect to the imaging slice. This effect is demonstrated for the General Electric (GE) Advance scanner (General Electric Medical Systems, Milwaukee, WI) operated in 3D mode (slice separation, 4.25 mm) in Table 2, where the results of 2 repeated measurements are shown (similar results were obtained for 2D mode). In both measurements, the source was centered using the laser alignment device. The axial resolution measured, averaged over the 2 axial positions A (Z = 0) and B (Z = 1/4 FOV) specified by the NU-2 2001 standard, was 7.3 and 8.4 mm for the 2 measurements. However, if additional measurements are made with the source moved one half of a slice separation (2 mm for this scanner) from the locations specified by the NU 2-2001 standard (positions C and D), and the data for all 4 source positions are averaged, the resulting value for the axial resolution is much more stable (6.8 vs. 7.2 mm). Because it is difficult in practice to achieve the necessary positioning accuracy to guarantee exact centering of the point source on a slice, it is suggested that measurements on ring-based scanners be taken with the source located as specified in the standard but also moved one half of a slice separation. The results can then be averaged over the 4 axial locations. This issue was avoided in the NU 2-1994 standard by measuring the axial profile width instead of the axial resolution for scanners with axial sampling inadequate to perform the axial resolution measurement. The axial profile width measurement involved acquiring many scans at fine axial intervals. In addition, the scan data were not reconstructed, so effects of reconstruction processing on axial spatial resolution could not be assessed. Because the measurement was time-consuming and did not include processing effects, it was decided to measure the axial resolution on all scanners, regardless of sampling.
Impact of Inadequate Axial Sampling on Axial Resolution Measurement
Intrinsic Scatter Fraction
A major motivation for using a longer phantom in the NU 2-2001 standard was to measure the effects of OFA, including increased scatter. Table 3 shows the results for the scatter fraction measurement following the NU 2-1994 and NU 2-2001 protocols on scanners with different axial FOVs. It can be seen that the measured scatter fraction for a scanner operating in 2D mode is only slightly increased compared with that measured following the NU 2-1994 procedure. However, scanners that operate in 3D mode show markedly higher (35%–40%) scatter fractions with the new standard.
Comparison of Intrinsic Scatter Fraction from NU 2-1994 and NU 2-2001 Standards
There are 2 differences between the NU 2-1994 and NU 2-2001 protocols for intrinsic scatter fraction, the longer phantom and the single measurement at a radial position of 4.5 cm. The scatter fraction measured at a radial distance of 4.5 cm is somewhat higher than the area-weighted average of scatter fraction measured for a line source at radial distances r = 0, 4.5, and 9.0 cm, as specified previously by the NU 2-1994 standard. On the ADAC UGM C-PET scanner with a lower energy threshold of 450 keV, the weighted average of the 3 source positions in a 19-cm-long phantom is 25% ± 3%, whereas the result from a single measurement at 4.5 cm for the same phantom is 30% ± 3%. It is expected that other scanners would show a similarly higher scatter fraction for the single measurement. The difference (20%) accounts entirely for the increase in scatter fraction seen for 2D acquisition mode on the GE Advance scanner in Table 3.
An important consideration in interpreting the results of the intrinsic scatter fraction measurement is that the scatter fraction, as measured with either the 19-cm-long or 70-cm-long cylinder, is not representative of a realistic head or body size. It is useful for standard evaluations among scanners of different configurations. However, in the effort to use 1 phantom, the diameter of both phantoms (20 cm) is a compromise between a brain and a body. This makes it difficult to predict the absolute level of scatter that will be encountered in patient imaging situations. However, the scatter fraction measured with the 20-cm-diameter phantom on a particular PET system will indicate the relative level of scatter measured in a patient study.
Sensitivity
The total sensitivity values for several scanners are shown in Table 4 for radial positions of 0 and 10 cm. Results are also given using the uniform cylinder, as specified in the NU 2-1994 standard. Because the source configurations and definitions of sensitivity differ significantly between the 2 standards, it is difficult to compare the results directly. However, the relative ordering of sensitivity values among scanners should be the same for the 2 measurements, although there will not be a single scaling factor between the results for the 2 standards. As an example, the sensitivity values following the NU 2-1994 standard for the ADAC MCD system, with a 37-cm axial FOV, are significantly lower than would be expected from the NU 2-2001 values because the axial FOV is much longer than the older phantom (length, 19 cm). Also, there is a radial dependence of the NU 2-2001 sensitivity values for the coincidence gamma camera that is almost absent in the 2 circular systems.
Comparison of Volume Sensitivity from NU 2-1994 and NU 2-2001 Standards
It should be pointed out that the sensitivity is expressed as the rate of coincidence events per activity in the entire line source. A scanner with a shorter axial FOV will, therefore, have a lower value than one with a longer FOV that encompasses more of the line source. An alternate scaling would have been to record the coincidence counting rate per activity inside the axial FOV. However, this scaling does not reflect the fact that a scanner with a longer axial FOV will require less time (have higher effective sensitivity) to scan a whole body than one with a smaller FOV, for the same count density.
Counting Rate Performance
Table 5 shows typical peak counting rates for a GE Advance scanner, operated in both 2D and 3D modes, for the NU 2-1994 and NU 2-2001 standards. There is a dramatic decrease in the peak true and NEC rates for 3D acquisitions following the new standard compared with those for the old standard. This is largely due to the increase in randoms and dead time (decreased trues) as well as the higher scatter fraction from the OFA associated with the longer phantom. There was inadequate activity in the line source to achieve either the peak true or peak NEC rates in 2D mode on this scanner.
Peak Counting Rates for NU 2-1994 and NU 2-2001 Standards
It is important in comparing performance between scanners to look both at the peak true and NEC counting rates and at the activity levels where these peak rates occur. A highly sensitive system may saturate at a relatively low activity level, but the counting rate at this level may be higher than that of a system with lower sensitivity at a higher activity level.
A concern with using the line source to measure the counting rate performance was whether it yields counting rates (and effective activity concentrations) that are clinically relevant. Figure 2 shows a plot of the prompt rate as a function of singles rate for phantom and patient data. On the top are shown the counting rates for the ADAC UGM C-PET scanner for the 70-cm-long line source in a 20-cm-diameter polyethylene cylinder (following the NU 2-2001 standard) and whole-body patient studies. On the bottom are shown the counting rates for the University of Pennsylvania GSO brain scanner (G-PET) for the 20-cm-diameter × 19-cm long water-filled cylinder (following the NU 2-1994 standard) and brain patient studies. There is good correlation between the measured counting rates for the 70-cm line source and whole-body studies. Such a correlation has not been observed for the 19-cm-long uniform cylinder (9). Points lying below the phantom line correspond to patients whose attenuation is greater than that of a 20-cm-diameter cylinder. There is also good agreement between the measured counting rates for the 20-cm cylinder and brain studies. These results indicate that the 70-cm line source in the 20-cm-diameter polyethylene cylinder is a reasonable approximation to the clinical whole-body activity distribution (albeit for thin patients), whereas the 20 × 19 cm long cylinder is a good representation of the clinical brain activity distribution.
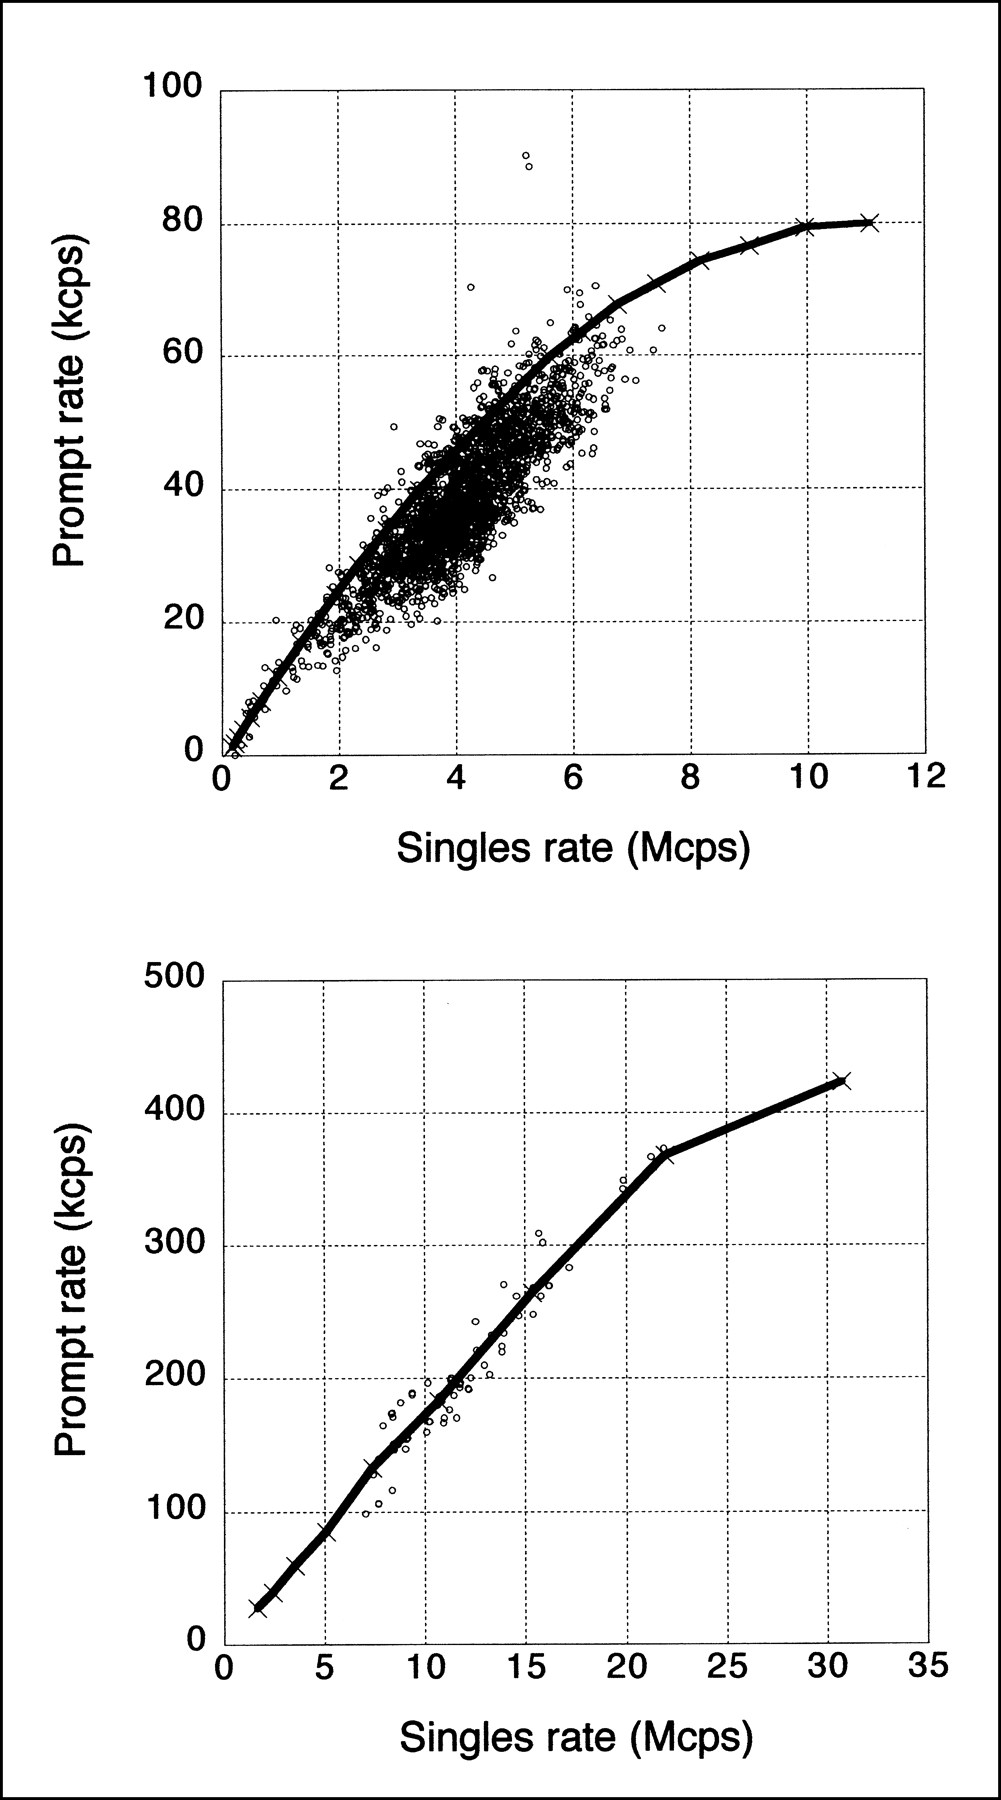
Comparison of phantom and patient counting rates. (Top) Prompt rate vs. singles rate for 70-cm-long line source in 20-cm-diameter polyethylene cylinder (solid line) and for whole-body patient studies (○) taken on ADAC UGM C-PET scanner. (Bottom) Prompt rate vs. singles rate for 20-cm-diameter × 19-cm-long water-filled cylinder (solid line) and for brain patient studies (○) taken on University of Pennsylvania G-PET scanner. Singles rate is proportional to (unknown) activity in patients.
The measurement procedure specifies that the line source be filled with sufficient activity to measure the peak true and peak NEC rates. The volume of the line source is approximately 3 mL. For a 3D system operating without septa, the amount of activity required is 370–550 MBq (∼10–15 mCi). However, for 2D systems with septa, the amount of activity required to reach the peak trues or peak NEC counting rates can be significantly higher (on the order of 5.5–7.5 GBq [150–200 mCi]); as has been seen, it can be difficult to achieve this activity level in the small volume of the line source. For 2D systems with septa, it may not be possible to measure the peak true or peak NEC counting rates with the line source method. It should be noted that these activity levels are generally not clinically relevant in whole-body FDG studies (where the activity concentrations are on the order of 4 kBq/mL) because of limitations on patient radiation exposure. However, the line source phantom may not be helpful at predicting the performance for bolus studies in 2D mode. An alternate approach would be to perform the measurement with the 20-cm-diameter cylindric phantom, following the NU 2-1994 standard. Because the effects of OFA are small for scanners operating in 2D mode with septa, the counting rate performance should be comparable to that achieved with high activity levels in the line source, following the NU 2-2001 standard. In addition, counting rates in brain studies correlate well with those seen with the 20-cm phantom (9), as seen in Figure 2.
The NEC rate gives a measure of the signal-to-noise ratio (SNR) in an image, which could be used to assess the image quality at different activity levels. However, the NEC is only a global measure that is not sensitive to local variations of the SNR for particular source distributions. Because local variations (e.g., from event mispositioning) can occur at higher counting rates, it is important to look at the reconstructed images as well.
This measurement does not provide data for a realistic distribution, such as the brain or heart. The IEC group has suggested collecting counting rate performance data for 3 different configurations to simulate the head, heart, and thorax (3). The difficulty with this procedure is that 3 times as much data must be taken and processed. In addition, it has been our experience (9) that the IEC counting rate measurements for 3D systems do not, in fact, correlate well with cardiac and whole-body FDG studies because of the absence of activity outside the scanner. On the other hand, the counting rates for the 70-cm-long sources are well correlated with the counting rates seen in whole-body patient studies (9), as seen in Figure 2.
Following the NU 2-2001 standard, random events are estimated, rather than being measured separately (or calculated from the single event rates), as was assumed in the NU 2-1994 standard. The measurement of randoms is, therefore, independent of the scanner’s technique for determining the random event rate. The rationale for this change was that not all PET scanners currently have the ability to measure random coincidences accurately. However, there are several limitations to the method specified to estimate the scattered and random event rates. These background events are estimated by assuming a constant background under the peak in the sinogram, the level of which is determined by the intensities at ±2 cm from the peak. However, this background may include other misplaced events as part of the randoms measurement, especially at high counting rates. In addition, shifts in the photopeak with counting rate or any difference in dead-time effects for true, random, and scattered events may influence the randoms estimate, because the scatter fraction is assumed to be independent of counting rate. Finally, the assumption of a constant background under the peak in the sinogram ignores the spatial variation of scatter, so small-angle scatter is effectively included in the determination of true events.
It is important in this measurement that the activity in the line source be accurately determined. There are 2 possible methods by which this can be accomplished. The line source can be filled, coiled, and placed in a dose calibrator. Alternatively, the line source can be filled, and any residual activity remaining measured, with the line source activity being calculated from the difference of the 2 measured activities. The first has the advantage that the line source activity is measured directly; however, manipulating the line source in this manner can make it prone to leaks, and the response of the dose calibrator is sensitive to the geometry of the coil inside the well. The second method is straightforward, but care should be taken when filling the line source to ensure that no activity is spilled.
To compare the counting rate performance of various PET systems, it is necessary to specify the level of activity to which the scanner is exposed. The total activity in the line source is not a meaningful number if the FOV of the scanner is significantly less than the length of the source (70 cm), because not all of that activity is detected by the scanner. The activity inside the FOV could be an appropriate parameter but, for comparisons with other scanners, an activity concentration seemed more relevant. For that reason, the effective activity concentration is used as the common denominator in this measurement.
Accuracy of Corrections for Count Losses and Randoms
The results of measurements of the accuracy of corrections for count losses and randoms have been reported for 2 different scanners (9,11). For both systems, a rather large error (15%–40%) was reported at or below activity levels where the peak NEC rate is achieved. The use of a line source for this measurement, rather than a distributed source, may prove to be more challenging, from the point of view of accurate corrections for random coincidences and dead time. However, it should be noted that the activity levels where the NEC rate peaks may also be higher than those seen clinically.
The large ROI centered on the phantom was chosen rather than a smaller one, centered on the line source itself, because random (and scattered) coincidences are globally distributed throughout the FOV, not just in the region of radioactivity. Without proper correction for randoms throughout the image, image contrast will change as a function of activity level. Using a larger ROI permits an assessment of the global accuracy of the randoms subtraction.
Image Quality Measurement
Figure 3 shows a representative image for a 6-min emission scan from the study with an 8:1 ratio of sphere-to-background activities taken on the ADAC UGM C-PET scanner. Also shown is the placement of ROIs for the quantitative analysis.

Representative image from image quality measurement for 6-min emission scan with hot sphere:background activity ratio of 8:1. Data were taken on ADAC UGM C-PET scanner and reconstructed with 3D RAMLA. Shown on right is placement of ROIs for quantitative analysis. Not shown is ROI for assessment of accuracy of corrections for attenuation and scatter, drawn on central lung-like cylindric insert.
Because a single scan has limited statistics, due to the limit on acquisition time, the results can be expected to vary somewhat from scan to scan. Table 6 shows results for the CRC, and Table 7 shows results for background variability for 2 repeated scans taken on the ADAC UGM C-PET scanner. Each emission scan was 6-min long and reconstructed with the 3D row action maximum likelihood algorithm (RAMLA) (12,13), using the clinical parameters. The percentage difference in Tables 6 and 7 was calculated as the absolute difference between the 2 scans, divided by the average value. Both the background variability and the measured contrast of a given sphere vary between scans. For this reason, the standard recommends that the measurement be repeated at least 3 times (with the durations of the replicate scans increased to compensate for physical decay) and the results averaged.
Reproducibility of Image Quality Results: CRC
Reproducibility of Image Quality Results: Background Variability
The measured image quality will depend on the reconstruction algorithm. Figure 4 shows the contrast versus background variability for the 1.7-cm sphere for 2 reconstruction algorithms (filtered backprojection and 3D RAMLA) over a range of reconstruction parameters. The arrow shows the results for the clinical parameters for 3D RAMLA. It can be seen that the image quality varies with reconstruction algorithm; it is important, therefore, that the image quality data be reconstructed with the algorithm and parameters used on patient data.
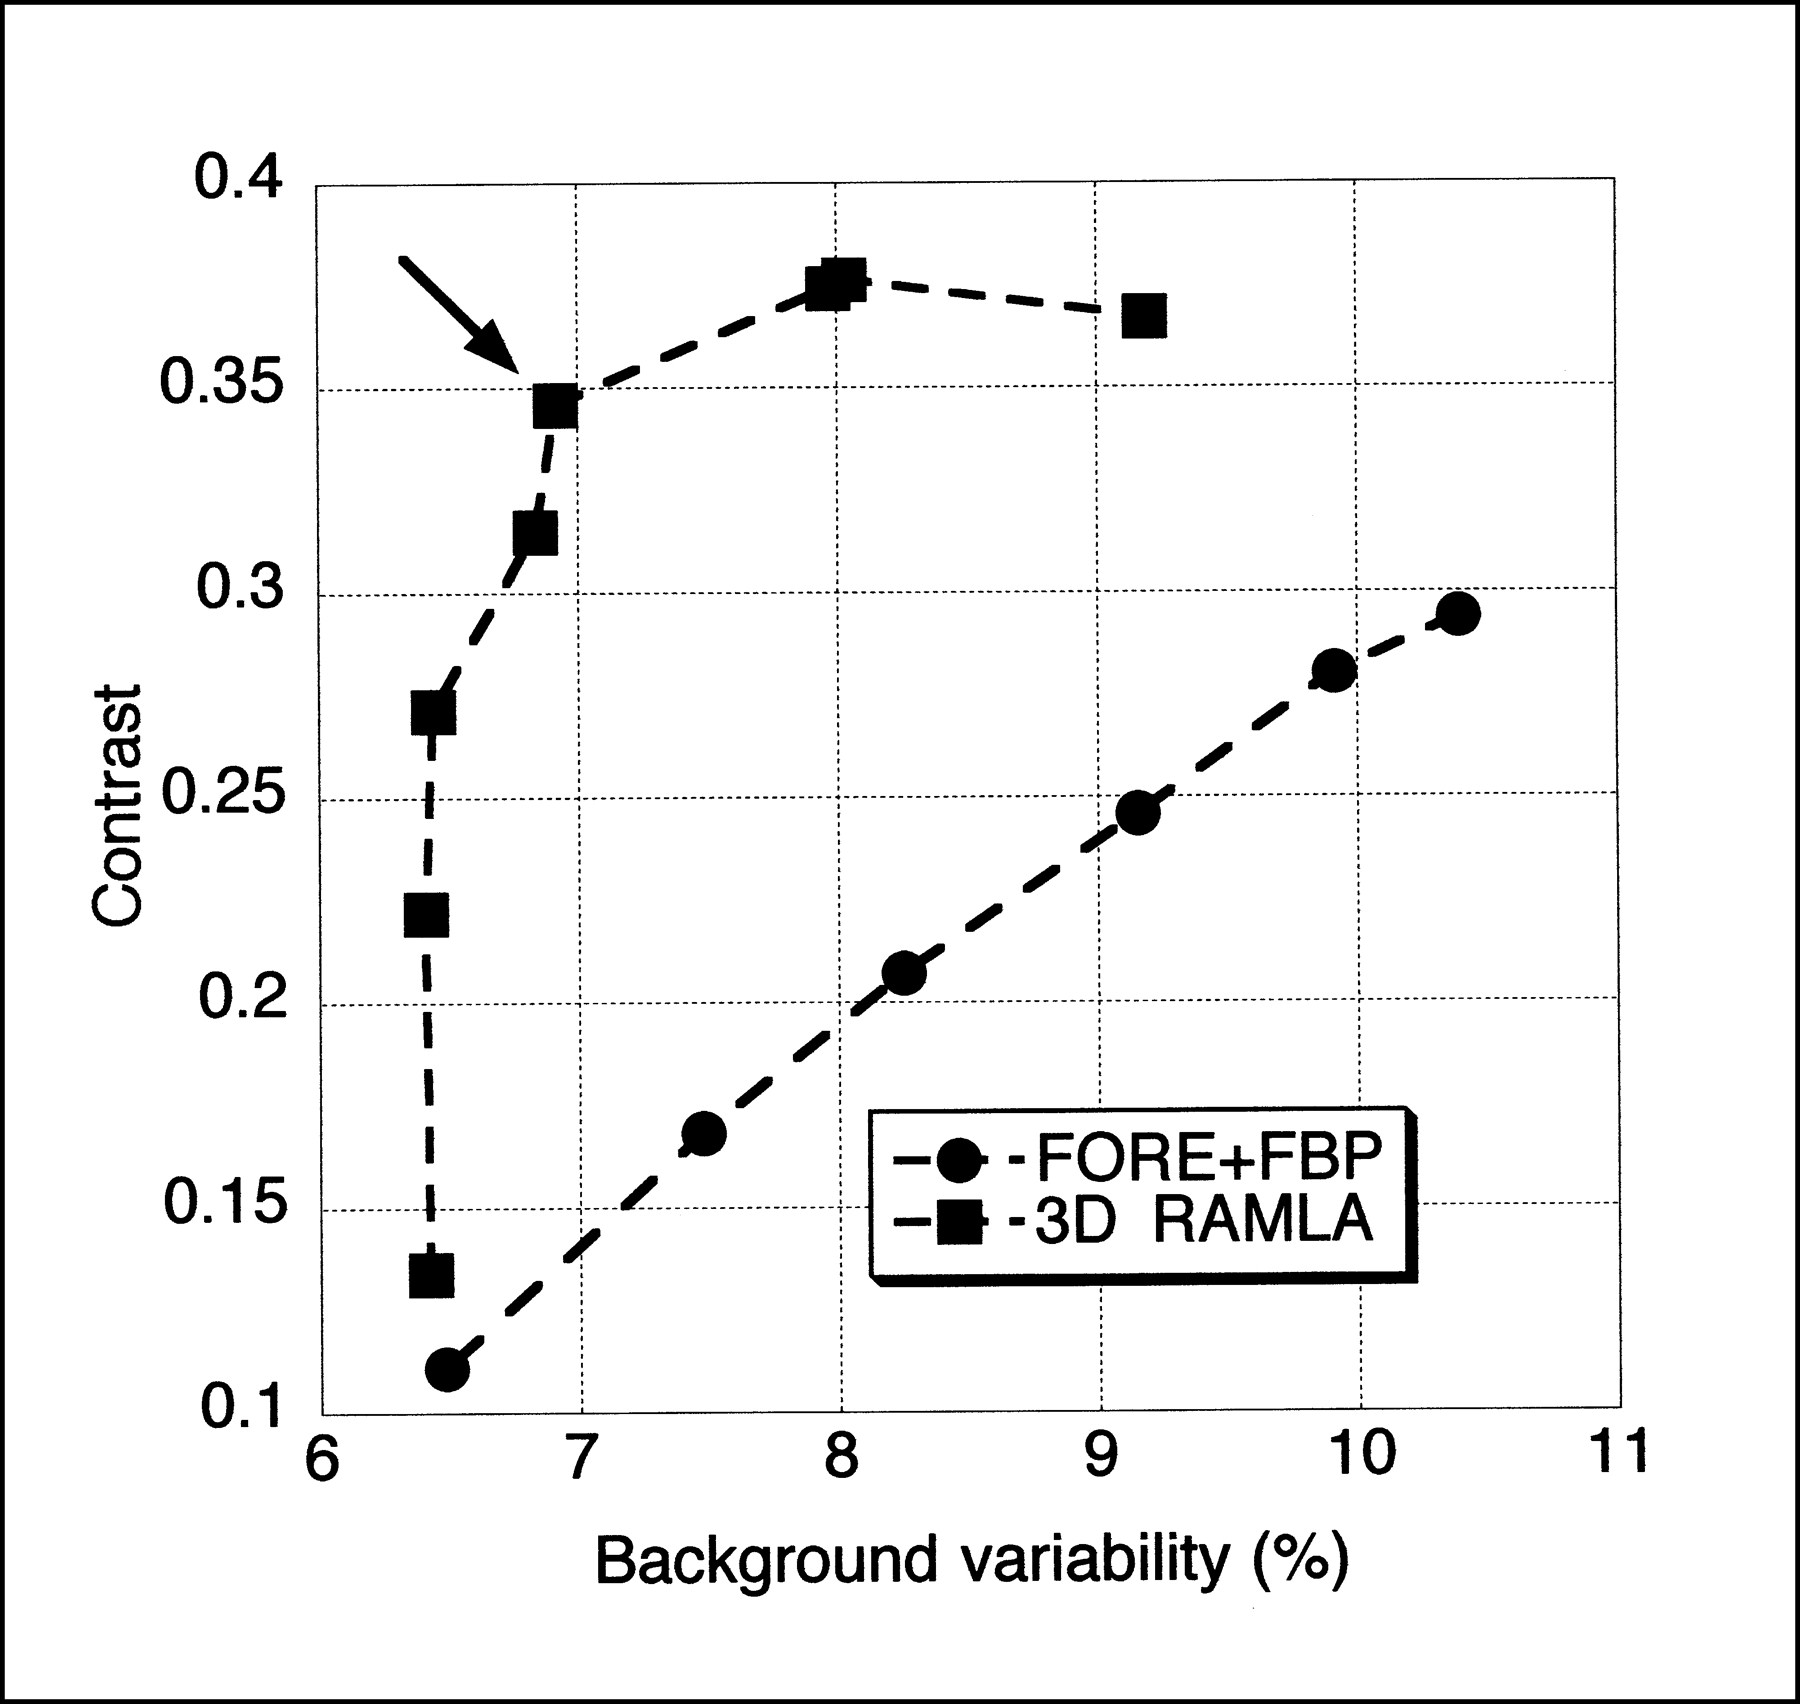
Effect of reconstruction algorithm on image quality results taken on ADAC UGM C-PET scanner. Results for 1.7-cm hot sphere are shown for FBP for Hanning filters with cutoff frequencies ranging between 2 and 0.33 times Nyquist frequency as well as for ramp filter with cutoff at Nyquist frequency and 3D RAMLA for range of reconstruction parameters (number of iterations and relaxation parameter). Arrow shows results for parameters used in clinical studies. FORE = Fourier rebinning.
It should be noted that the background variability parameter is a measure of not only statistical noise but also nonuniformity in the image (e.g., from inaccurate attenuation correction or poor convergence during iterative reconstruction). In addition, the background variability does not reflect noise correlations or streak artifacts in the image. It is important that the images specified by the standard also be examined visually.
Because of variations in the uptake of radiopharmaceuticals and in patient sizes and shapes, it is difficult to simulate clinical imaging conditions using a single phantom. For that reason, the results of the image quality measurement should be interpreted with caution. For example, as has been noted (11), the walls of the hot spheres add a cold rim around the hot region that can decrease the measured hot sphere contrast.
The image quality measurement is intended to emulate whole-body imaging and, as such, would be less relevant for a scanner that is used primarily or exclusively for brain imaging. An alternative test for such a scanner, particularly one with a patient aperture smaller than 35 cm, would be to use the same hot and cold spheres in a 20-cm-diameter cylinder.
General Comments
For all measurements described except spatial resolution and image quality, a 70-cm long line source is used as part of the activity distribution. Another option would have been to tailor the length of the phantom to the axial FOV of the scanner. However, it was decided that a standard length was preferable because it permits the use of a single phantom on all scanners. In addition, the longer phantom provides a more clinically reasonable distribution of activity outside the scanner. This OFA can impact many of the performance measurements, especially scatter and counting rate performance.
Although the revised standard attempts to reflect PET scanner performance under conditions of whole-body FDG scanning, it is very difficult to mimic a clinical scanning situation with phantoms. The new standard does ensure that different scanners can be compared with each other. The relative results between scanners can be expected to hold for clinical situations as well. However, for all measurements, the results should be interpreted with caution. For example, the spatial resolution results may not reflect the clinical resolution achievable in patient images. As another example, the intrinsic scatter fraction measured with a 20-cm-diameter object will be lower than the scatter fraction seen in a body. Third, the counting rate performance measurement better predicts the trues and NEC rates for thin patients. Finally, the results of the image quality performance test depend on the reconstruction algorithm, as has been demonstrated, as well as the various corrections applied to the data. It is, therefore, not a static property of the scanner but, rather, a characteristic that can change when improved algorithms are implemented by the manufacturer. The measurements reflect the performance of a scanner under specific imaging conditions that may or may not reflect the actual imaging situation of a patient study.
CONCLUSION
The changes from the NU 2-1994 standard to the NU 2-2001 standard, especially the use of a longer test phantom and the inclusion of an image quality test, strive toward establishing relevance with clinical studies. This philosophy represents a shift from the NU 2-1994 standard, which tried to make the measurements as basic as possible. The tests in the updated standard also are, in general, simpler and less time-consuming to perform than those in the NU 2-1994 standard, even as they are applicable to a wider variety of PET scanner designs. However, the measurements should still provide adequate information with respect to scanner performance for a manufacturer or user to assess performance and to compare all clinically relevant aspects of performance between systems. It is hoped that this revised set of measurements finds acceptance by the PET community and proves useful for evaluation and understanding of the performance of PET systems.
Acknowledgments
The authors thank Richard Eaton from NEMA, who organized and coordinated the NEMA meetings. The authors also acknowledge the contributions of Naor Wainer, Phil Vernon, Trudy Rempel, and Johann Fernando to the development of the NEMA NU 2-2001 standard. The first eight authors are members of the NEMA Coincidence Imaging Task Group. This work was supported in part by Department of Energy grant DE-FG02-88ER60642, an ADAC ACRP award, and a Triumf Life Science grant.
Footnotes
Received Dec. 31, 2001; revision accepted Jun. 11, 2002.
For correspondence or reprints contact: Margaret E. Daube-Witherspoon, PhD, 11316 Smoke Rise Ct., Fairfax Station, VA 22039.
E-mail: daubew{at}bellatlantic.net
In this issue


Jump to section
Related Articles
Cited By...
- Impact of 68Ga-PSMA PET/CT on the Radiotherapeutic Approach to Prostate Cancer in Comparison to CT: A Retrospective Analysis
- Simulation of Tracer Dose Reduction in 18F-FDG PET/MRI: Effects on Oncologic Reading, Image Quality, and Artifacts
- Estrogen Receptor Binding (18F-FES PET) and Glycolytic Activity (18F-FDG PET) Predict Progression-Free Survival on Endocrine Therapy in Patients with ER+ Breast Cancer
- A New PET Scanner with Semiconductor Detectors Enables Better Identification of Intratumoral Inhomogeneity
- Benefit of Time-of-Flight in PET: Experimental and Clinical Results
- Impact of Acquisition Geometry, Image Processing, and Patient Size on Lesion Detection in Whole-Body 18F-FDG PET
- Imaging of Weak-Source Distributions in LSO-Based Small-Animal PET Scanners
- Performance Measurement of the microPET Focus 120 Scanner
- Optimizing Injected Dose in Clinical PET by Accurately Modeling the Counting-Rate Response Functions Specific to Individual Patient Scans
- Imaging Characteristics of a 3-Dimensional GSO Whole-Body PET Camera
- NEMA NU 2 Performance Tests for Scanners with Intrinsic Radioactivity
- PET Performance Measurements for an LSO-Based Combined PET/CT Scanner Using the National Electrical Manufacturers Association NU 2-2001 Standard
- Performance of a Brain PET Camera Based on Anger-Logic Gadolinium Oxyorthosilicate Detectors