


Abstract
Hexamethylpropyleneamine oxime (HMPAO) SPECT and 18F-FDG PET depict similar aspects of perfusion and metabolic abnormalities in Alzheimer’s disease (AD), but the correspondence between them is not known in detail. We therefore used statistical parametric mapping to detect and compare abnormal brain areas objectively and quantitatively. Methods: Twenty-six patients with probable AD (mean age ± SD, 66 ± 9 y; mean Mini-Mental State Examination score, 22.5 ± 4.2) and 6 nondemented healthy volunteers (mean age, 63 ± 11 y) were studied with HMPAO SPECT and 18F-FDG PET. All images underwent the same processing steps, including 12-mm gaussian smoothing, spatial normalization, and z transformation with respect to normal average and SD. Thresholding of z maps was used to detect abnormal voxels. Results: The overall correlation between PET and SPECT across the entire brain was significant but not close (average r = 0.43). The best correspondence was found in the temporoparietal and posterior cingulate association cortices. There, the number of abnormal voxels for PET correlated strongly with the number for SPECT (r = 0.90 at a z threshold of −2.25), but tracer uptake reductions were significantly more pronounced for PET than for SPECT. Discordant findings were most frequently seen in the temporobasal and orbitofrontal areas (PET low, SPECT high) and in the cerebellum, parahippocampal cortex, and midcingulate cortex (PET high, SPECT low). The correlation between dementia severity and the number of abnormal voxels was closer for PET than for SPECT. Separation of patients from healthy volunteers by counting the number of abnormal voxels was possible over a much wider range of z thresholds with PET than with SPECT. Conclusion: Correspondence between 18F-FDG PET and HMPAO SPECT is limited to the main finding of temporoparietal and posterior cingulate functional impairment in mild to moderate AD. The distinction between healthy volunteers and patients is less sensitive to threshold selection with PET than with SPECT, and findings in the frontal, temporobasal, and temporomesial cortices and in the cerebellum may differ between the 2 techniques.
Impairment of the cerebral metabolic rate of glucose (CMRglu) in the temporoparietal association cortex is typical of Alzheimer’s disease (AD) and can be shown with 18F-FDG PET (1,2). This PET finding is closely related to a similar finding with SPECT after injection of cerebral perfusion tracers (3,4). SPECT, because of its lower cost, is often preferred for clinical purposes despite studies indicating that PET better detects abnormalities in other association areas (5) and better differentiates AD from vascular dementia (6).
In recent years, new techniques have been developed to analyze PET and SPECT images by a voxelwise comparison with a reference in stereotactic space (7,8). These techniques permit a more detailed comparison of PET and SPECT and their findings in AD than was possible in previous studies (5,6,9), which evaluated regions of interest. Voxel-based techniques have been used in various studies with PET (10) and SPECT (11–13) used separately. We directly compared both techniques in healthy volunteers and AD patients.
MATERIALS AND METHODS
Twenty-six patients (17 men, 9 women; mean age, 66 ± 9 y) and 6 healthy volunteers (2 men, 4 women; mean age, 63 ± 11 y) were studied. The patients had a clinical diagnosis of probable AD according to the criteria of the National Institute of Neurological and Communicative Disorders and Stroke and of the Alzheimer’s Disease and Related Disorders Association (14). Written informed consent was obtained from all subjects. The diagnosis was based on a clinical and neuropsychologic examination, including the Mini-Mental State Examination (MMSE) (15), the Buschke Selective Reminding Test (16), and the Hamilton Depression Rating Scale (17). The mean MMSE score in patients was 22.5 ± 4.2. We did not include subjects with a history of organic brain diseases, head injury with loss of consciousness, metabolic or systemic diseases, or drug or alcohol dependence. On patients, we also performed CT or MRI to exclude structural brain lesions (in particular, brain infarcts, hematomas, tumors, and hydrocephalus) and laboratory tests (blood cell counts, vitamin B12, folate, sodium, potassium, urea, creatinine, glucose, bilirubin, liver enzymes, calcium, thyroid-stimulating hormone, free thyroxine, and VDRL) to exclude relevant metabolic disorders. The ischemic score (18) had to be ≤4 (median was 1). The healthy volunteers had normal results from neurologic and psychiatric examinations and from neuropsychologic testing.
All subjects underwent hexamethylpropyleneamine oxime (HMPAO) SPECT and an 18F-FDG PET study while resting in a quiet room with their eyes closed. SPECT was performed on a PRISM 3000 camera (Marconi Medical Systems, Cleveland, OH) with 3 rotating heads. The acquisition began 60 min after intravenous injection of 740 MBq 99mTc-HMPAO, and the acquisition parameters were 120 projections; a 128 × 128 matrix; 5 × 7 = 35 s per view, resulting in a total acquisition time of approximately 23 min; and converging collimators with focal length of 65 cm. Reconstruction used ramp-filtered backprojection and subsequent 3-dimensional low-pass postfiltering (order, 6; cutoff, 0.27 pixel−1), yielding a reconstructed pixel size of 2.5 mm within the transverse plane and a slice thickness of 3.6 mm. The resulting spatial resolution within the transverse plane and along the axis of rotation was approximately 10 mm in full width at half maximum. Attenuation was corrected by a first-order Chang algorithm with automatic fitting of individual ellipses to the transverse planes and an attenuation coefficient of 0.11 cm−1. No scatter compensation was available on the SPECT system.
PET was performed on an ECAT HR scanner (CTI, Knoxville, TN/Siemens Medical Systems, Inc., Hoffman Estates, IL) (47 transaxial slices 3.125 mm thick) after intravenous injection of 370 MBq 18F-FDG. Cerebral tracer distribution was recorded in 3-dimensional mode from 20 to 60 min after injection. Images were reconstructed using a ramp filter including correction for scatter and measured attenuation, yielding a spatial resolution of approximately 4 mm (19). The average interval between PET and SPECT was 8.5 d (median, 2 d; maximum, 53 d).
SPECT and PET images underwent the same processing steps based on volume data with a voxel size of 2 × 2 × 2 mm. Intensity was scaled to adjust the global average of each image to a common constant value. The images were smoothed (gaussian filter width, 12 mm) and normalized using affine transformations onto a standard brain template to make individual scans comparable (SPM96; Wellcome Department of Cognitive Neurology, London, U.K.). The PET template provided by the SPM96 package was used for both PET and SPECT. Interactive Data Language (Research Systems Inc., Boulder, CO) matrix processing routines were used to determine average values and SDs for each brain voxel of the healthy volunteers and for each technique. A volume of interest that enclosed the whole brain and comprised 266,168 voxels for quantitative evaluation was determined by thresholding the normal PET–SPECT summed image at 40% of the maximum value. Then, a z transformation was applied to all images based on the average variance across all voxels in healthy volunteers (z = [measured value − normal average]/pooled SD). Abnormal voxels were detected by z thresholding.
First, the correlation between PET and SPECT z maps was calculated for all patients to determine the correspondence of PET and SPECT findings. We then checked whether correspondence was better in some brain areas than in others by comparing PET and SPECT z values for all voxels of each patient to create 4 maps: voxels with corresponding values greater than average (z > 0 in PET and SPECT); voxels with corresponding values less than average (z < 0 in PET and SPECT); voxels with discordant values of type PET high, SPECT low (z > 0 in PET, z < 0 in SPECT); and voxels with discordant values of type PET low, SPECT high (z < 0 in PET, z > 0 in SPECT). In each of these maps, absolute values of the product of PET and SPECT z values were entered and summed across all patients.
On the PET and SPECT z maps, the number and spatial correspondence of abnormal voxels (with reduced signal) were determined for thresholds ranging from −5 to 0 (by steps of 0.25). The correlation between parameters derived from z maps and MMSE was calculated as a measure of dementia severity. The SAS software package (SAS Institute, Cary, NC) was used for statistical analysis.
RESULTS
As a quantitative measure of the similarity between PET and SPECT, the Pearson correlation coefficient between PET and SPECT z maps was calculated for each patient. The coefficient was significant for each patient, and the average value of these coefficients across all patients was 0.43. The correlation tended to be closer in severe dementia than in mild dementia (Fig. 1). Thus, the correspondence between the PET and SPECT AD findings that had been noted before in qualitative terms was confirmed but in mild cases was less obvious, probably because of the competing influence of other technical and physiologic variables and the variability of the resting state at the 2 measurement occasions. The correspondence between PET and SPECT was not improved by additional spatial filtering of either PET or SPECT or of both.

Scatterplot and regression line of correlation coefficients (R) between individual PET and SPECT z maps on dementia severity (MMSE). Correspondence between PET and SPECT tended to be closer in patients with more severe dementia (1 extreme additional point at MMSE = 11, r = 0.75, not included in plot; the 2 boxed points represent 2 cases each). Regression was significant (Pearson coefficient for correlation between imagewise correlation coefficients and MMSE = −0.57, r2 = 0.33, P = 0.002; corresponding Spearman rank correlation coefficient = −0.50, P = 0.01).
Correspondence between PET and SPECT was closest in areas known to be affected in most AD patients: the temporolateral, parietal, and posterior cingulate cortices (Fig. 2). Some correspondence of signal reduction was also noted in the periventricular parts of the caudate nuclei and thalamus and may have been caused by enlargement of the ventricles in AD. The volume of best correspondence (VBC) between PET and SPECT signals was defined as all voxels with an average PET–SPECT z product of ≥1 (Fig. 2). The VBC comprised 23,207 voxels (186 cm3). z scores in VBC were significantly lower with PET (−1.52 ± 0.68) than with SPECT (−1.23 ± 0.57; difference from PET, 0.29 ± 0.37, P = 0.0005, paired t test).
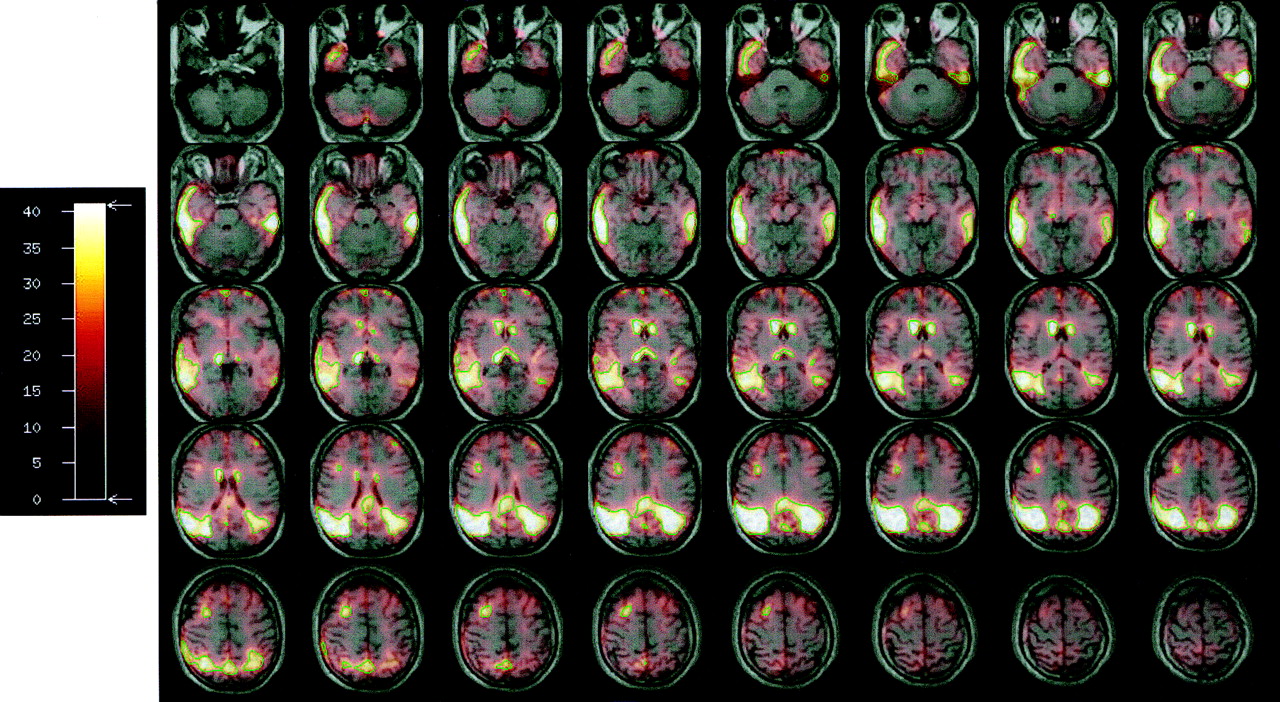
Regional distribution of correspondence between PET and SPECT z maps. Product of PET and SPECT z scores (with both scores negative) was summed over all patients and displayed as fusion image with standard MR image for anatomic orientation. Green line delineates volume of best correspondence (VBC), defined as average z product of ≥1. Numbers on scale represent square roots of product of PET and SPECT z scores (with both scores negative) summed over all patients.
Only a few voxels, located mainly in the cerebellum, particularly the cerebellar vermis, showed correspondingly higher z values in AD patients than in healthy volunteers. Systematic discordant findings were seen in a few voxels, often adjacent to extracerebral space. Low SPECT signal but increased PET signal was seen in the left cerebellum, right occipital pole, and left parahippocampus. The opposite, low PET signal but increased SPECT signal, was seen in the frontobasal and temporobasal regions. By visual inspection, most scans showed a reasonable correspondence between PET and SPECT (Fig. 3A), but in some cases distinct discordance of findings was apparent (Fig. 3B).
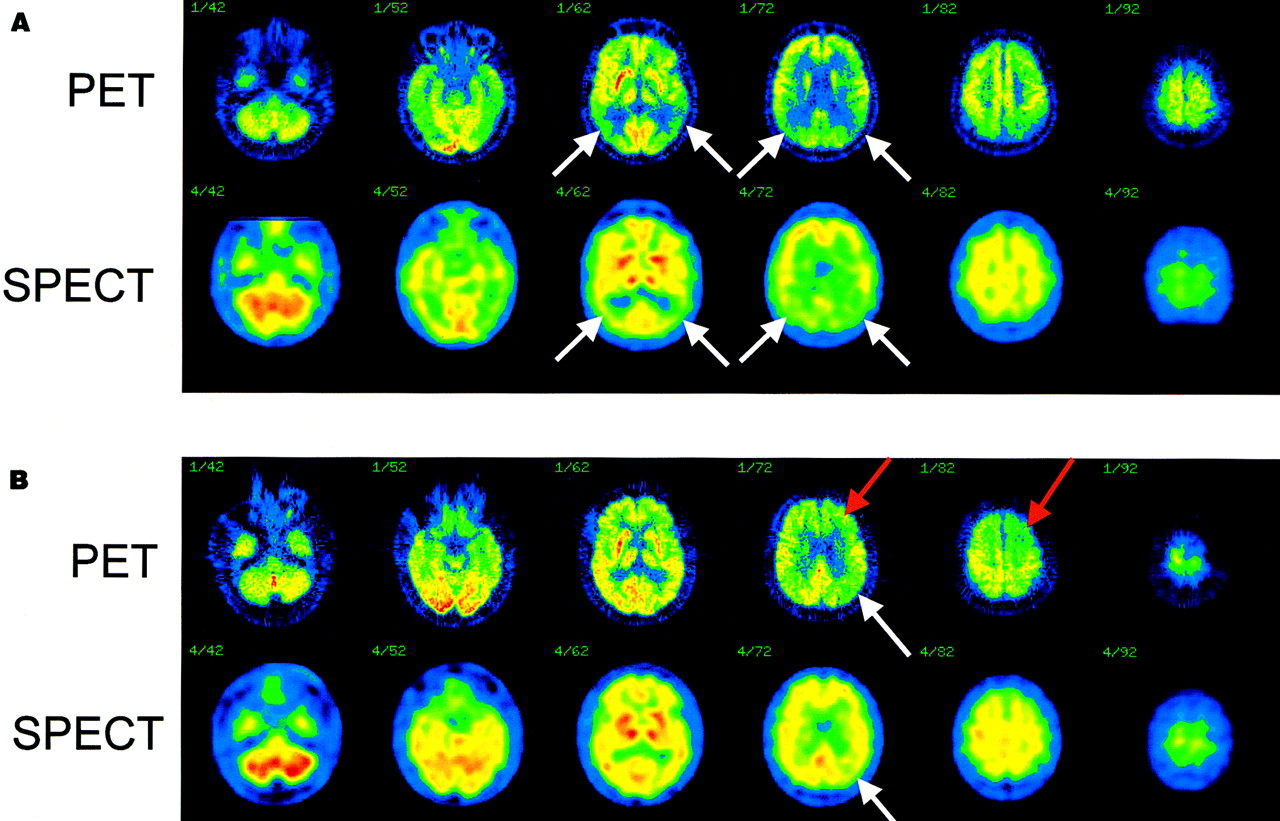
(A) Good correspondence between PET and SPECT is shown by spatially normalized original images of AD patient (MMSE score = 19, r of z maps = 0.62), particularly with respect to reduced uptake in temporoparietal association cortex (white arrows). (B) Discordance is found in another patient (MMSE score = 21, r = 0.35), with impaired frontal uptake for PET (red arrows) but not for SPECT.
To compare the ability of PET and SPECT to detect abnormal brain function in patients, we evaluated the number of abnormal voxels. The z threshold below which a voxel was defined as abnormal was varied from 0 to −5. Generally, the number of abnormal voxels correlated strongly between PET and SPECT, with a maximum correlation coefficient of 0.88 in the brain (Fig. 4) and 0.90 in the VBC at z = −2.25. In general, the number of abnormal voxels in the brain was also significantly related to MMSE (maximum for PET: r = −0.78 at z = −3.50; maximum for SPECT: r = −0.60 at z = −3.00). Within the VBC, the correlation between the number of abnormal voxels and MMSE was weaker than in the whole brain (maximum for PET: r = −0.66 at z = −3.75; maximum for SPECT: r = −0.47 at z = −3.00).
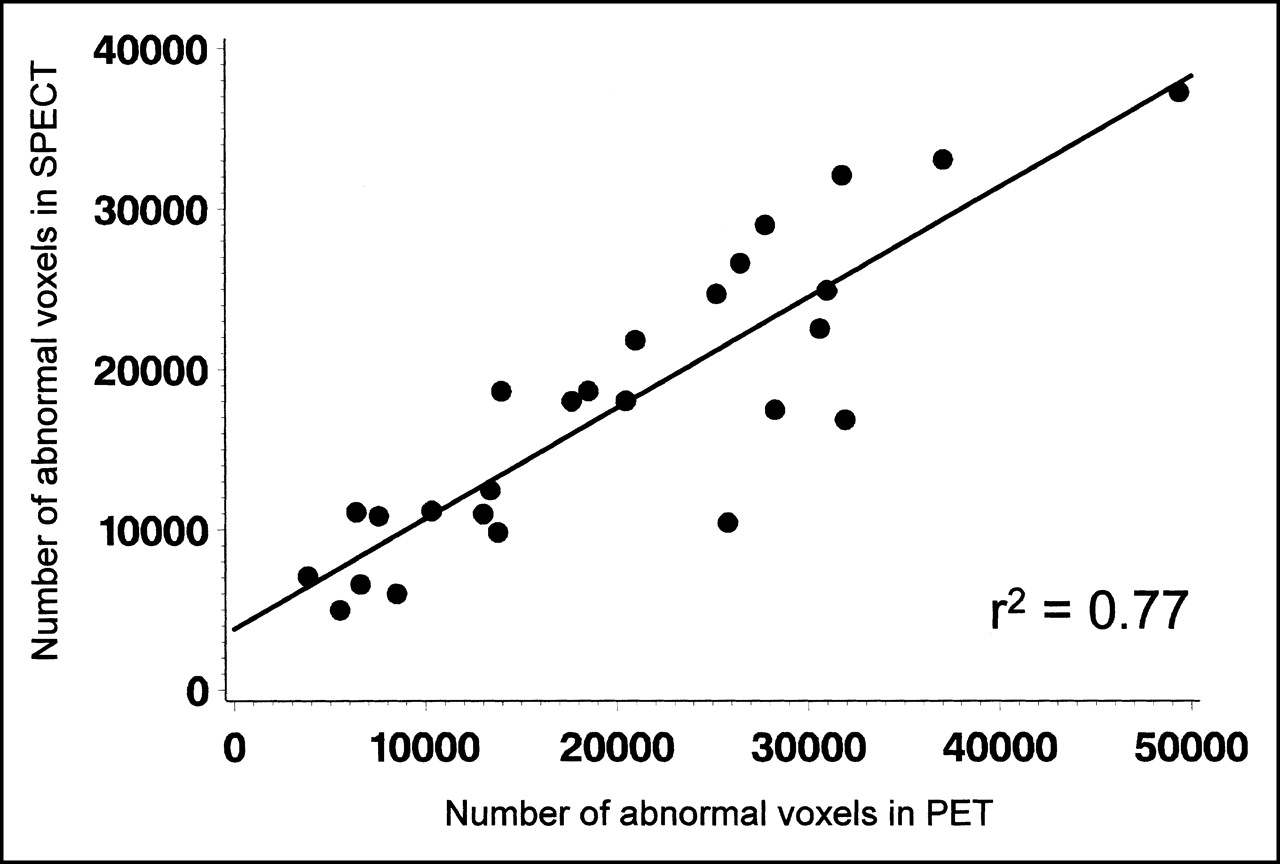
Scatterplot and regression line of number of abnormal voxels for SPECT versus PET at z threshold of −2.25.
To determine the degree to which the 2 methods could separate patients from healthy volunteers, we compared the number of abnormal voxels in each patient with the range of that number in healthy volunteers. The number of abnormal PET voxels in the VBC was greater in all patients than in healthy volunteers for z thresholds ranging from −3.5 to −1.5 (Fig. 5). Thus, complete separation was achieved for this range of thresholds. Complete separation was also achieved by counts of abnormal SPECT voxels in the whole brain, but only at a more narrow range of z thresholds—from −3.0 to −2.75. Counts of abnormal PET voxels in the whole brain and of abnormal SPECT voxels in the VBC did not achieve complete separation. The distinction between patients and healthy volunteers was relatively stable with PET over the whole range of tested z thresholds, whereas SPECT thresholds > −2.0 were associated with a steep decline of discriminatory power. The decline of discrimination at extreme thresholds—those approaching −5.0—with all techniques was caused by the absence of any abnormal voxels in some patients.
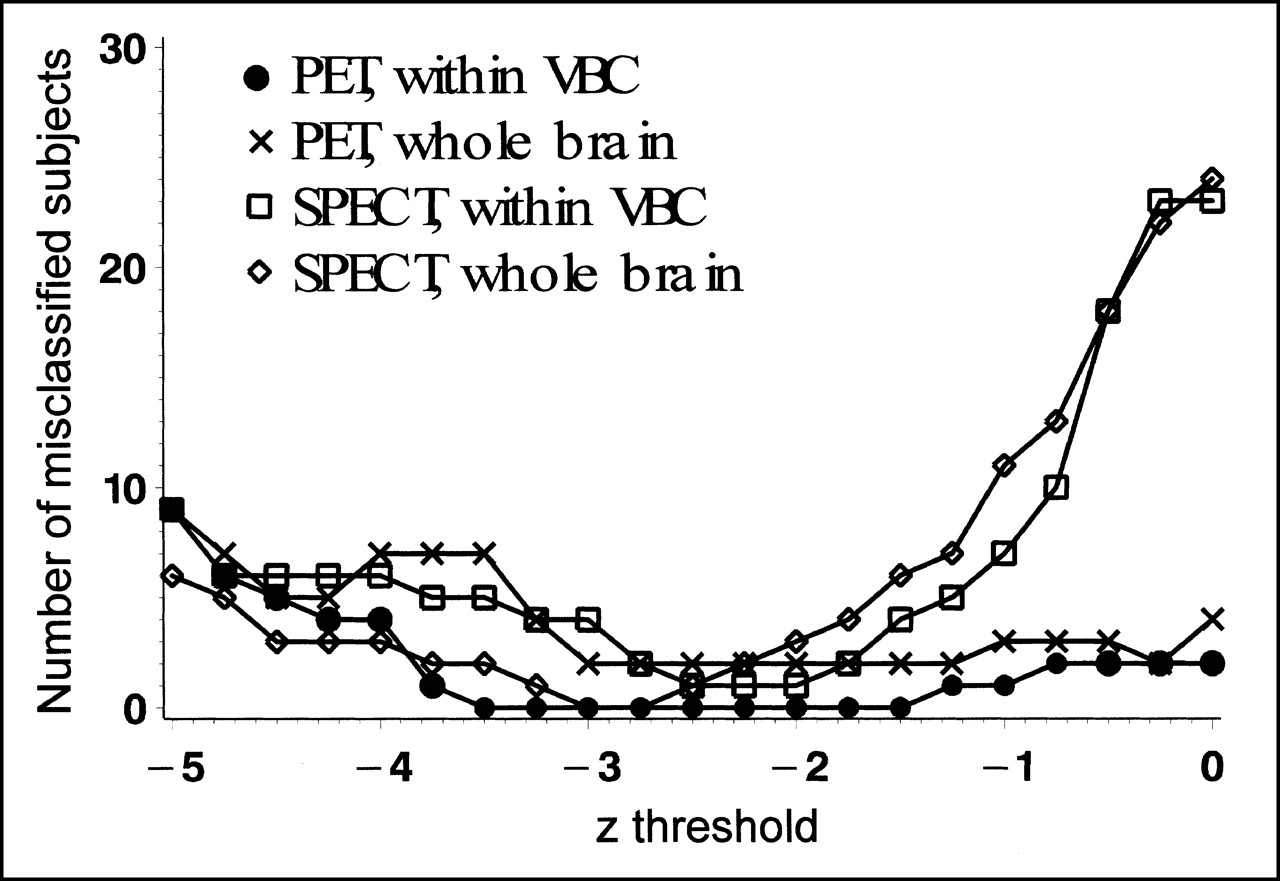
Number of misclassified subjects for PET and SPECT as determined using selected z threshold to identify abnormal voxels. Number of abnormal PET voxels within VBC completely separated AD patients from healthy volunteers for all z thresholds between −1.5 and −3.5, whereas separation was less complete for other techniques.
DISCUSSION
This study indicates that separation of AD patients from healthy volunteers is more robust with PET than with SPECT and depends less on the selection of a specific threshold. This finding corresponds to the qualitative impression that PET images usually delineate abnormalities more distinctly than do SPECT images (Fig. 3) and that PET images have significantly lower z scores within the VBC. A better separation of abnormal metabolism from the normal range with PET has also been observed in previous studies (5,9). The sample of healthy volunteers in this study was too small to provide an estimate of the diagnostic accuracy (sensitivity and specificity) of the 2 techniques. The complete separation of patients from healthy volunteers that was achieved in our sample is compatible with the 90%–97% accuracy shown previously for larger samples in PET studies (20,21). Yet for SPECT, the separation was achieved for only a very narrow set of analysis parameters (abnormal voxels in the whole brain at z scores ranging from only −3.0 to −2.75), whereas for PET, the separation was more robust. Thus, the low impact on clinical diagnosis that was found in a previous SPECT study (22) may have been caused partially by a less reliable identification of changes typical of AD than is possible with 18F-FDG PET. For PET, high diagnostic accuracy has been shown even in multicenter studies (20) and in patients with pathologically verified dementia (23).
Best correspondence in patients was in the temporoparietal and posterior cingulate areas, which are typically impaired even in mild AD (13,24). Other brain areas, particularly the frontal cortex and the cerebellum, showed more variability. Some brain areas (in particular, the cerebellum and orbitofrontal cortex) for which PET and SPECT differed were in the base of the brain close to the scull base, and the differences between PET and SPECT could therefore reflect differences in attenuation and scatter correction. Apparently, most of the variability was not related to differences in image resolution, because additional filtering of PET (or of SPECT) did not improve correspondence. Brain atrophy, which is common in AD, leads to partial-volume effects and incomplete quantitative recovery that depends on scanner resolution. Thus, the interaction between atrophy and resolution could well contribute to some of the differences observed between PET and SPECT. Some systematic differences exist between PET and SPECT images; in particular, tracer uptake in the cerebellum is higher with SPECT (9,25). Such differences should not have affected the current analysis because it was based on normalized differences (z values) between individual subjects and mean values for normal voxels determined separately for PET and SPECT.
This study illustrates a problem with interpretation of statistical parametric maps with respect to abnormality location. Our findings indicate low spatial correspondence on a voxel level between 2 independent measurements in the same subjects. The overall correlation coefficient was only 0.43, corresponding to an 18.5% common covariance between PET and SPECT z maps, leaving most of the variance unexplained by common disease-related findings. However, the correlation between the number of abnormal voxels in larger VBCs and in the whole brain was much better (0.90 and 0.88, respectively), illustrating the clinical wisdom that spurious findings in small areas should usually be ignored.
Limited overall correspondence between PET and SPECT may also be caused by differences in the physiologic parameters that the 2 techniques assess. 18F-FDG uptake is closely related to CMRglu (26), whereas uptake in HMPAO SPECT is related to CBF but also includes a metabolic component that is required for tracer trapping (27,28). Underestimation of CBF by backdiffusion of HMPAO before metabolic trapping, especially in high-flow areas, has been noted (29) but is unlikely to cause problems in the low-flow areas typical of AD. In the temporoparietal and posterior cingulate cortices, PET and SPECT results were similar, indicating that microvascular blood flow may be downregulated in these areas with impaired glucose metabolism or may be disturbed because of ultrastructural vascular changes (30). The frontal brain showed more discrepancies—in 1 patient (Fig. 3B), to the degree that severe and extended left frontal metabolic impairment detected by PET had no SPECT correlate. Fukuyama et al. (31) did not see such differences. In comparing cerebral blood flow and CMRglu, both measured with PET, they found similar reductions in the frontal, temporal, and parietal cortices. Some of the differences observed in our study were therefore probably not caused by a mismatch of cerebral blood flow and CMRglu alterations in AD but by other differences between the PET and SPECT techniques. Some differences that may be caused by special metabolic properties of HMPAO were also noted in a comparison of PET and SPECT cerebral blood flow measurements in patients with cerebrovascular disease (25). In addition, a study found that PET was more sensitive than SPECT in detecting frontal abnormalities (5). Differences in the functional state during the examination are unlikely to account for missed detection of frontal abnormalities with SPECT, because in a functionally activated state, metabolic deficits in AD usually appear even more pronounced relative to normal tissue (32). Thus, the pathophysiologic reasons for these observations, and the consequences for diagnostic use of PET and SPECT in frontotemporal dementia, remain to be determined.
CONCLUSION
18F-FDG PET and HMPAO SPECT provide comparable results for the main finding of temporoparietal and posterior cingulate functional impairment in mild to moderate AD. Yet the distinction between healthy volunteers and patients is more robust and much less sensitive to threshold selection with PET than with SPECT, and findings in the frontal, temporobasal, and temporomesial cortices and in the cerebellum may differ between the 2 techniques.
Acknowledgments
This study was supported by Reinforced Concerted Action BMH4-98-3130 of the fourth framework of the European Commission.
Footnotes
Received Mar. 19, 2001; revision accepted Sep. 21, 2001.
For correspondence or reprints contact: Karl Herholz, MD, Max-Planck-Institut für neurologische Forschung, Gleueler Strasse 50, 50931 Köln, Germany.
E-mail: karl.herholz{at}pet.mpin-koeln.mpg.de
REFERENCES
In this issue


Jump to section
Related Articles
Cited By...
- Comparison of Early-Phase 11C-Deuterium-L-Deprenyl and 11C-Pittsburgh Compound B PET for Assessing Brain Perfusion in Alzheimer Disease
- 18F-FDG PET and Perfusion SPECT in the Diagnosis of Alzheimer and Lewy Body Dementias
- Clinical Application of 3D Arterial Spin-Labeled Brain Perfusion Imaging for Alzheimer Disease: Comparison with Brain Perfusion SPECT
- Effectiveness and Safety of 18F-FDG PET in the Evaluation of Dementia: A Review of the Recent Literature
- SPECT imaging in dementia
- Positron emission tomography imaging in dementia
- Role of Neuroimaging in Alzheimer's Disease, with Emphasis on Brain Perfusion SPECT
- Brain 18F-FDG PET in the Diagnosis of Neurodegenerative Dementias: Comparison with Perfusion SPECT and with Clinical Evaluations Lacking Nuclear Imaging
- Statistical Image Analysis of Cerebral Blood Flow in Vascular Dementia with Small-Vessel Disease