


Abstract
Brain imaging with glucose (18F-FDG) PET or blood flow (hexamethylpropyleneamine oxime) SPECT is widely used for the differential diagnosis of dementia, though direct comparisons to clearly establish superiority of one method have not been undertaken. Methods: Subjects with Alzheimer disease (AD; n = 38) and dementia with Lewy bodies (DLB; n = 30) and controls (n = 30) underwent 18F-FDG PET and SPECT in balanced order. The main outcome measure was area under the curve (AUC) of receiver-operating-characteristic analysis of visual scan rating. Results: Consensus diagnosis with 18F-FDG PET was superior to SPECT for both dementia vs. no-dementia (AUC = 0.93 vs. 0.72, P = 0.001) and AD vs. DLB (AUC = 0.80 vs. 0.58, P = 0.005) comparisons. The sensitivity and specificity for dementia/no-dementia was 85% and 90%, respectively, for 18F-FDG PET and 71% and 70%, respectively, for SPECT. Conclusion: 18F-FDG PET was significantly superior to blood flow SPECT. We recommend 18F-FDG PET be performed instead of perfusion SPECT for the differential diagnosis of degenerative dementia if functional imaging is indicated.
Increasingly, dementia is an international governmental priority, with early and accurate assessment and diagnosis placed at the heart of effective management pathways. The 2 main causes of degenerative dementia in older people are Alzheimer disease (AD), responsible for about 65% of all cases, and dementia with Lewy bodies (DLB), responsible for 10%–15% of cases. Most international guidelines for the assessment and diagnosis of dementia advocate the use of structural imaging, to exclude other intracerebral pathologies and determine the extent of regional brain atrophy (1–3). Functional imaging methods such as 18F-FDG PET and perfusion (hexamethylpropyleneamine oxime [HMPAO]) SPECT are advocated as useful to clarify diagnosis when doubt remains. Although specific imaging ligands for amyloid are becoming available (4), the mainstay of functional brain imaging for the differential diagnosis of dementia will remain 18F-FDG PET and blood flow SPECT for the foreseeable future.
Abnormalities on 18F-FDG PET and perfusion SPECT in AD are broadly similar with hypometabolism (for 18F-FDG PET) and hypoperfusion (for SPECT) commonly affecting temporoparietal areas in a bilateral distribution, with the posterior cingulate and medial temporal areas particularly affected in AD and sensory motor cortices, including the cerebellum, largely spared (5,6). Changes in DLB overlap with the changes in AD, though more profound parietooccipital hypometabolism and hypoperfusion is seen in DLB (5,7).
SPECT and 18F-FDG PET differ in the equipment needed, image characteristics, availability, and patient experience. 18F-FDG PET allows brain metabolism to be directly assessed and offers spatial resolution superior to SPECT (∼5 vs.10 mm). HMPAO SPECT measures brain perfusion captured around the time of injection and so represents a slightly indirect measure of metabolism. Despite the widespread clinical availability of both perfusion SPECT and 18F-FDG PET, there remains uncertainty regarding their relative diagnostic accuracy in a clinical setting. Studies of the accuracy of SPECT for diagnosing AD report sensitivities of 65%–85% and specificities (for other dementias) of 72%–87% (8). Studies for 18F-FDG PET generally report higher accuracy, with sensitivities of 75%–99% for AD and specificities of 71%–93% (9). However, there have been few direct head-to-head comparisons, limited by small sample sizes and showing mixed results (10). For example, although some studies have suggested slight superiority of 18F-FDG PET for diagnostic accuracy, in the largest study to date, both HMPAO SPECT and 18F-FDG PET were able to completely separate all 26 AD cases from controls (11). There has been 1 small direct comparison study in DLB, finding that deficits on 18F-FDG PET were greater than SPECT, though diagnostic accuracy was similar (12). This uncertainty over the relative merits of 18F-FDG PET and HMPAO SPECT is reflected in guidelines for the use of imaging in the United Kingdom (2) and from the European Federation of Neurologic Societies (1), which advocate use of SPECT or 18F-FDG PET and consider both diagnostically equivalent. Recently proposed diagnostic criteria for AD incorporate the use of biomarkers associated with neurodegeneration (1). In formulating these criteria there has been debate as to whether perfusion SPECT is as acceptable a biomarker as 18F-FDG PET (13,14).
Because of the increasing use of brain imaging investigations in dementia with continuing uncertainty over the comparability of 18F-FDG PET and SPECT for diagnosis, we sought to undertake a direct comparative study of the utility of perfusion (HMPAO) SPECT and 18F-FDG PET for the differential diagnosis of degenerative dementia (AD and DLB) from similarly aged healthy controls and also the subtype differentiation of AD from DLB.
Our hypothesis was that 18F-FDG PET would be significantly superior to HMPAO SPECT.
MATERIALS AND METHODS
Subjects
Subjects were recruited prospectively from people aged over 60 y with mild to moderate dementia (Mini-Mental Status Examination > 12) referred to clinical services in North-East England together with healthy controls of similar age. Subjects were recruited between June 2010 and June 2012. Control subjects had no symptoms of dementia, and patients met criteria for probable AD (15) or probable DLB (16). Clinical diagnosis was made by consensus between 2 experienced clinicians. Neither 18F-FDG PET nor SPECT brain scans were used to confirm the diagnosis. All subjects had to have sufficient command of English and adequate visual and auditory acuity to allow cognitive and neuropsychologic testing. Exclusion criteria were past history of alcohol or drug dependence, contraindications for 18F-FDG PET or SPECT scanning, or fasting blood glucose levels greater than 180 mg/dL. All subjects meeting inclusion and exclusion criteria who consented were included in the study. We recruited 102 subjects, of whom 3 withdrew before completion and 1 was excluded because of scanner technical problems. Thirty-eight AD subjects, 30 DLB subjects, and 30 controls were successfully scanned with both 18F-FDG PET and SPECT.
Subjects underwent detailed neuropsychiatric investigation including the Cambridge Cognitive Examination (17), the Rey Auditory Verbal Learning Test (18), and the trail-making test A&B (19). The Cornell scale for depression in dementia (20) was used, and for dementia participants we performed the Neuropsychiatric inventory (21) and Clinician Assessment of Fluctuation (22). Parkinsonian motor features were assessed using the motor subsection of the Unified Parkinson Disease Rating Scale (UPDRS III) (23).
The study was approved by Newcastle and North Tyneside 1 Research Ethics Committee (REF 09/H0906/88), and all participants (or nominated Independent Mental Capacity Advocate where participant lacked capacity) gave informed consent before participating. The study is registered on the ISRCTN register, number ISRCTN49486383.
Scanning
The order of each scan (18F-FDG PET/SPECT) alternated between consecutive subjects within each group. SPECT head scans were acquired using a Siemens Symbia S dual-detector γ camera, starting 30 min after the intravenous administration of 500 MBq of 99mTc-HMPAO. One hundred twenty 25-s planar views were obtained on a 128 × 128 matrix, zoom 1.23 (pixel size, 3.9 mm), using a low-energy high-resolution collimator and circular orbit with a typical radius of 14 cm. Section images were produced with Hybrid Recon Neurology software (Hermes Medical Solution Ltd.) using ordered-subset expectation maximization iterative reconstruction with 4 iterations and 20 subsets, postfiltered with a 3-dimensional gaussian filter of 1.1 cm in full width at half maximum with uniform attenuation correction and resolution recovery. 18F-FDG PET head scans were obtained over 10 min using a Siemens Biograph Truepoint 18F-FDG PET/CT scanner starting 30 min after intravenous administration of 250 MBq of 18F-FDG. Siemens software was used for iterative reconstruction with scatter and attenuation correction based on the CT scan data obtained immediately before the 18F-FDG PET scan. In both PET and SPECT, patients were injected in quiet surroundings with minimal distractions and eyes open.
Visual Rating
The primary outcome preselected for the study was diagnostic accuracy using visual scan assessment. Scans were rated visually by 3 medical physicists who were unaware of the diagnosis and any clinical information. Two of the physicists were clinical scientists who, after appropriate training by nuclear medicine physicians, were fully approved by their National Health Service (NHS) employer for diagnostic reporting of scans and both had more than 20 y of experience in undertaking diagnostic brain scan reporting in dementia within the NHS. The third physicist had 10 y of research experience in neuroimaging analysis in dementia. Separate identification labels were randomly generated for the 18F-FDG PET and SPECT scans, so it was not possible for the readers to compare the 18F-FDG PET scan for an individual with the matching SPECT scan. For visual rating, for both PET and SPECT, the observers viewed a display with 15 axial, coronal, and sagittal slices covering the whole brain, 128 × 128 pixels each slice. PET and SPECT scans were both oriented to the orbitomeatal line.
In the visual rating, the key imaging features were reduced uptake in the precuneus and lateral parietal lobes in both AD and DLB, relative preservation of posterior cingulate in DLB, more extensive occipital loss in DLB, and that reduced uptake in temporal and frontal lobe is more likely in AD.
Each reader independently rated each scan on a 5-point scale for the degree of confidence in overall abnormality typical of dementia. For all scan findings not considered to be definitely normal, the match to AD or DLB was also rated, again using a 5-point scale. After individual ratings were completed, the imaging team met to compare and review all their ratings and to produce a set of consensus ratings for each scan. Each scan result was also given a tripartite consensus classification of normal, AD, or DLB.
Quantitative Analysis
Quantitative analysis was a secondary outcome. To create study- and modality-specific templates, each SPECT scan was spatially coregistered with the same subject’s 18F-FDG PET scan. The 18F-FDG PET scans were then spatially aligned (rigid body 9 degrees of freedom) to the standard template in SPM8 (www.fil.ion.ucl.ac.uk/spm), with the same alignment parameters being applied to the SPECT scans. Separate study-specific templates for SPECT and 18F-FDG PET were then created by averaging the aligned scans. The original scans were then nonlinearly spatially normalized to the relevant template. Registration accuracy was visually checked at each stage. Mean intensity within standard regions of interest (ROIs) were then calculated for each scan. ROIs were taken from the AAL atlas (24) for medial temporal lobe (MTL) (hippocampus + parahippocampus gyrus), medial occipital lobe (calcarine + lingual gyrus), lateral occipital (occipital_inf + occipital_med) (inf and med are inferior and medial, respectively), and parietal lobe (angular gyrus). Also, ROIs for the cerebellum, precuneus, and posterior cingulate were manually drawn on the study-specific template. One subject was excluded from this analysis because the cerebellum was not covered on the SPECT scan. Voxel-level comparison between groups for both SPECT and 18F-FDG PET was also performed in SPM8 using the mean cerebellum intensity to scale the images.
Statistics
Demographic and clinical rating data were analyzed with SPSS 19.0 (IBM). Continuous variables were compared using independent Student t tests or ANOVA. χ2 tests were used to compare categoric data.
Receiver-operating-characteristic (ROC) analysis was performed using Metz software (http://metz-roc.uchicago.edu/MetzROC/software). ROC analysis looks at the relationship between sensitivity and specificity dependant on the diagnostic cutoff on the visual rating or test score. ROC curves were calculated for each rater individually, the multireader case by combining data from all 3 raters, and also from the consensus rating agreed on by the raters after individual rating was done. We compared area under the curve (AUC) for 18F-FDG PET versus SPECT using both the original visual ratings from all observers (with the multiple readers and multiple cases package (25)) and the consensus rating using the ROCKIT package (Metz Software). We also analyzed the ROI quantitative data using ROCKIT.
RESULTS
Demographics
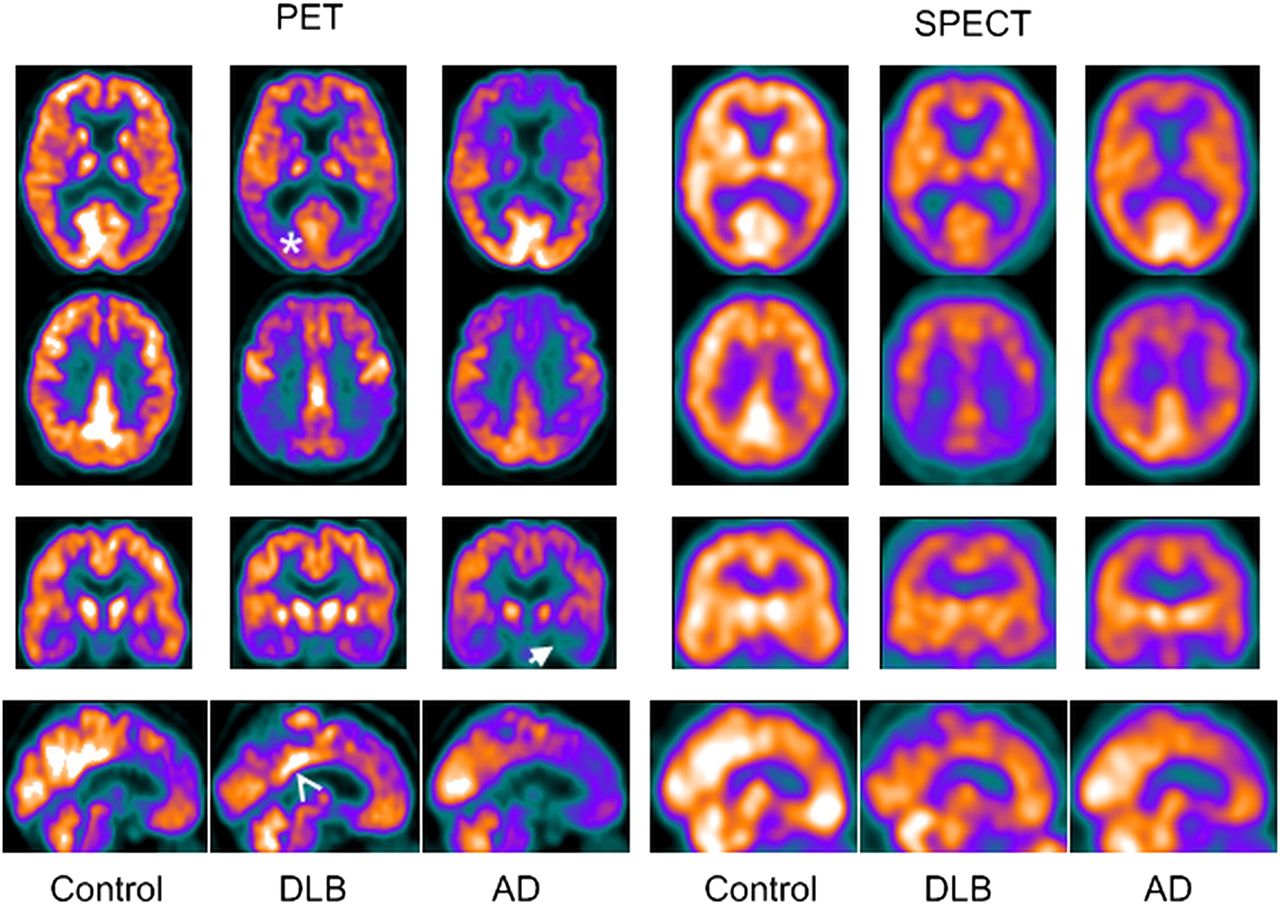
SPECT and 18F-FDG PET/CT scans were obtained within 4 mo of recruitment, with a mean time between scans of 11 d (SD, 12.6; maximum, 89 d). There were no adverse events during any scans. As Table 1 shows, the groups were well matched for age, sex, and duration of dementia. There were no significant differences between AD and DLB in Cambridge Cognitive Examination score. As expected, the DLB group had significantly higher scores on the Unified Parkinson Disease Rating Scale, whereas the AD group had poorer memory performance on the Rey Auditory Verbal Learning Test. Figure 1 shows examples of characteristic control, AD, and DLB 18F-FDG PET and SPECT scans, demonstrating the superior spatial resolution of 18F-FDG PET.
Subject Demographics

Example of 18F-FDG PET and SPECT scans for AD, DLB, and control. Medial temporal loss in AD (arrow) and occipital lobe reduction (asterisk) and posterior cingulate island sign (arrowhead) in DLB are shown.
Visual Rating
Table 2 summarizes the ROC analysis for the distinction of dementia (AD and DLB) from healthy control. For all readers individually (Supplemental Table 1; supplemental methods are available at http://jnm.snmjournals.org), the multireader, and the consensus analysis, the AUC for 18F-FDG PET was significantly greater than SPECT. For diagnosing AD versus DLB, with both the consensus visual rating (Table 3) and the multireader analysis (Supplemental Table 2), 18F-FDG PET had a significantly larger AUC than SPECT, indicating better diagnostic performance for 18F-FDG PET. There was little variation in diagnostic accuracy between raters, though in the distinction between AD and DLB (Supplemental Table 2) there was a slightly wider variation in diagnostic accuracy between raters for SPECT (0.516–0.660) than for PET (0.693–0.775).
ROC Analysis for 18F-FDG PET Versus SPECT in Healthy Versus Dementia
ROC Analysis for 18F-FDG PET Versus SPECT in AD Versus DLB
Although the AUC was the primary outcome measure of the study, we also calculated estimates of the specificity and sensitivity using the consensus classification.
Table 4, Supplemental Table 3, and Figure 2 (flowchart) show the comparison of the consensus tripartite diagnosis versus actual diagnosis and accuracy of PET versus SPECT. There was a particular tendency on SPECT to categorize AD as normal.
Consensus Tripartite Diagnostic Decision Versus Actual Diagnosis
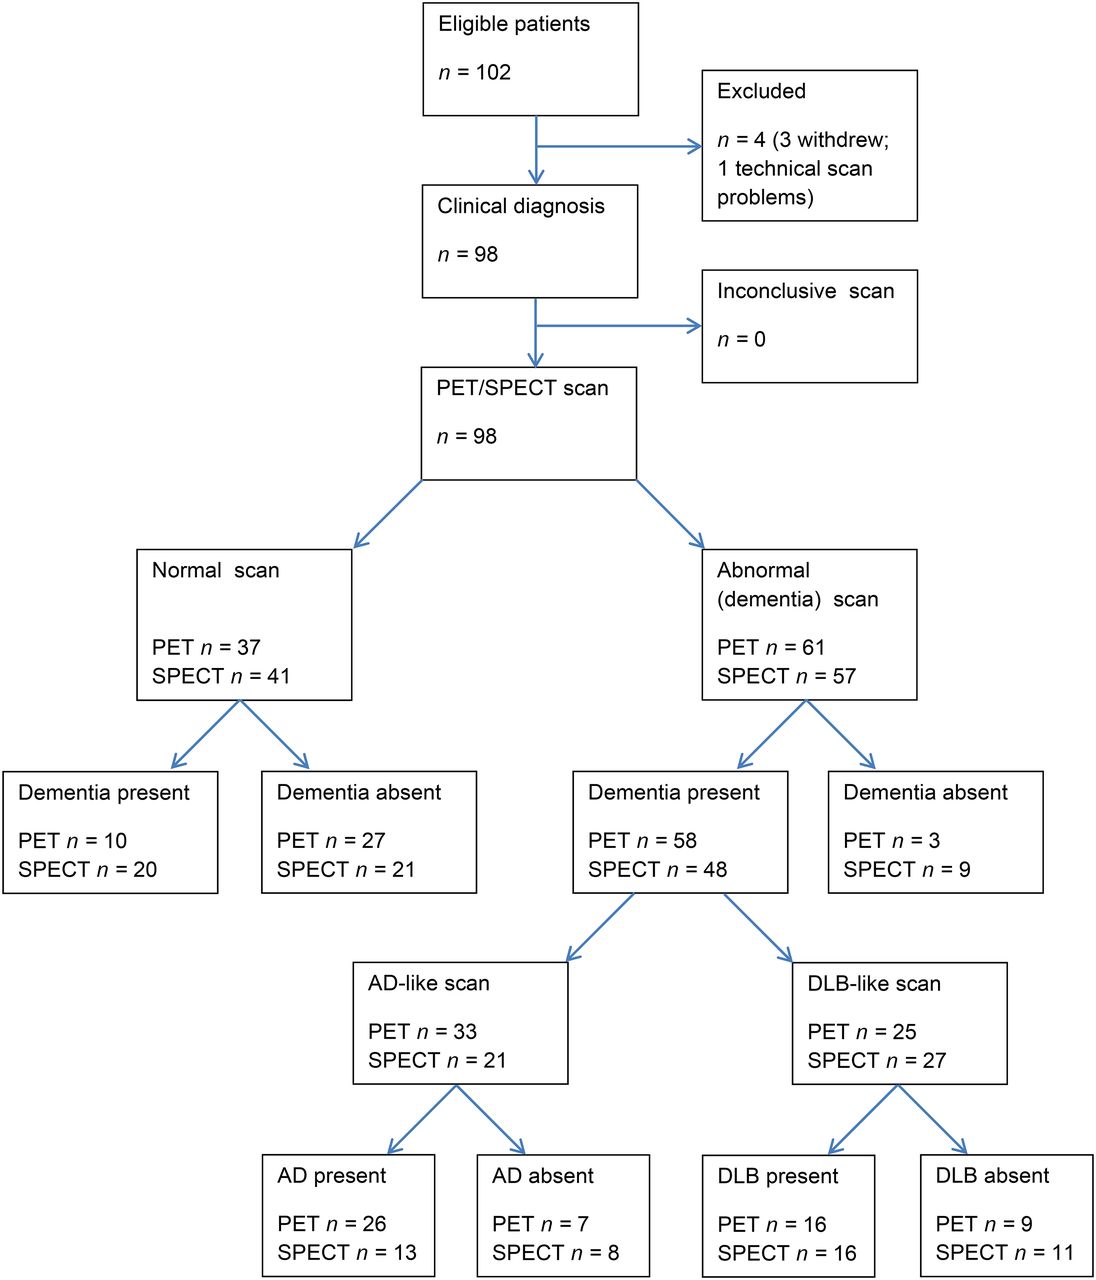
Flowchart of patients in study. 18F-FDG PET and SPECT diagnoses are from consensus tripartite decision.
For the decision of dementia versus healthy, when the consensus diagnosis was used 18F-FDG PET had a sensitivity of 0.85 (95% confidence interval [CI], 0.75–0.93) and a specificity of 0.90 (95% CI, 0.73–0.98), whereas SPECT had sensitivity of 0.71 (95% CI, 0.58–0.81) and specificity of 0.70 (95% CI, 0.51–0.85). For AD versus DLB, taking those with a correct imaging diagnosis of dementia (fifty-eight 18F-FDG PET and 48 SPECT), 18F-FDG PET sensitivity for AD was 0.74 (95% CI, 0.57–0.88) and specificity was 0.70 (95% CI, 0.47–0.87) whereas for SPECT, sensitivity for AD was 0.54 (95% CI, 0.33–0.74) and specificity 0.67 (95% CI, 0.45–0.84). Supplemental Tables 4 and 5 show the cross tabulation of the visual rating for 18F-FDG PET versus SPECT. There was a tendency for scan results correctly classified as dementia on 18F-FDG PET to be called normal on SPECT, and SPECT seemed to have better performance for DLB, with most AD SPECT scans being rated unclear.
Quantitative Scan Analysis
Figure 3 shows the results of the voxelwise SPM analysis. Both modalities show broadly similar patterns, with reductions in the parietal and temporal lobes in dementia, with AD having reduced MTL uptake and DLB-reduced uptake in the occipital lobe. As Figure 3 and Supplemental Table 6 show, the reductions were more significant using 18F-FDG PET than SPECT, particularly for dementia, compared with control. Supplemental Table 7 shows the number of significant voxels at different threshold values, and in all comparisons, 18F-FDG PET has at least 3 times as many significant voxels as SPECT. We also repeated the analysis with intensity normalization to the pre- + postcentral gyrus region, and this produced similar findings.

SPM results, voxelwise threshold P = 0.0005, uncorrected for multiple comparisons. Top row shows reduction in all dementia vs. control. Bottom row shows reductions of AD vs. DLB (in blue) and reductions in DLB vs. AD (in red/yellow).
The cingulate island sign in DLB (26) of preserved posterior cingulate activity relative to the precuneus was seen in 18F-FDG PET but not SPECT imaging (Fig. 1; Supplemental Table 6). In keeping with previous research (27,28), the most significant differences in the ROI analysis between control and the combined AD and DLB group were in the parietal-to-cerebellum ratio and for AD versus DLB, the ratio of medial occipital to MTL (Supplemental Table 6). We therefore examined the relative diagnostic performance of 18F-FDG PET versus SPECT with these ratios using ROC analysis (Tables 2 and 3).
For the distinction of control versus dementia (AD and DLB), the AUC for the quantitative parietal and cerebellum ROI measurement gave a performance similar to the visual rating and demonstrated the superior diagnostic ability of 18F-FDG PET. For differentiating AD from DLB using the ROI measure of medial occipital and MTL, the AUC for 18F-FDG PET was greater than SPECT, although this was not significant.
DISCUSSION
Our main findings showed the significant superiority of 18F-FDG PET over HMPAO SPECT in the differentiation of degenerative dementia (AD and DLB combined) from healthy controls and for the differentiation of AD from DLB. The superiority of 18F-FDG PET was consistently demonstrated across all 3 of our prespecified methods of analysis. On the primary outcome, the clinically relevant endpoint of visual diagnostic read, 18F-FDG PET had a sensitivity of 85% and specificity of 90% for distinguishing dementia versus no-dementia whereas SPECT had a sensitivity of 71% and specificity of 70%. The high diagnostic accuracy of 18F-FDG PET is consistent with previous literature (9), demonstrating that it is a robust marker for assessing neurodegeneration in both AD and DLB. Our findings therefore strongly support its incorporation in imaging diagnostic guidelines and as a biomarker of degeneration in newly proposed diagnostic criteria for AD. In contrast, the diagnostic accuracy of perfusion SPECT was significantly poorer. Although for the dementia/no-dementia comparison diagnostic accuracy might still be clinically helpful, accuracy for differentiating AD from DLB was disappointingly poor and not at a level where it is likely to be clinically useful. Although spatial resolution is higher in 18F-FDG PET, and improves visual appearance, this is unlikely to have been the only cause of the diagnostic accuracy difference, because the ROI results (which are from the mean value of regions encompassing several cubic centimeters) also demonstrated the superior accuracy of 18F-FDG PET.
There are clearly other considerations apart from diagnostic accuracy when deciding on which imaging tests to undertake. SPECT has been advocated over 18F-FDG PET on the basis of its wider availability, lower cost, and perceived better patient tolerability. However, with the widespread use of 18F-FDG PET for oncology (responsible for more than 90% of 18F-FDG PET scans undertaken worldwide), costs of 18F-FDG PET have reduced considerably. For example, the price of 1 patient dose of 18F-FDG has halved in the last decade, to under £200 (∼US$300), comparable to the price of HMPAO. Also, PET/CT scanners are now widely available, so availability of scanners should no longer be a deterrent to its use.
Strengths of our study are the inclusion of representative subjects presenting to clinical services with AD and DLB, rather than selected samples from specialist clinics. We undertook both SPECT and 18F-FDG PET scans in balanced order within a short time frame. Our primary visual analysis was validated by ROI and voxel-based approaches, which are less operator-dependant. Both these methods demonstrated that differences on 18F-FDG PET were both more widespread and of greater significance than SPECT. For example, SPECT showed 7% of voxels in those with dementia that were statistically significantly different from controls, compared with 40% for 18F-FDG PET.
Our study used a clinical diagnostic standard of consensus clinical diagnosis. Although a clinical diagnostic standard can always be criticized in the absence of autopsy, this approach has been validated in our group against both autopsy and other imaging markers and is a standard now accepted by regulatory authorities (29). It is highly unlikely that clinical misdiagnosis could have accounted for our findings of the superiority of 18F-FDG PET over SPECT. To invoke this interpretation, one would have to assume that many of our subjects with established dementia were actually healthy controls. Our findings of perfusion SPECT being of limited diagnostic utility for differentiating DLB from AD are in agreement with previous studies (30). This is in contrast to dopaminergic SPECT, which is widely used for differentiating DLB from AD and would be the biomarker of choice in this particular clinical situation (31). However, because HMPAO SPECT and 18F-FDG PET are widely used in the initial evaluation of degenerative dementia when there is diagnostic uncertainty, it is clinically relevant to know their relative diagnostic accuracy for distinguishing DLB from AD, thus indicating whether or not an additional dopaminergic scan is likely to be informative, which our study suggests it would be.
Our study did not compare 18F-FDG PET and perfusion SPECT against other dementia biomarkers such as cerebrospinal fluid, amyloid imaging, or, for DLB, dopaminergic imaging of the basal ganglia. This was not the aim of the study, because these other biomarkers have previously been assessed (4), but more important, 18F-FDG PET and perfusion SPECT are the imaging tools most likely to be requested first before more specific biomarker studies.
CONCLUSION
We undertook a direct comparison of the diagnostic value of 18F-FDG PET and perfusion (HMPAO) SPECT in the differential diagnosis of degenerative dementia and found 18F-FDG PET to be significantly superior to SPECT using all methods of analysis. The performance of SPECT was such that it is of only limited diagnostic value. Although we can envisage circumstances when HMPAO SPECT may still be a useful investigation, in most circumstances and especially when both 18F-FDG PET and perfusion SPECT are available, our results strongly indicate that 18F-FDG PET should be the clinical investigation of choice for the differential diagnosis of degenerative dementia. We recommend that national and international guidelines are updated to reflect this new evidence.
DISCLOSURE
The costs of publication of this article were defrayed in part by the payment of page charges. Therefore, and solely to indicate this fact, this article is hereby marked “advertisement” in accordance with 18 USC section 1734. This paper presents independent research funded by the National Institute for Health Research (NIHR) under its Research for Patient Benefit (RfPB) Programme (Grant Reference Number PB-PG-1207-13105). Support was also provided by the NIHR Newcastle Biomedical Research Centre and Lewy-body Dementia Biomedical Research Unit based at Newcastle upon Tyne Hospitals NHS Foundation Trust and Newcastle University, and also the NIHR Biomedical Research Centre and Biomedical Research Unit in Dementia based at Cambridge University Hospitals NHS Foundation Trust and the University of Cambridge.
Michael J. Firbank reports grants from the National Institute for Health Research. Karl Herholz reports grants and personal fees from Lilly/Avid Radiopharmaceuticals; personal fees from GE Healthcare, Cytox, and Elan; and other from Herholz Consulting GmbH, outside the submitted work. John T. O’Brien report grants and other from GE Healthcare, grants and other from Lilly, other from Bayer Healthcare, other from TauRx, and other from Cytox, outside the submitted work.
The study sponsor played no role in study design and the collection, analysis, and interpretation of data and the writing of the article and the decision to submit it for publication. The researchers are independent from funders and sponsors and have full access to all the data. The views expressed are those of the authors and not necessarily those of the NHS, the NIHR, or the Department of Health.
No other potential conflict of interest relevant to this article was reported.
Acknowledgments
We thank the Dementia and Neurodegenerative Diseases Research Network (DeNDRoN) for valuable support with clinical recruitment. We also thank the National Institute for Health Research.
Footnotes
Published online Nov. 5, 2014.
- © 2014 by the Society of Nuclear Medicine and Molecular Imaging, Inc.
REFERENCES
- Received for publication June 5, 2014.
- Accepted for publication September 25, 2014.


Jump to section
Related Articles
Cited By...
- Spatial covariance analysis of FDG-PET and HMPAO-SPECT for the differential diagnosis of dementia with Lewy bodies and Alzheimers disease
- Clinical imaging in dementia with Lewy bodies
- MRI of the Swallow Tail Sign: A Useful Marker in the Diagnosis of Lewy Body Dementia?
- Diagnosis and management of dementia with Lewy bodies: Fourth consensus report of the DLB Consortium
- Cerebral glucose metabolism and cognition in newly diagnosed Parkinson's disease: ICICLE-PD study
- Diagnosing dementia
- An evidence-based algorithm for the utility of FDG-PET for diagnosing Alzheimer's disease according to presence of medial temporal lobe atrophy