


Abstract
Because the use of factor analysis has been proposed for extracting pure physiologic temporal or spatial information from dynamic nuclear medicine images, factor analysis should be capable of robustly estimating regional myocardial blood flow (rMBF) using H215O PET without additional C15O PET, which is a cumbersome procedure for patients. Therefore, we measured rMBF using time–activity curves (TACs) obtained from factor analysis of dynamic myocardial H215O PET images without the aid of C15O PET. Methods: H215O PET of six healthy dogs at rest and during stress was performed simultaneously with microsphere studies using 85Sr, 46Sc, and 113Sn. We performed factor analysis in two steps after reorienting and masking the images to include only the cardiac region. The first step discriminated each factor in the spatial distribution and acquired the input functions, and the second step extracted regional-tissue TACs. Image-derived input functions obtained by factor analysis were compared with those obtained by the sampling method. rMBF calculated using a compartmental model with tissue TACs from the second step of the factor analysis was compared with rMBF measured by microsphere studies. Results: Factor analysis was successful for all the dynamic H215O PET images. The input functions obtained by factor analysis were nearly equal to those obtained by arterial blood sampling, except for the expected delay. The correlation between rMBF obtained by factor analysis and rMBF obtained by microsphere studies was good (r = 0.95). The correlation between rMBF obtained by the region-of-interest method and rMBF obtained by microsphere studies was also good (r = 0.93). Conclusion: rMBF can be measured robustly by factor analysis using dynamic myocardial H215O PET images without additional C15O blood-pool PET.
Because H215O is freely diffusible, it is a favorable PET tracer for the measurement of regional myocardial blood flow (rMBF). Dynamic H215O PET has been used to measure rMBF (1–4). However, additional C15O blood-pool PET has been needed to draw the region of interest (ROI) on the myocardium to supplement low-quality H215O PET images. This need has been an obstacle to the popular use of H215O myocardial PET without a gas (C15O) study. Paired H215O–C15O PET is a cumbersome procedure and has the potential risk of patient movement between the two scans. Because subtraction of C15O images from H215O images is used to draw myocardial regions, misalignment between H215O images and C15O images will result in mispositioned tissue ROIs.
Since its first introduction in nuclear medicine, factor analysis has been widely used to extract pure physiologic time–activity curves (TACs) and their factor images from dynamic nuclear images (5–9). The purpose of factor analysis is to separate a few underlying but unobservable quantities, or factors, using the covariance relationship among the observed data. By singular value decomposition, the covariance–variance matrix of the observed data can be divided into the eigenvalue and eigenvector matrices. Thus, the observed data can be represented with a few sets of eigenvalues and eigenvectors that compose the greatest proportion of the total eigenvalues and eigenvectors.
Hermansen et al. (9) acquired myocardial factor images from H215O myocardial PET using a fixed-flow model and applied the myocardial factor images to define tissue ROIs without C15O blood-pool PET. However, these authors employed a modeling approach that used the lung TAC to obtain the left and right ventricular TACs, with consideration of the time delay between the lungs and the ventricles, and the computation time was long.
In this study, we measured rMBF using two-step factor analysis with dynamic H215O PET images without an additional C15O blood-pool PET scan. The purpose of dividing the procedure into two steps was to obtain the pure regional-tissue TACs by factor analysis. In the first step of the factor analysis, we obtained the input function and the spatial information for each component (myocardium and left and right ventricles) so that we could determine the myocardial regions (septal, inferior, lateral, and anterior). In the second step of the factor analysis, by drawing an ROI on a quarter of the myocardium, we obtained regional-tissue TACs. After validation of input function–derived factor analysis by that derived from arterial sampling, rMBF measured by factor analysis was validated by microsphere studies performed simultaneously with H215O PET.
MATERIALS AND METHODS
Image Acquisition and Preprocessing
Six healthy dogs were anesthetized using thiopental sodium and intubated, but self-respiration was sustained. H215O dynamic myocardial PET images were acquired with an ECAT EXACT 47 scanner (Siemens Medical Systems, Inc., Hoffman Estates, IL/CTI, Knoxville, TN). Before the scan, femoral and radial arteries were cannulated for microsphere injection and blood sampling. Two forelimb veins were reserved for H215O injection and adenosine infusion.
A transmission scan was acquired using triple 67Ge rod sources. After a bolus injection of 518–666 MBq H215O, dynamic H215O PET images were acquired at rest for 4 min (5 s × 12, 10 s × 9, and 30 s × 3). Adenosine was infused at a continuous velocity (0.14 mg/kg/min) for 7 min. Three minutes after the start of the adenosine infusion, dynamic H215O PET images were acquired for 4 min while the adenosine was infused.
Transaxial images were reconstructed using a filtered backprojection method with a Shepp-Logan filter having a cutoff frequency of 0.3 cycles per pixel for 128 × 128 × 47 matrices and a pixel size of 2.5 × 2.5 × 3.3 mm. The dynamic images were reoriented to the short axis using static images already reoriented to 128 × 128 × 64 matrices and a pixel size of 2.5 × 2.5 × 2.5 mm. Twenty-four reoriented slices that included myocardium were selected and summed to become six slices to increase the signal-to-noise ratio. The resulting images were six short-axis slices with a per-slice thickness of 1 cm, which was same as the width of myocardium cut after microsphere studies.
Microsphere Studies
Three kinds of microspheres (15 μm; Dupont, Billerica, MA)—those labeled with 85Sr, those labeled with 46Sc, and those labeled with 113Sn—were used for the rest and stress study. The number of microspheres was approximately 2.8 × 10⁶ per unit volume for 85Sr and 46Sc and 2.4 × 10⁶ for 113Sn. Thirty-seven megabecquerels of microspheres were injected into the left ventricle through a catheter that had already been inserted into the left ventricular cavity through the femoral artery. The microspheres were injected simultaneously with injection of H215O through a forelimb vein.
After the dogs were killed, the heart was extracted and ventricular blood was washed gently with normal saline. The myocardium was cut along the long axis at 1-cm intervals. Six slices were obtained. Every slice was cut into four (anterior, lateral, septal, and posterior) regions, and then each region was cut into pieces and counted (counts per gram). By comparing the tissue counts with the blood sample counts, blood flow per unit mass (gram) of tissue was calculated (10).
Factor Analysis
The reoriented images were masked (32 × 32) to include the cardiac region using a midventricular slice. The same mask was applied to all six slices. Only the first 2 min (18 frames) of the H215O dynamic data were chosen for factor analysis. The masked images (32 × 32 × 18 × 6) were summed to be 8 × 8 × 18 × 6 matrices to reduce statistical fluctuation. We used the factor analysis algorithm based on the methods of Di Paola et al. (11) and Barber (12). In brief, the normalized TAC from each pixel, called a dixel, was assumed as a linear combination of the physiologic TACs (myocardium, left and right ventricle, and the other regions). After principal component analysis with the normalized dixels, a few eigenvectors were obtained and a new affine space was defined from these vectors. Then, using the positive constraint, this vector space was rotated until all factors had positive values, because all factors should be the pure physiologic data.
The procedure of our factor analysis was as follows. First, all six slices were used to extract factor images for the left and right ventricles and the myocardial tissues. The left ventricular TAC was obtained as an input function. Second, ROIs were drawn on the myocardial factor images to include the whole left ventricular cavity and a quarter (anterior, lateral, septal, and posterior) of a slice of myocardial tissue. The ROIs were projected onto the dynamic image, and then the second factor analysis was performed. Because the extracted TACs by factor analysis were in normalized units, the scaling factor to recover the true scale of the TACs was calculated using factor images (5,6). The average over a threshold (70%) of the maximum value of a factor image was used as the scaling factor. Thus, the scaling factor for input function was calculated with the left ventricular factor image from the first step, and the scaling factor for tissue TAC was calculated with the tissue factor image from the second step. Multiplying the normalized TACs by the scaling factor restored the true scale of the input function and tissue TACs. The whole procedure is shown as a schematic flowchart in Figure 1.
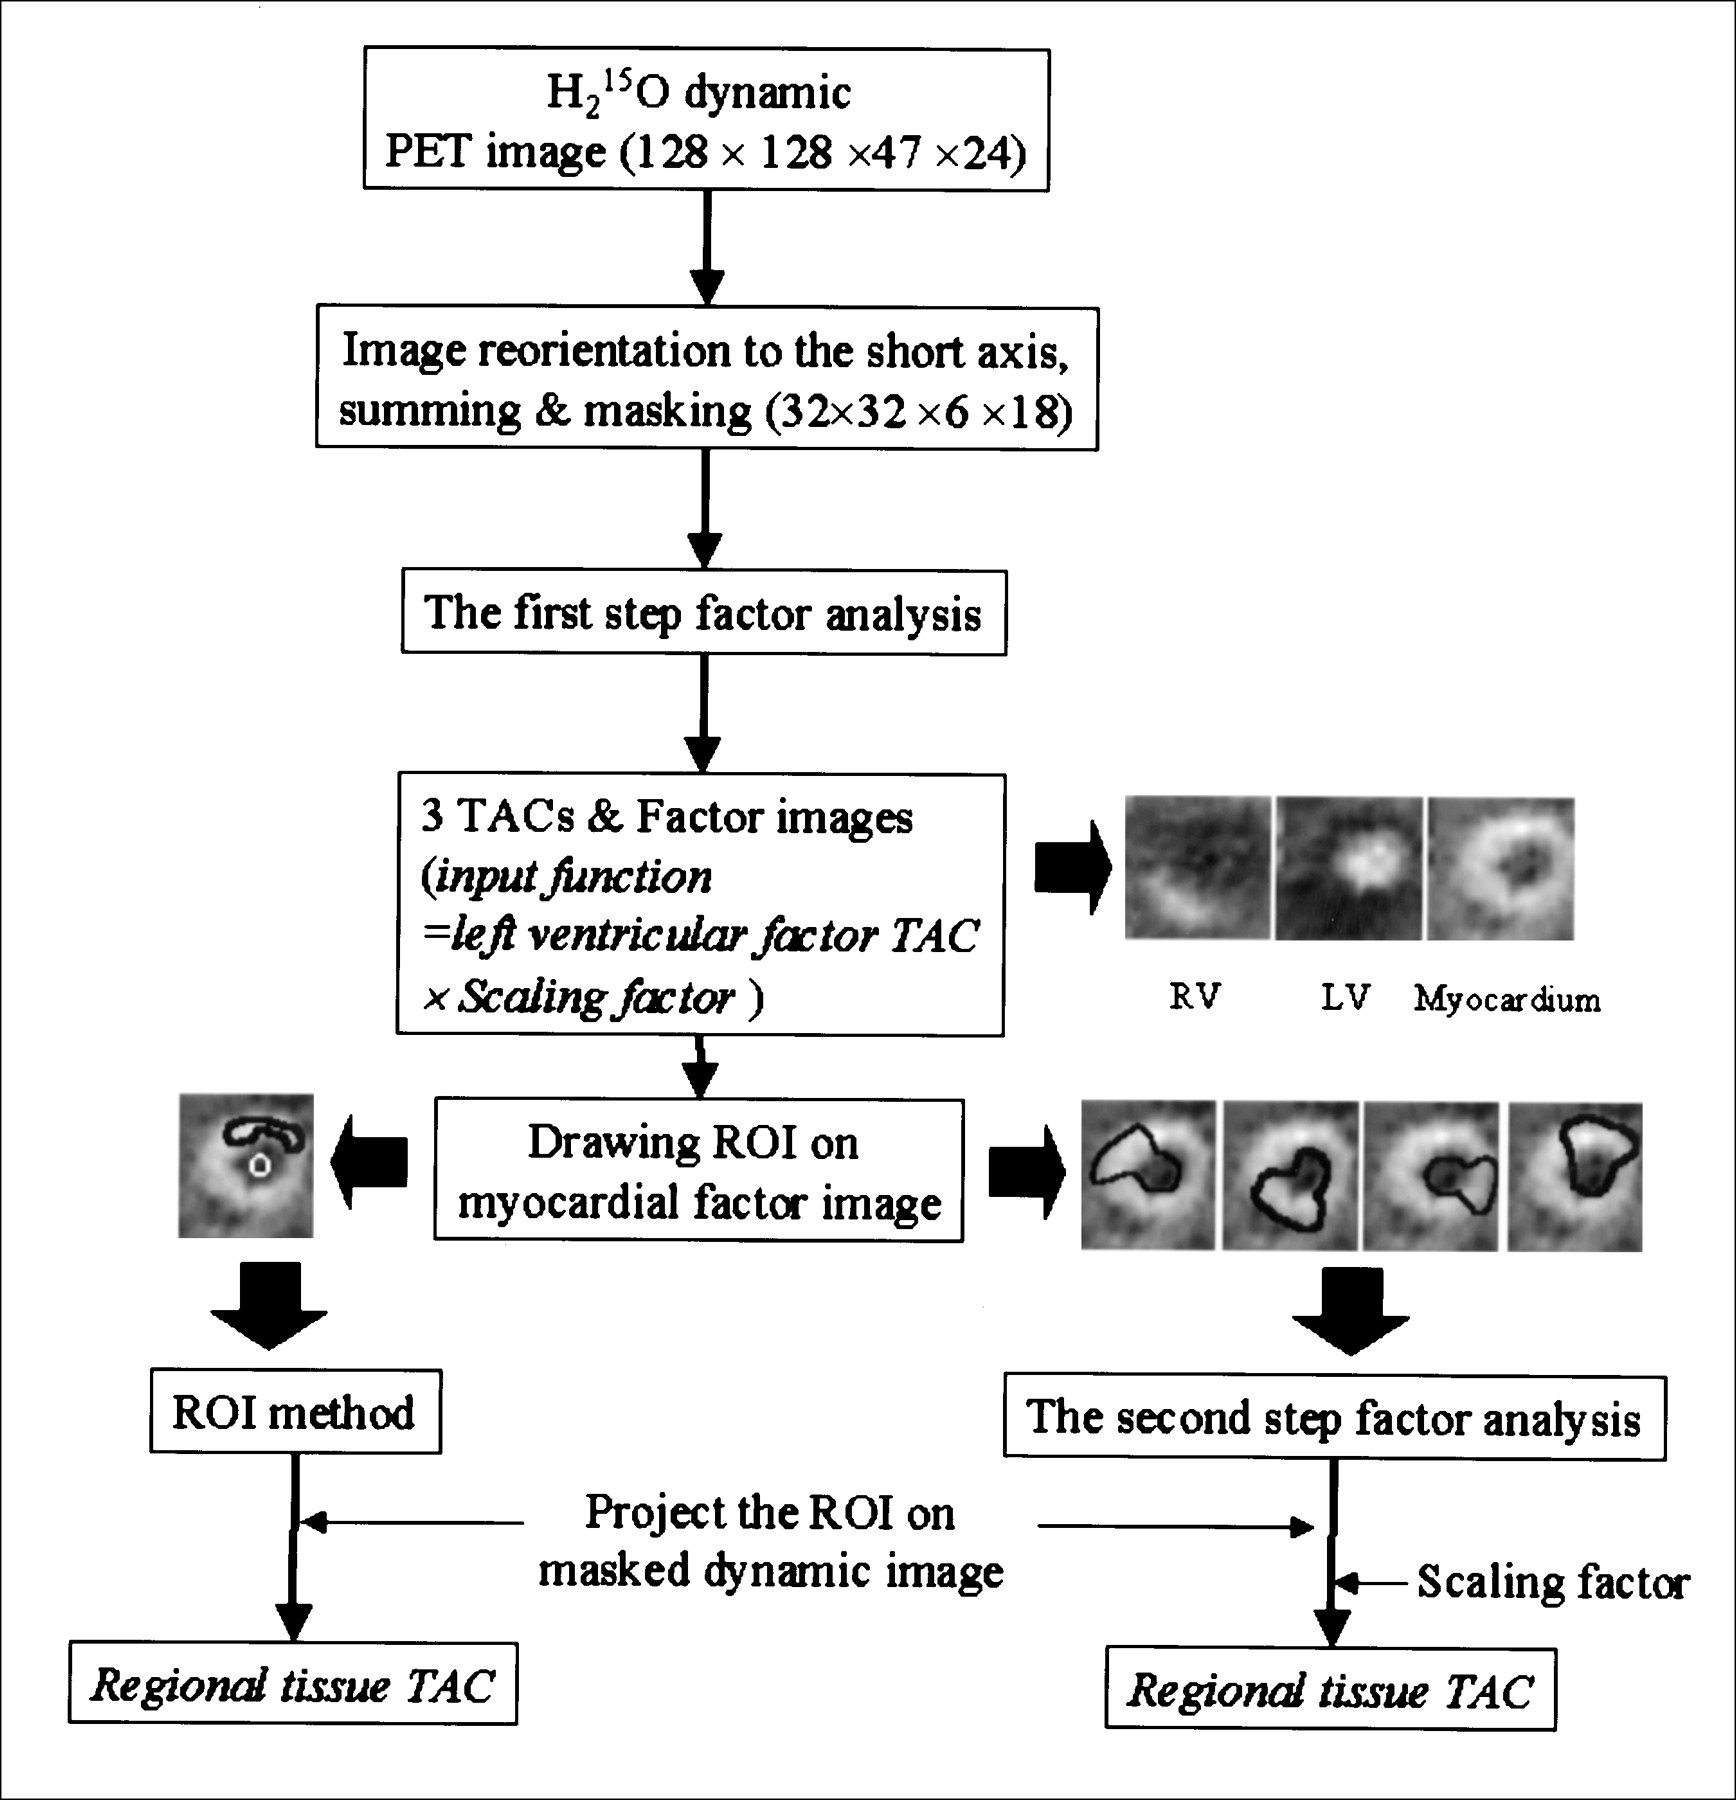
Schematic representation of processing steps of factor analysis to yield input function and regional myocardial TACs. LV = left ventricle; RV = right ventricle.
Comparison of Input Functions Derived from Factor Analysis and Arterial Sampling
Arterial blood was sampled continually at 5-s intervals after the start of acquisition of additional H215O PET images in five dogs. At each experiment, the calibration factor between PET scanner and well counter was measured using a cylindric phantom. The image-derived input functions, compensated by this calibration factor (counts/min/mL), were compared with input functions by blood sampling (counts/min/mL). The areas under the curves (AUCs) of the input functions obtained by factor analysis and arterial sampling were compared.
Calculation of rMBF by Factor Analysis and ROI Method
rMBF was calculated using the following single-compartment model (4).
 where Ct(t) is the radioactivity in the myocardial ROI at time t, Ca is the input function, FMM is the tissue recovery coefficient representing partial-volume effect, FBM is the spillover fraction from ventricular blood to myocardium, f is flow, and λ is partition coefficient. Flow, tissue recovery coefficient, and spillover fraction were estimated using a nonlinear least squares fitting method. The partition coefficient was set to 0.91 (3).
rMBF was estimated with the regional-tissue TACs by factor analysis and the conventional ROI method as follows. In the second step of the factor analysis, ROIs were drawn over four regions (anterior, posterior, septal, and lateral) on the short-axis myocardial factor images including the left ventricle to extract left ventricular TAC simultaneously with tissue TACs. Tissue TACs were obtained for these four quarters of a myocardial slice and were used to estimate rMBF.
In the ROI method, tissue ROIs over the same four regions of a myocardial factor image were drawn narrowly to minimize spillover and partial-volume effects, and these ROIs were projected onto the reoriented dynamic H215O PET images. For an input function, an ROI was drawn on the left ventricle of the midventricular level of the myocardial factor image and projected onto the reoriented dynamic H215O PET image.
rMBFs calculated by factor analysis and the ROI method were compared with rMBF obtained by microsphere studies. All calculations, factor analyses, and rMBF estimations were performed using MATLAB (The MathWorks, Inc., Natick, MA) on an AlphaStation 600 workstation (Digital Equipment Corp., Maynard, MA).
Data Analysis
Input functions derived from factor analysis and arterial sampling were compared with each other by calculating the relative error of AUC ([AUCfactor analysis − AUCsampling]/AUCsampling). The correlation between rMBF by factor analysis, rMBF by the ROI method, and rMBF by microsphere studies was analyzed.
RESULTS
Factor Analysis
Three factor images, the result of the first step of the factor analysis, are presented in Figure 2. In all animals, the right ventricular, left ventricular, and myocardial components were separated successfully by the first step of the factor analysis with dynamic H215O PET images.
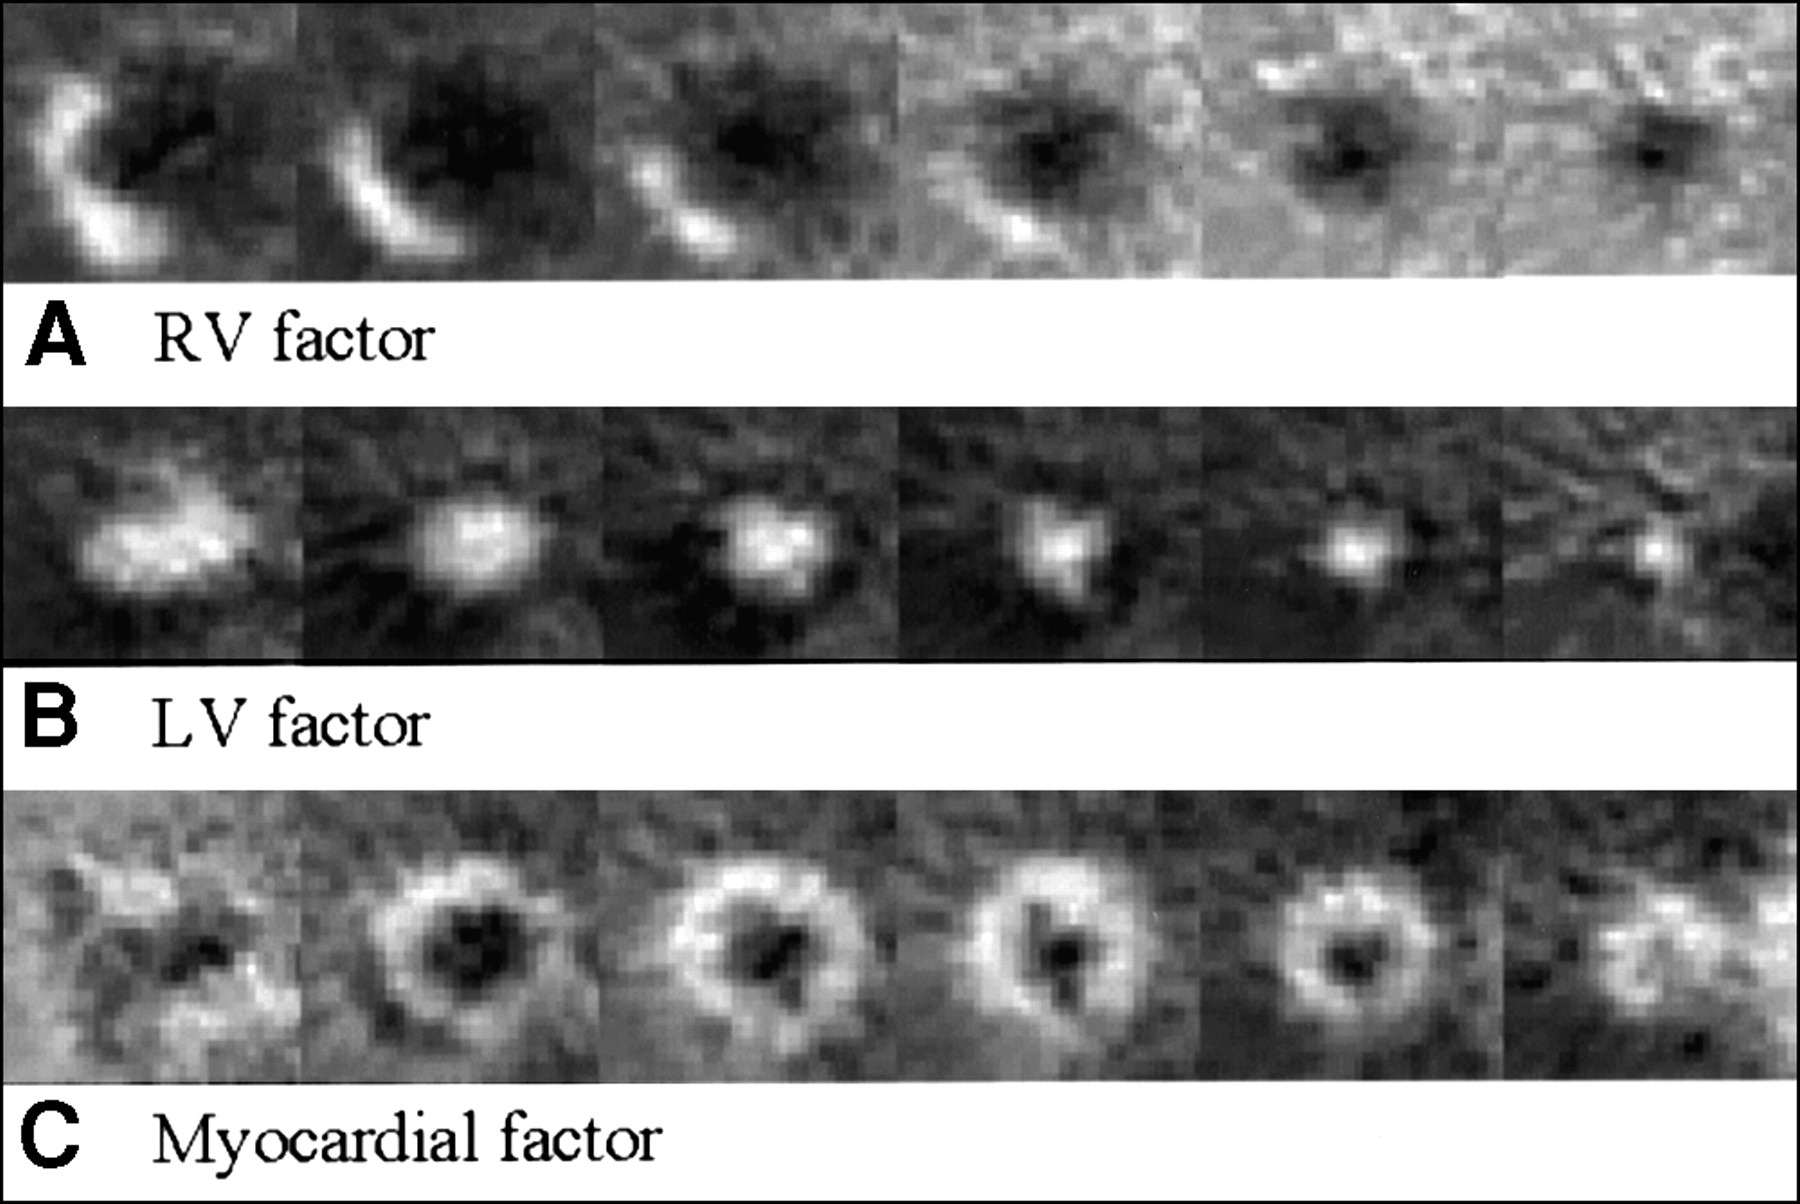
Right ventricular (RV) (A), left ventricular (LV) (B), and myocardial (C) factor images obtained from first step of factor analysis. All dynamic H215O PET studies gave consistent results.
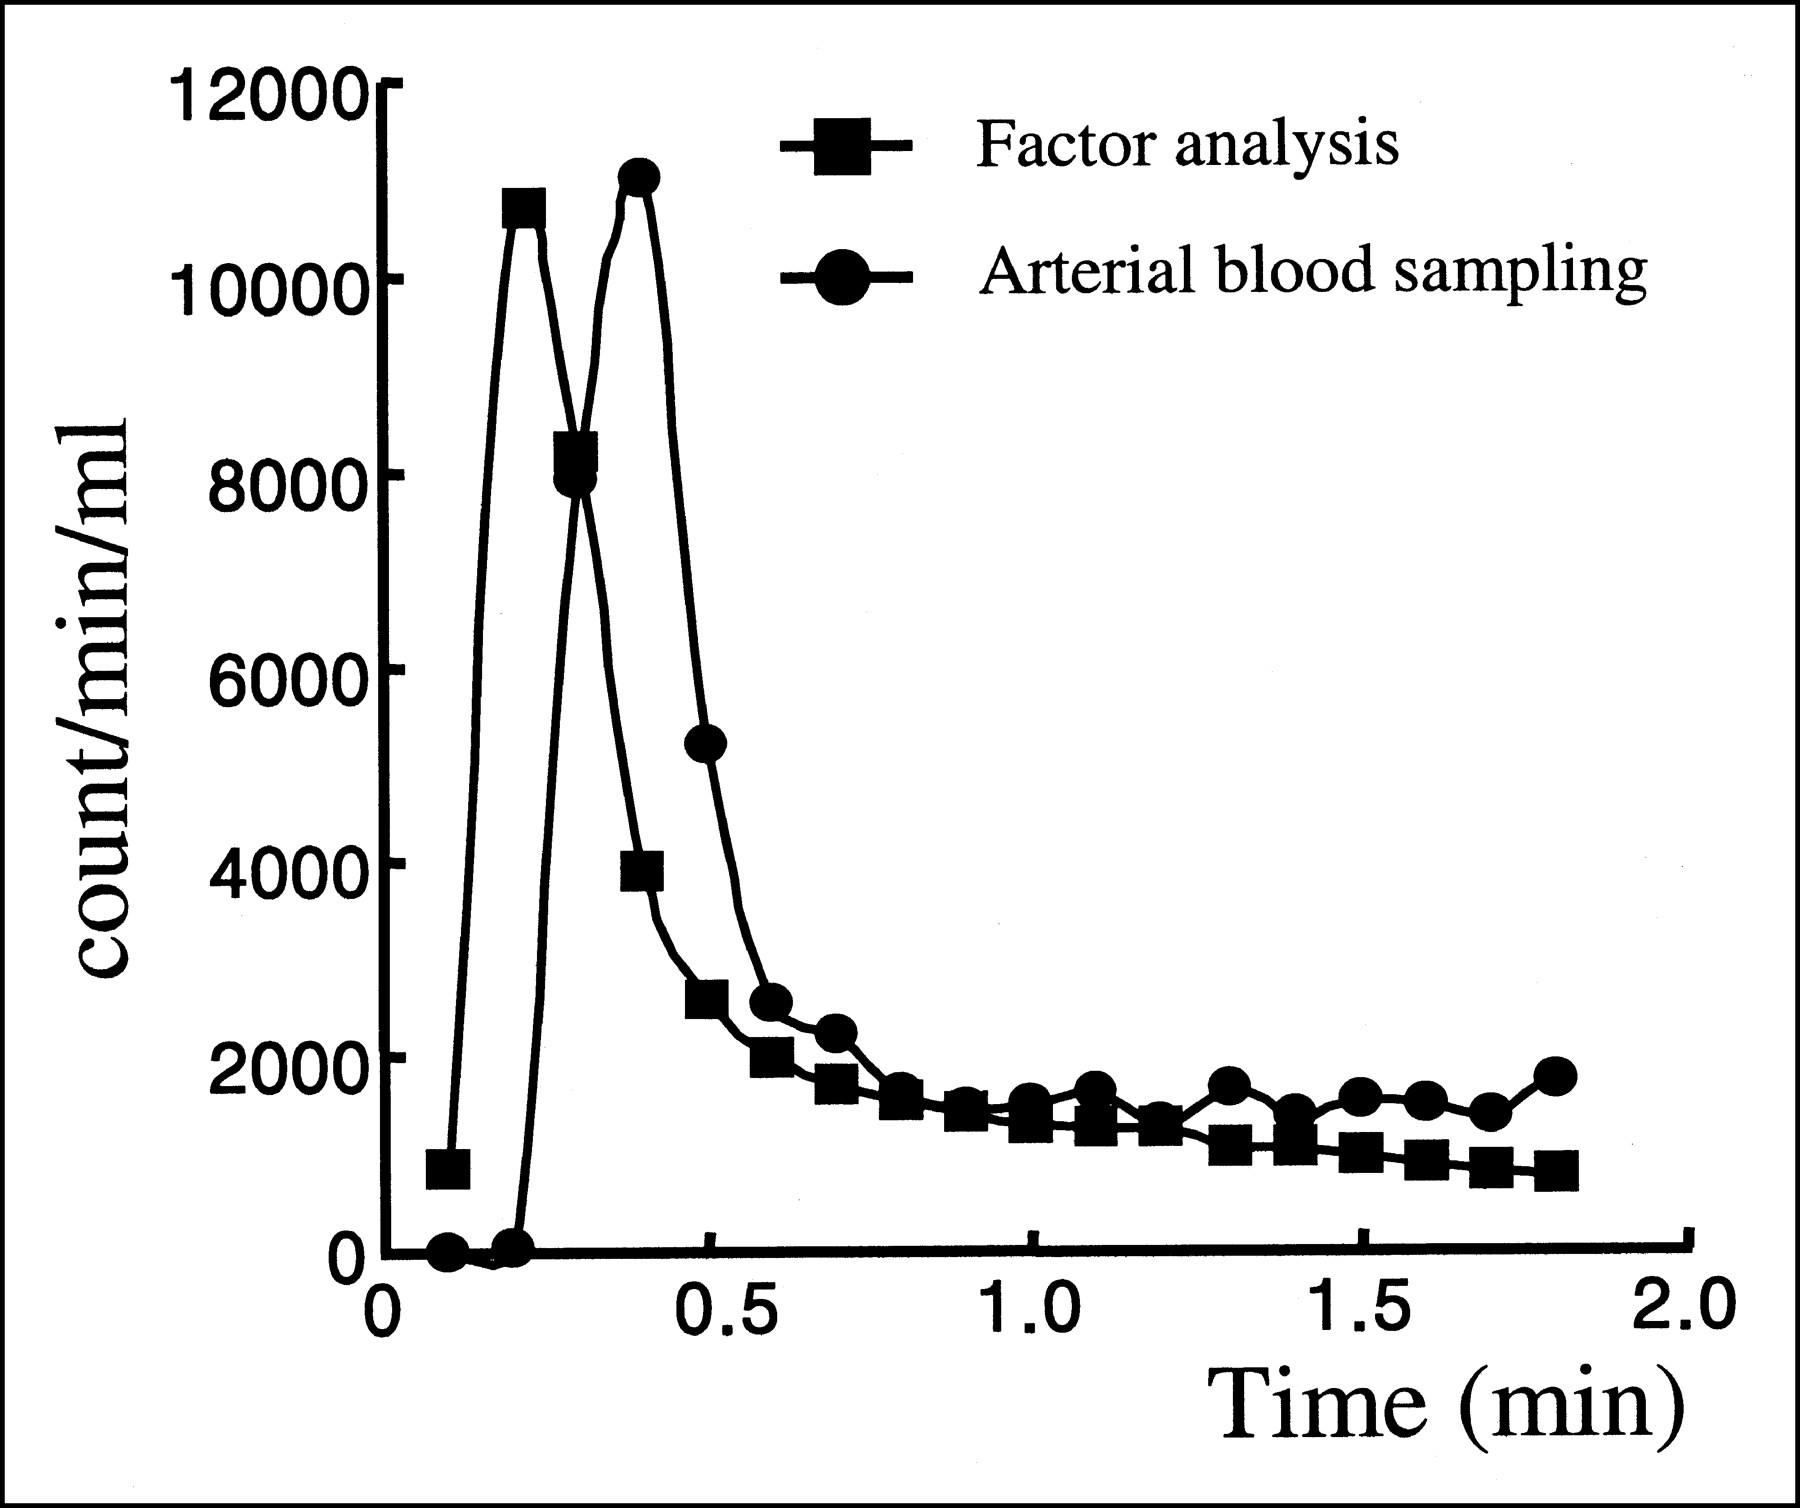
Image-derived input functions obtained by factor analysis were nearly the same as those obtained by arterial blood sampling except for the delay and dispersion of input by arterial sampling (Fig. 3). The mean relative error of AUC between the curves by factor analysis and the curves by sampling was 0.24 ± 0.17.

Input functions by factor analysis and arterial sampling. Blood samples were drawn from radial arteries.
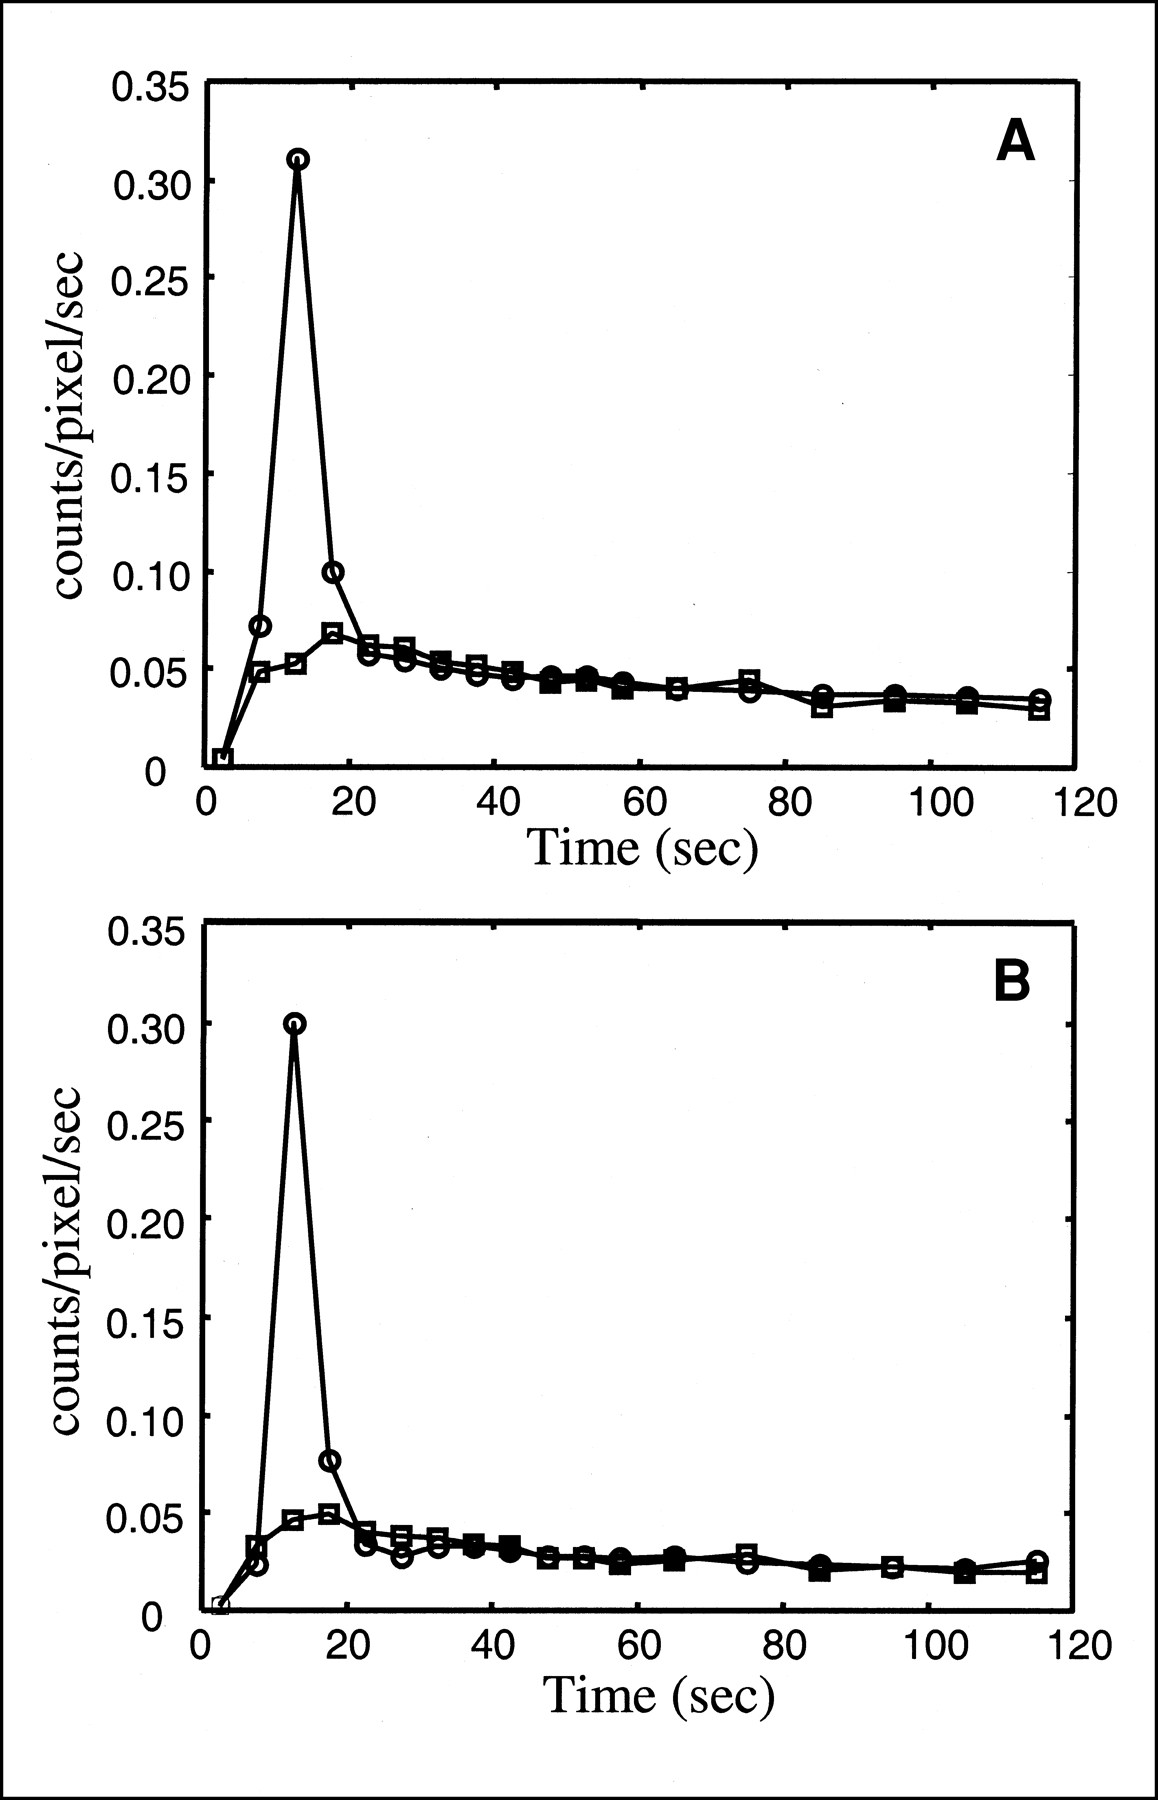
An input function and a regional-tissue TAC obtained from factor analysis are shown in Figure 4A, and a TAC obtained from the ROI method is shown in Figure 4B. In all animals, myocardial regional-tissue TACs were extracted successfully by factor analysis.

Representative TACs of left ventricle and myocardium. Curves were obtained by factor analysis (A) and ROI method (B).
rMBF Calculation and Validation
The total calculation time for the first and second steps of the factor analysis and flow estimation was <2 min. The correlation between rMBF by factor analysis and rMBF by microsphere studies was good, with a correlation coefficient of 0.95 (P < 0.0001; Fig. 5A). The correlation between rMBF by the ROI method and rMBF by microsphere studies was also good, with a correlation coefficient of 0.93 (P < 0.0001; Fig. 5B). rMBF by the ROI method was slightly lower than rMBF by microsphere studies.

Correlations between rMBF by factor analysis and rMBF by microsphere studies (r = 0.95; y = 0.95x + 0.26) (A) and between rMBF by ROI method and rMBF by microsphere studies (r = 0.93; y = 0.88x − 0.01) (B).
Table 1 shows the differences between the rMBF obtained by microsphere studies and the rMBFs obtained by factor analysis and the ROI method. rMBF by factor analysis tended to be higher than rMBF by microsphere studies. In the inferior wall, the difference was the largest. rMBF by the ROI method tended to be lower than rMBF by microsphere studies. The estimated spillover fraction was 0.1 ± 0.1 by factor analysis and 0.2 ± 0.1 by the ROI method.
Differences in rMBFs Obtained by Factor Analysis, ROI Method, and Microsphere Studies
DISCUSSION
In dynamic nuclear medicine imaging, factor analysis is now considered a powerful and robust tool to obtain pure physiologic TACs and corresponding images. Factor analysis assumes that the observed dynamic data can be represented as a linear combination of a reduced set of images, which represent most of the observed data, and their TACs. Factor analysis has been shown to have many applications and successful results in nuclear medicine (5–9,13) and has the additional benefit of eliminating user-dependent ROI analysis (14). However, the general acceptance of factor analysis has been prevented by a negative aspect—the difficulty of interpreting the physiologic meaning of factors extracted using only the statistical characteristics of the data. The spatial and time resolutions of the nuclear medicine instruments have also limited the accuracy of factor analysis in extracting pure TACs.
The main finding of this study is that rMBF can be calculated directly from dynamic H215O PET images through two-step factor analysis without the aid of C15O blood-pool scans. Usually, H215O PET has required an additional C15O blood-pool scan to determine ROIs because of the poor quality of dynamic H215O images. This study showed that C15O scanning is no longer needed for myocardial H215O PET. Therefore, the additional cost and radiation dose from C15O scanning can be reduced by virtue of factor analysis, and the method can easily be applied to patients undergoing H215O PET for rMBF estimation even in PET centers without instruments for gas studies.
In the first step, we used all the slices as input data for the factor analysis; thus, three factor images (right and left ventricles and myocardium) for all slices and input function were obtained. The relative error of AUC between the input functions obtained by factor analysis and those obtained by arterial sampling was approximately 24%, mainly because of fluctuations in the tails of the curves. The shape of both curves, however, was nearly the same except for the expected delay and dispersion of radial artery sampling. The slight difference in the tails of both curves may have been caused by counting errors in the arterial sampling. Because the shape of the initial part of the input function is mainly what affects rMBF, fluctuations in the tails of the curves are not a problem in flow estimation.
The second step of the factor analysis enabled extraction of pure regional-myocardium TACs by factor analysis without careful drawing of subtraction-defined ROIs on the myocardium (1–3). In the conventional ROI method, the regional-tissue TACs are user dependent; however, using factor analysis we could get pure regional-tissue TACs. Therefore, rMBF could be calculated robustly with the single-compartment model using the tissue TACs obtained from factor analysis. Although the estimated rMBFs obtained by factor analysis were similar to those obtained by the conventional ROI method, factor analysis is preferable to the ROI method because of the subjectivity of the latter.
Factor analysis has been applied successfully to images with a high signal-to-noise ratio (SNR), such as dynamic 13NH3 or 18F-FDG PET images (5,6). Because factor analysis for dynamic images with a low SNR was considered difficult, a modeling method was proposed for dynamic H215O PET (9,15). In this study, we reduced statistical fluctuation by aggregating into 6 planes the 24 planes that were selected to include only the cardiac region. The pixels were also aggregated into an 8 × 8 region before factor analysis was applied to the dynamic images. Moreover, in the first step of the factor analysis, the inherent difficulty of applying factor analysis to dynamic H215O PET could be overcome using the multiplane dynamic data.
The low SNR of dynamic H215O PET images might have influenced factor analysis, causing inaccurate oblique rotation during apex seeking (16,17). Inaccuracy in apex seeking affects the quantitative results for rMBF by using the TACs misrepresented by factor analysis. A trend was seen toward slightly higher rMBFs by factor analysis than by the ROI method and microsphere studies. This bias might have been caused by a low SNR for the dynamic H215O PET images in the ROI chosen for the second step of the factor analysis. Contrary to the first step of the factor analysis, which used all six planes, the second step of the factor analysis used only a quarter of a slice for extraction of the regional-tissue TAC. Although several methods have been proposed to improve the efficiency of apex seeking by overcoming this shortcoming, these methods were not applied in this study.
Spillover fraction was 0.1 ± 0.1 by factor analysis and smaller (0.2 ± 0.1) by the ROI method, but the difference was not significant. Although we expected that use of TACs obtained from the second step of the factor analysis would remove the spillover effect from rMBF estimation, a fraction of spillover remained, indicating that our factor analysis did not perfectly separate tissue TACs from blood TACs. Nonetheless, we speculate that factor analysis was better than the subjective ROI drawing method at least for obtaining regional-tissue TACs. Further analysis is warranted to find the differences between blood-pool factor images and C15O blood-pool images.
Activity was found in the lowest planes outside the myocardium. We suspect that this activity was from the liver. Although the earlier part of a TAC for liver would be different from that for myocardium because the liver is perfused mostly from the portal vein, the liver could have mimicked the TAC of myocardium. Whether similar activity would show up on human myocardial dynamic H215O PET images is unknown. If such adjacent-organ activity were to appear, further studies would be required to exclude it.
Hermansen et al. (9) reported that the SNR of a bolus injection was higher than that of a slow infusion because the shapes of the blood and myocardium TACs differ more from each other with a bolus injection. If the tracer is infused slowly, the left ventricular and myocardial factor TACs may be less distinctive on factor analysis. If one wishes to separate the TAC of the injected H215O in the myocardium from the TACs of radioactivity in the ventricles, rapid injection of the tracer by bolus may be better than slow infusion. In contrast, bolus injection with a high dose of H215O may induce a dead-time effect, underestimate the input function, and thus overestimate rMBF. Therefore, injection time should be determined carefully after considering both the dead-time effect of a bolus injection and the lower probability that a slow infusion will produce clearly distinctive factor images.
CONCLUSION
This study showed the possibility of measuring rMBF using only factor analysis of dynamic H215O PET images, without any subtraction or modeling. Unlike the ROI method, which requires careful drawing of ROIs to minimize spillover or partial-volume effects, the two-step factor analysis proposed in this study enabled robust estimation of rMBF without additional C15O PET.
ACKNOWLEDGMENTS
The authors thank Hong Jae Lee, Yong Geun Kim, and the PET center staff of Seoul National University Hospital for synthesizing the H215O and helping with the PET studies and Sang Young Park, Myung Jin Jang, Kang Jun Seo, and Young Ae Kim for helping with the animal experiments. This study was supported by grant 04-1999-062-0 from Seoul National University Hospital and a grant from the Korea Institute of Science & Technology Evaluation and Planning.
Footnotes
Received Sep. 18, 2000; revision accepted Jan. 10, 2001.
For correspondence or reprints contact: Dong Soo Lee, MD, PhD, Department of Nuclear Medicine, Seoul National University College of Medicine, 28 Yungundong Chongnogu, Seoul 110-744, Korea.
REFERENCES
In this issue


Jump to section
Related Articles
Cited By...
- Generation of Parametric Image of Regional Myocardial Blood Flow Using H215O Dynamic PET and a Linear Least-Squares Method
- Myocardial Blood Flow Measurement by PET: Technical Aspects and Clinical Applications
- Improvement of Algorithm for Quantification of Regional Myocardial Blood Flow Using 15O-Water with PET
- CT Attenuation Correction for Myocardial Perfusion Quantification Using a PET/CT Hybrid Scanner
- Bicycle Exercise Stress in PET for Assessment of Coronary Flow Reserve: Repeatability and Comparison with Adenosine Stress