


Abstract
A whole-body PET scanner, without interplane septa, has been designed to achieve high performance in clinical applications. The C-PET scanner, an advancement of the PENN PET scanners, is unique in the use of 6 curved NaI(Tl) detectors (2.54 cm thick). The scanner has a ring diameter of 90 cm, a patient port diameter of 56 cm, and an axial field of view of 25.6 cm. A 137Cs point source is used for transmission scans. Methods: Following the protocols of the International Electrotechnical Commission ([IEC] 61675-1) and the National Electrical Manufacturers Association ([NEMA] NU-2-1994 and an updated version, NU2-2001), point and line sources, as well as uniform cylinders, were used to determine the performance characteristics of the C-PET scanner. An image-quality phantom and patient data were used to evaluate image quality under clinical scanning conditions. Data were rebinned with Fourier rebinning into 2-dimensional (slice-oriented) datasets and reconstructed with an iterative reconstruction algorithm. Results: The spatial resolution for a point source in the transaxial direction was 4.6 mm (full width at half maximum) at the center, and the axial resolution was 5.7 mm. For the NU2-1994 analysis, the sensitivity was 12.7 cps/Bq/mL (444 kcps/μCi/mL), the scatter fraction was 25%, and the peak noise equivalent count rate (NEC) for a uniform cylinder (diameter = 20 cm, length = 19 cm) was 49 kcps at an activity concentration of 11.2 kBq/mL. For the IEC protocol, the peak NEC was 41 kcps at 12.3 kBq/mL, and for the NU2-2001 protocol, the peak NEC was 14 kcps at 3.8 kBq/mL. The NU2-2001 NEC value differed significantly because of differences in the data analysis and the use of a 70-cm-long phantom. Conclusion: Compared with previous PENN PET scanners, the C-PET, with its curved detectors and improvements in pulse shaping, integration dead time, and triggering, has an improved count-rate capability and spatial resolution. With the refinements in the singles transmission technique and iterative reconstruction, image quality is improved and scan time is shortened. With single-event transmission scans interleaved between sequential emission scans, a whole-body study can be completed in <1 h. Overall, C-PET is a cost-effective PET scanner that performs well in a broad variety of clinical applications.
- PET
- performance measurements
- C-PET
- National Electrical Manufacturers Association
- International Electrotechnical Commission
- NaI PET
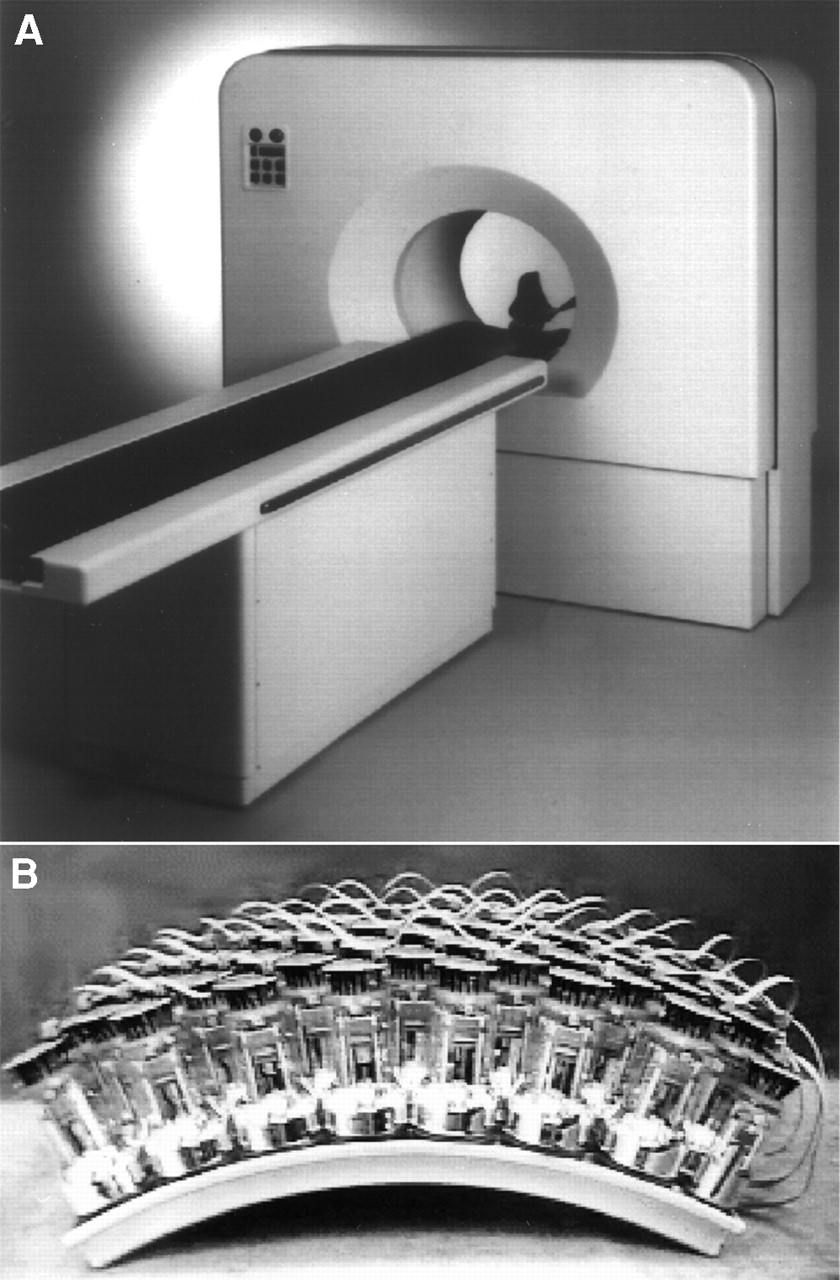
The C-PET scanner (ADAC/UGM, Philadelphia, PA; Fig. 1A) belongs to a new generation of clinically oriented PET scanners. It was installed in June 1998 in our PET center and since then has been used for >4,000 studies. Like its predecessors, the PENN PET 240H (1) and 300H and the HEAD PENN PET (2) scanners, it is intended to be a low-cost yet high-performance system optimized for clinical applications. It has several innovations over these older systems, including the use of curved crystals (Fig. 1B), an extended transaxial field of view (FOV), faster electronics, and better energy resolution. The C-PET scanner comprises 6 curved thallium-doped sodium iodide (NaI(Tl)) detectors with a ring diameter of 90 cm and an axial FOV of 25.6 cm. The relatively low stopping power of NaI(Tl), compared with other scintillator materials used in PET, is partially compensated for by the large axial FOV and scanning without septa. These are, in turn, possible because NaI(Tl) has a good energy resolution of 11%, so the lower energy threshold can be raised to 435 keV to limit the scattered events without reducing the true events. The good energy resolution is also advantageous for postinjection transmission scanning with a 137Cs source (662 keV γ-rays).

(A) C-PET scanner. (B) CurvePlate crystal (Bicron, Newbury, OH) with 48 photomultiplier tubes. Dimensions of crystal are 47 cm (circumferential) × 30 cm (axial) × 2.54 cm (thick).
The purpose of this study was to characterize the performance, both physical and clinical, of the C-PET scanner. The article will briefly describe the individual tests and discuss the value of the measurements as well as differences that occur because of deviating definitions between the performance standards. Preliminary results were reported at the 45th and 46th annual meetings of the Society of Nuclear Medicine (3–5) and at the 1999 and 2000 Medical Imaging Conferences of the Institute of Electrical and Electronics Engineers (6,7).
MATERIALS AND METHODS
PET System
Each of the 6 NaI(Tl) crystals (Fig. 1B) is optically coupled to 48 photomultiplier tubes (PMTs) 62 mm in diameter, and the PMTs on each crystal are connected to 4 overlapping trigger channels for event detection. These 4 trigger channels define 7 zones of PMTs that determine which PMTs are read out and used to calculate the position. The analog PMT signals are converted to 8-bit digital values and are clipped from 1 μs to approximately 240 ns, which reduces pileup. The digital signals are sampled at 40-ns intervals, and the digital samples are summed (integrated) for 240 ns once a trigger indicates that a valid coincident event (or single event, when operating in single-event mode) has occurred. The coincidence time window is 8 ns. The position calculation is performed by the position processing unit, which uses 2 identical calculator sections to simultaneously process both events in a coincidence. The local centroid position is calculated using a 7-PMT cluster and includes gain and baseline corrections (8).
An energy correction is applied to compensate for local variations in the measured energy of a scintillation event, resulting in more uniform energy resolution over the detector and a system energy resolution of 11%. Energy discrimination is performed by applying a lower and upper energy threshold of 435 and 665 keV, respectively. As with other position-sensitive detectors, the calculated position does not correspond exactly to the point at which the scintillation occurred. To remove systematic errors, an experimentally determined 2-dimensional position offset is added to the calculated position. This procedure is called distortion removal (9).
At this stage, each event is binned into “4-dimensional” projection coordinates. Optionally, the events can be stored in list mode (event-by-event) format, which is particularly suitable for sparse data and for research purposes. The structure of the sinogram files is typically 128 (radial bins) by 96 (azimuthal angles), sorted into 7 tilt angles (out-of-plane or polar angle θ). For brain imaging, the transverse FOV is 256 mm and slice separation is 2 mm, leading to 128 slices. For whole-body imaging, the transverse FOV is 576 mm and slice separation is 4 mm, leading to 64 slices. For research purposes, the sinogram size can be increased to 256 by 192, the number of tilt angles can be varied from 1 to 15, and the transaxial FOV can be reduced to 128 mm. This allows radial sampling from 0.5 mm per bin to 4.5 mm per bin. The bin width is constant for all radial positions.
Before image reconstruction, scatter and random events are corrected using background subtraction. The background is assumed to have either a flat shape (uniform background) or the shape of a parabola in the radial direction (nonuniform background). The resulting background function is fit to the data outside the body contour in the sinogram and is then subtracted from the sinogram, with negative values being set to zero. Background caused by random coincidences tends to be flat (uniform) in the sinogram, whereas background caused by scattered radiation has a curved profile. By varying the curvature of the fitted parabola, one can adjust the calculated background to approximately match the actual background.
Measured attenuation correction is applied after Fourier rebinning (10,11), which converts the 4-dimensional sinograms into stacked 2-dimensional sinograms. Transmission scanning is performed using a 137Cs single-event source of 662 keV. The point source is axially centered in the FOV, and 1 transmission scan covers an axial FOV of 112 mm. Oblique lines of response are rebinned using the single-slice rebinning method (12). This might cause problems if the object density changes significantly within a small, off-center region and work on possible solutions, such as Fourier rebinning or fanbeam reconstruction, is in progress. The patient bed is moved between rotations for complete coverage of the scanner FOV. Because the source is axially centered, the end positions require additional transmission scans (e.g., a single bed position requires 3 transmission scans, whereas 5 bed positions with a pitch of 112 mm require 7 transmission scans). In this case, the reconstructed axial length is 70.4 cm. Transmission scanning can be performed after injection because the 511-keV events from the patient can be separated from the 662-keV events from the single-event source by energy discrimination. The lower- and upper-level discriminators are set at 595 and 860 keV, respectively, during transmission scanning. In addition, an emission contamination, or mock scan, is acquired to correct for any 511-keV events that are measured in the transmission energy window (13). Optionally, the reconstructed transmission image can be segmented, or remapped (14), to reduce the impact of noise and scatter. Typical scan durations at each bed position are 6 min for an emission scan, 55 s for a transmission scan (for 1 rotation of the 137Cs source), and 22 s for the mock scan. For whole-body imaging, the transmission and emission scans are interleaved as the patient is moved through the gantry. The axial sensitivity profile of a single bed position is triangular, and the overlap between 2 neighboring bed positions is approximately 50% to achieve an axially uniform sensitivity profile.
Image reconstruction for whole-body and brain studies is performed using an iterative algorithm that is based on the ordered-subsets expectation maximization method (15) or the row action maximum-likelihood algorithm (RAMLA) (16,17). The missing data in the gaps between the detectors are estimated using the constrained Fourier technique (18) and are needed when using Fourier rebinning to reduce the data to 2-dimensional sinograms before image reconstruction. The reconstructed volume image has the same number of slices and slice separation as the raw sinogram data and an image pixel size of 2.0 mm (brain) or 4.0 mm (whole body). In combination with a 128-mm transaxial FOV and large sinograms, the smallest achievable image pixel size is 0.5 mm.
Performance Measurements
The task of performance measurements is to define an experimental setup that allows one to determine the imaging characteristics of a scanner, to compare different scanners, and to understand and predict the scanner behavior for patient studies. The measurements described here mainly follow the guidelines outlined in the National Electrical Manufacturers Association (NEMA) NU2-1994 standard on performance measurements of positron emission tomographs (19) and standard 61675-1 of the International Electrotechnical Commission (IEC) (20). Furthermore, we performed some of the measurements recently adopted by NEMA to update the existing standard to accommodate a new generation of 3-dimensional PET scanners with longer axial FOVs (>17 cm). We refer to the updated standard as NEMA NU2-2001.
Spatial Resolution.
The axial resolution was determined by a series of point source (all dimensions < 1 mm) measurements in air. The NU2-2001 standard also uses the point source to determine the transaxial resolution, whereas the IEC and NU2-1994 standards require line source (transaxial dimensions < 1 mm) measurements in air. The point source was positioned in the axial center of the FOV (z = 0 cm) and halfway between the axial center and the edge of the FOV (z = 6.4 cm). Transaxially, the point source was positioned at (x,y) = (0,0), (10,0), and (0,10) cm. The line source (length, approximately 5 cm) was positioned parallel to the axis of the tomograph at radial positions of r = 0, 5, 10, 15, 20, and 25 cm. Because of its continuous crystals, the C-PET scanner has no “sweet spot” at (0,0), unlike PET scanners with discrete crystals that are oversampled in the center. Resolution measured at the position (0,0) is, therefore, equivalent to results obtained with a radial offset of 1 cm as prescribed in the standards. For the central position, a sinogram sampling of 0.5 mm per bin and an image pixel size of 0.5 mm were used. For the off-center position at r = 10 cm, a sampling of 1.0 mm per bin and a pixel size of 1.0 mm were used. In both cases, the axial sampling was 2 mm per slice. The images were reconstructed using filtered backprojection, with a ramp filter and a cutoff at the Nyquist frequency.
In accord with the IEC and NU2-1994 standards, horizontal, vertical, and axial profiles (1 voxel wide) were drawn through the pixel with the maximum value in the image. The full width at half maximum (FWHM) was determined using linear interpolation; the equivalent width, EW, was calculated according to the IEC protocol as EW=∑i Ci . pixel size/maximum pixel value, where ∑i Ci is the sum of the counts in the profile between the limits defined by 1/20 of the maximum pixel value on both sides of the peak (20). The results were averaged over the horizontal and vertical directions for source positions at equal radial distances r from the center of the FOV. For the line source, the transaxial resolution was also averaged over 16 slices.
Scatter Fraction.
The NU2-1994 and IEC scatter fraction is estimated using a single 18F line source, which is scanned in a water-filled cylinder phantom (diameter [ø] = 20 cm, length = 19 cm) at 3 radial positions (r = 0, 45, and 90 mm). The sinogram data were analyzed according to NU2-1994 (19) and IEC (20), whereby the IEC standards typically lead to a higher scatter fraction (21). Because the C-PET scanner has an axial FOV of 25.6 cm, the test phantom (19 cm in interior length) does not cover the whole axial FOV and values for only the central 17 cm of the axial FOV can be determined (19,20). Also, the measurement does not account for scatter contamination from activity outside the FOV that is present in patient studies.
To overcome the weakness of the previous standards, we investigated a new phantom (NU2-2001) that consists of a 70-cm line source in a polyethylene cylinder (ø = 20 cm) with a water equivalent density of 1.0 g/mL. For ease of handling, the cylinder is cut into 4 segments. The tube containing the activity has a length of 70 cm and a volume of approximately 5.7 mL. The volume of the phantom body is 22 L. The radial position r = 45 mm for the line source is assumed to have scatter representative of that in a homogeneous activity distribution in a phantom of the same size. In the NU2-2001 protocol, the sinogram data are analyzed similarly to the NU2-1994 method.
Sensitivity.
The sensitivity expresses the correlation between activity within the FOV and the number of acquired counts in the absence of dead-time effects. The NU2-1994 and IEC protocols use a 19-cm-long cylinder (ø = 20 cm) for this measurement. There are several concerns about this method. The counts are attenuated within the phantom, and measured counts contain scattered events that are then corrected by multiplying the individual slice sensitivities Si by (1 − SFi), where SFi is the relative scatter fraction for the slice i. Depending on the standard used (NU2-1994 or IEC), this leads to different values for the sensitivity; in addition, the analysis is limited to the central 17 cm of the axial FOV. Because the C-PET scanner has an axial FOV of 25.6 cm, this method will lead to an underestimation of the actual sensitivity. Therefore, we also measured the absolute sensitivity using a phantom similar to that proposed by Bailey et al. (22) (NU2-2001). A 70-cm-long steel tube (inner ø = 3.9 mm, outer ø = 6.4 mm) and 4 concentric sleeves (wall thickness, 1.25 mm) were used. The gap between the sleeves was 0.35 mm. The sensitivity was measured for different wall thicknesses (5 measurements) and extrapolated to zero-wall thickness. The advantages of this method are no significant self-attenuation or scatter contamination, simplified measurement from a physical point of view, and suitability for scanners with a long axial FOV.
Count-Rate Behavior.
The count-rate measurement indicates the relationship between acquired counts and activity level. The count-rate behavior was measured with 5 different phantoms, whereby the phantoms were scanned over several half-lives of the decaying isotope to cover a broad range of counting situations. The first phantom was a 19-cm-long uniform cylinder (ø = 20 cm, volume = 5.8 L, NU2-1994 and IEC). The second and third phantoms were the IEC cardiac and abdomen count-rate phantoms (active volume = 45 mL) (20), whereby the phantom was scanned without arms, because we typically obtain our whole-body scans with arms outside the FOV. Because all 3 phantoms have a length shorter than the axial FOV, their predictive power with regard to clinical scanning is naturally limited. Therefore, we also measured a 70-cm-long uniform cylinder (ø = 20 cm, volume = 22 L). This phantom is long enough to address issues arising from activity outside the FOV, as well. Given the size of this phantom, we had difficulty preparing a solution of uniform activity and handling the phantom. The simplified 70-cm line source phantom from the scatter measurement has also been adopted by NU2-2001 for the count-rate measurement.
Data from the 19-cm-long uniform cylinder were analyzed according to the IEC and NU-2 standards, meaning that only the central 17 cm of the axial FOV and only events within a 12-cm radius were considered. For the cardiac and abdomen phantoms, only the central 17 cm were considered, but no transaxial restrictions were applied. For these 2 measurements, the background subtraction method was used to estimate scattered and random events. Data from the 70-cm uniform cylinder were analyzed using background subtraction, and only events within a 12-cm radius were considered. Analysis of the 70-cm line source data was analogous to the scatter fraction analysis, allowing a simple, potentially more accurate estimate of true, scattered, and random events. For the comparison with patient count-rate data, all phantom data were also processed following a clinical protocol, meaning that background subtraction was used to correct for scatter and random events, and all events within the sinograms were considered (no transaxial restrictions). Therefore, the total count rates are expected to be higher than the count rates found according to the performance standards. To compare the different phantom and clinical data, we plotted the count rates against single count rates, which correlate quasilinearly with the activity seen by the scanner.
Count-Loss Correction.
To quantitatively measure source activity distributions under widely varying count-rate conditions, the PET scanner must compensate for dead-time losses and random events. For this test, the count-rate data described above were reconstructed with all corrections applied, including those for count losses and physical decay. Regions of interest (ROI) were drawn on each image, and the counts were plotted as a function of the activity concentration. Ideally, all ROIs should have the same number of counts, leading to a line parallel to the abscissa. Deviations from this parallel line indicate errors in the count-loss correction or the random-event subtraction.
Recovery Coefficients.
Measurement of the recovery coefficients is required only by the IEC standard. A set of 6 hollow spheres with different diameters (ø = 10, 13, 17, 22, 28, and 37 mm) filled with 18F solutions of identical activity concentrations was placed in a water-filled cylinder (ø = 20 cm, length = 19 cm) (20), which was centered in the transverse FOV. The centers of the spheres were arranged to lie in 1 plane in the center of the phantom. Two axial positions were measured: spheres centered in the axial direction (z = 0 cm) and spheres halfway between the axial center and the edge of the axial FOV (z = 6.4 cm). The recovery coefficients RCi = Ci/C6 were calculated as previously described (21), where Ci were the ROI counts per pixel per second for sphere i = 1,…, 6, with sphere 6 being the largest sphere. Data were acquired with a 4-mm slice spacing and a 256-mm transverse FOV, and images were reconstructed using filtered backprojection.
Image-Quality Phantom.
Existing performance measurements describe mainly a single parameter, often requiring best possible statistics. Under clinical conditions, the scan duration and activity concentrations are constrained, and the count statistics are limited. A measurement has been designed by NU2-2001 to assess the trade-off between different parameters (e.g., sensitivity, scan duration, activity level, shielding, and septa) (23). The task is to scan a 1-m axial length within 1 h, including transmission and emission scans and using clinically realistic activity levels. The phantom is the IEC whole-body phantom with the sphere inserts of the IEC recovery coefficient phantom and a cylindric foam insert (ø = 50 mm; P = 0.3 g/cm3). Because the IEC whole-body phantom is only 20 cm long and activity outside the FOV is expected to degrade image quality, the phantom is combined with the 70-cm-long line source count-rate phantom. A sketch of the phantom configuration is given in Figure 2. The image-quality phantom test supersedes the NU2-1994 tests of scatter correction, attenuation correction, and image uniformity.

Transaxial (A) and axial (B) views of phantom setup for image-quality measurement. Four smallest spheres are hot, and 2 largest spheres are cold. Foam insert has density of 0.3 g/mL.
To scan 1 m with the C-PET scanner requires 8 bed positions and allows 7.5 min per position: a 6-min emission, a 1-min transmission, and a 30-s mock scan. The activity concentration was 3 kBq/mL, which is comparable with the activity concentration of a typical whole-body scan and gives a total count rate of approximately 65 kcps. The sphere-to-background activity ratios (Ract) for the 4 hot spheres were 8:1 and 4:1. To determine the reproducibility of the measurement and the error of the results, scans were repeated 4 times. In addition, 3- and 12-min scans were acquired to investigate the dependence of the results on scan duration. Data were acquired with a 4-mm slice spacing and a 576-mm transverse FOV, and images were reconstructed using filtered backprojection.
ROIs with diameters equal to the physical inner diameter of each sphere were drawn on the slice through the centers of the sphere. Twelve ROIs of the same sizes as those for the spheres were drawn throughout the background in the central slice and in the slices ±0.8 and ±2.0 cm away. The coefficient of variation (covariance) of these 60 background ROIs was determined for each sphere size as a measure of the background variability (CRCbkgd). The hot-sphere contrast recovery coefficient (CRChot) was calculated as:
 Eq. 1
Eq. 1
For the cold spheres and the foam insert, the contrast recovery coefficient (CRCcold) was calculated as:
 Eq. 2
Eq. 2
Clinical Images.
To show the quality of clinical images, we selected a representative 18F-FDG whole-body study, which constitutes approximately 85% of our studies.
RESULTS
Spatial Resolution
The transverse and axial resolution results (FWHM and EW) are given in Table 1. The spatial sampling had to be changed for different source positions to cover a larger FOV for the radial off-center positions. Compared with optimum sampling, this further degrades the results (as required by the performance standards) but better reflects the resolution under clinical conditions, in which worse sampling is used. For example, the FWHM for a line source in the center (r = 0 cm) is 4.7 mm for a sinogram sampling of 0.5 mm per bin and an image pixel size of 0.5 mm but degrades to 6.2 mm when a sinogram sampling of 2.0 mm per bin and an image pixel size of 2.0 mm are used (brain imaging parameters), as was the case for the line source measurement (Table 2).
Spatial Resolution Measured with Point Source
Spatial Resolution Measured with Line Source
It is well known that the response functions are not gaussian and have a long tail. The EW aims to account for these tails, and as the results show, the EW is generally worse than the FWHM. During data analysis, the EW also proved to be an unstable value. Part of this instability may be caused by the definition of EW, which depends strongly on the maximum value in the profile. Combined with uncertainties in the measurement, this explains why in Table 2 the EW is worse at r = 5 and 10 cm than at r = 15 cm.
Scatter Fraction
The average scatter fraction according to NU2-1994 is 25.0%; according to IEC it is 31.6%, and for the 70-cm line source it is 35.0%. Because of contributions from out-of-FOV activity, the 70-cm phantom has the highest scatter fraction. The differences in the data analysis procedures for the IEC and NU2-1994 standards cause a significant difference in the calculated scatter fraction, whereby the IEC value is 26% higher than the NU2-1994 value. The NU2-2001 slice scatter fractions, given in Figure 3, have a maximum in the center of the axial FOV, from which they slowly decrease toward the edge of the FOV. As expected, the scatter-fraction curve is symmetric.

NU2-2001 scatter fraction as function of axial position.
Sensitivity
The system sensitivity according to NU2-1994 is 12.7 cps/Bq/mL (444 cps/μCi/mL); according to IEC it is 11.6 cps/Bq/mL (314 cps/μCi/mL), and for the 70-cm line source (NU2-2001) it is 3.0 cps/kBq. The NU2-1994 sensitivity is 9.1% higher than the IEC sensitivity because of the difference between the NU2-1994 and IEC scatter fractions. According to the NU2-1994 and IEC standards, only slices in the central 17 cm (66%) of the axial FOV are used for data analysis. The NU2-2001 procedure uses the whole FOV, but the result is not directly comparable with the IEC and NU2-1994 results because of differences in the measurement (note the differences in units).
Count-Rate Behavior
The count-rate behavior for the 5 different phantoms is shown in Figures 4A–4E. The plots show that the count-rate curves differ significantly for the different phantoms. Figure 4A shows also that, because of the different scatter fractions measured according to IEC or NU2-1994, the maximum true count rate and noise equivalent count rate (NEC) are higher by 9.6% and 20.0%, respectively, for the NU2-1994 measurement than for the IEC measurement. The total and the random count rates are not affected by the difference in scatter fractions. The two 70-cm-long phantoms (Figs. 4B and 4C) are the only 2 phantoms that have a similar count-rate behavior. Figure 4F compares phantom count rates with actual patient count rates. The count rates of the 70-cm-long phantoms correspond to those for patient data (cardiac and whole-body scans), whereas the 19-cm-long cylinder seems to give an upper limit for brain and head scans. Because we have a dedicated brain scanner in our PET center, we rarely perform brain imaging on the C-PET scanner, and only a few data points for brain imaging are available. The IEC abdomen phantom gives a count rate between the count rates for the 19- and 70-cm-long phantoms, whereas the IEC cardiac phantom has a count-rate behavior that does not correlate well with observed patient count rates. These values are derived mainly from FDG whole-body scans but include some cardiac studies as well. The discrepancy is caused mainly by the small amount of attenuating material in the IEC cardiac phantom and the unrealistically high ratio of true events to single events compared with patient scans. In addition, because the activity is in a small insert (volume, 45 mL), the activity concentrations in Figures 4D and 4E are much higher than in Figures 4A–4C. Furthermore, the count-rate curves show that the maximum NEC values are constrained on the C-PET scanner more by dead-time effects and less by the random-event count rate. The random events are always less than one third of the true count rate at the peak value of the true count rate.

C-PET count-rate behavior for 19-cm uniform cylinder (A), IEC cardiac count-rate phantom (B), IEC abdomen count-rate phantom (C), 70-cm uniform cylinder (D), and line source in 70-cm cylinder (E) (activity concentration is normalized to phantom volume of 22 L). Activity concentrations differ because of differences in phantom volume and size. (F) Comparison of phantom count rates with clinical count rates. Patient data are represented by small dots (>2,000 data points). For this plot, all measurements were processed like clinical data, using background subtraction and full transverse FOV (576 mm). This explains higher total count rate of phantom data shown in A–E. NEC = noise equivalent count rate; NU-2 = NU2-1994.
Count-Loss Correction
The results of the count-loss correction test are plotted in Figure 5. Although the correction works nearly perfectly for the 19-cm-long cylinder, the results for the other phantoms show a large error for high activities. This may be caused by the fact that a 30-cm-long uniform phantom is used to calibrate the C-PET scanner and the dead-time correction factor is determined from the single-event count rate of this calibration scan. For the 70-cm-long phantoms, single and random events contribute significantly to out-of-FOV activity, leading to a ratio of true events to single events roughly half that for the 19-cm-long cylinder. The IEC abdomen phantom shows a severe undercorrection, whereas the IEC cardiac phantom shows first an overcorrection for low count rates and then an even larger undercorrection for high count rates. The correction errors are certainly a problem that needs to be addressed. However, considering that most clinical activity concentrations are <2 kBq/mL, the actual error in clinical scans is <10%.
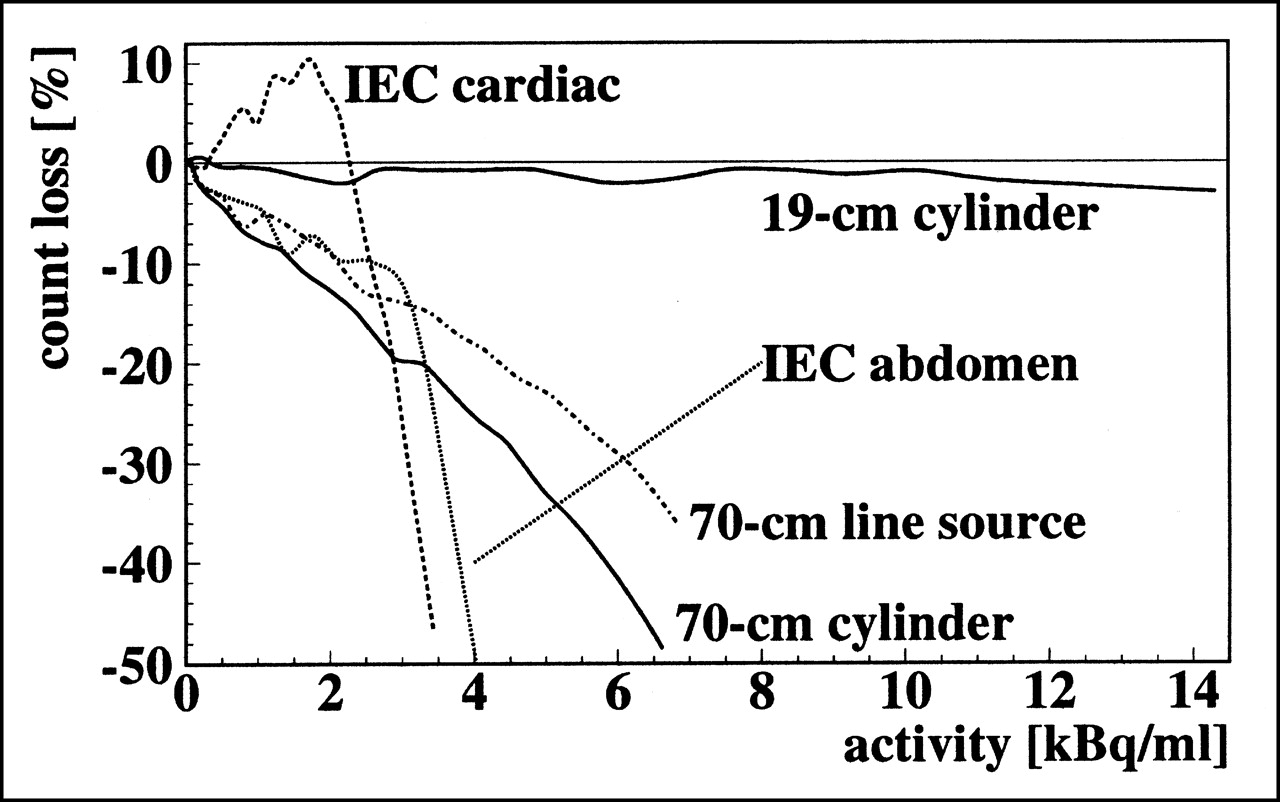
Count-loss analysis.
Recovery Coefficients
The recovery coefficients are given in Table 3. Compared with the largest sphere, the smallest sphere recovers approximately 50% of the activity. Because the recovery coefficients do not show a real asymptotic behavior, full recovery might not have been reached for the 37-mm-diameter sphere (as was assumed in the analysis). The phantom was measured at 2 axial positions (z = 0 and 6.4 cm) and both measurements led to comparable results, showing that the recovery was uniform in the axial direction.
Recovery Coefficients
Image-Quality Phantom
The results for the image-quality phantom are given in Tables 4 and 5. The CRC was practically independent of the scan duration, changing only slightly with the sphere-to-background ratio and increasing uniformly with increasing sphere diameter. The CRC was low for the small spheres, correlating with the observation that they could barely be detected in the image (Fig. 6). The best CRC was yielded by the foam insert, but despite its 50-mm diameter, the CRC was <70%, indicating that the applied background subtraction was insufficient. The variation in background decreased with increasing scan time and with increasing ROI diameter. Both can be expected, but why the background variations seen for the 8:1 ratio and small ROI are systematically larger than for the 4:1 ratio is not clear.

Image-quality phantom with sphere-to-background ratio of 8:1 for 3 scan durations: 3 min (A), 6 min (B), and 12 min (C).
Image-Quality Phantom Results for 8:1 Lesion-to-Background Ratio
Image Quality Phantom Results for 4:1 Lesion-to-Background Ratio
Clinical Images
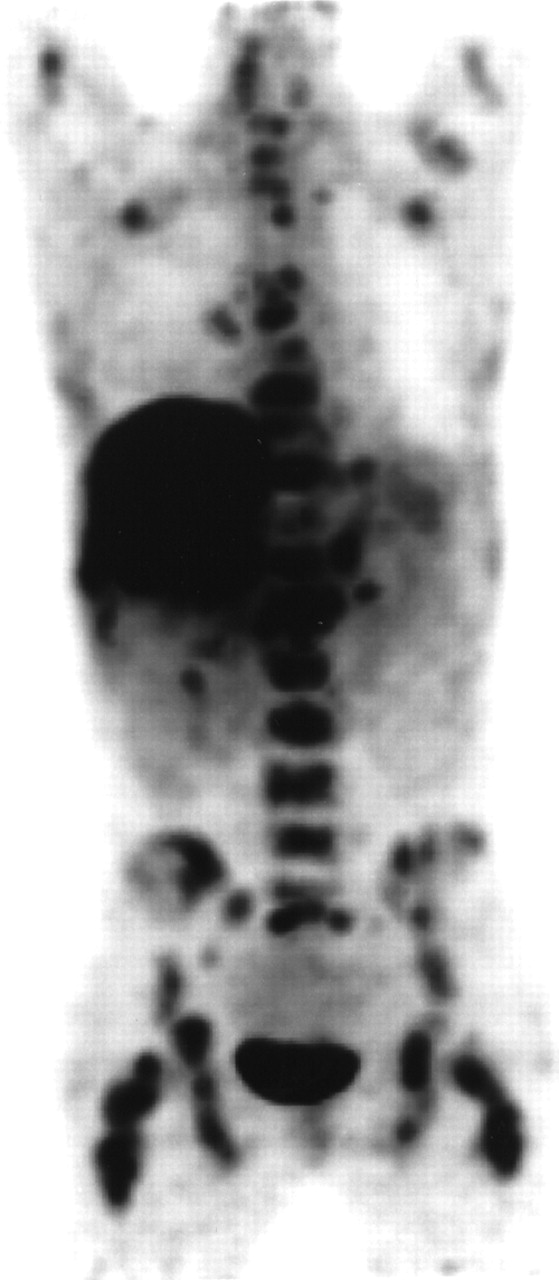
Figure 7 shows a 27-y-old woman (body weight, 47.7 kg) with multiple recurrences of Hodgkin’s disease. The patient received 132 MBq FDG intravenously, corresponding to an average activity concentration of 2.8 kBq/mL, and was scanned after an uptake of approximately 90 min according to our standard clinical protocol (4 bed positions, 6-min emission scan per bed position, 38-min total acquisition time including overhead for acquisition initialization, bed motion, and data download times). The rate of single events during the scan varied from 1.9 to 3.8 Mcps. The extensive uptake in the bone marrow of the spine, pelvis, femora, and ribs pointed to lymphomatous involvement, and a biopsy of the bone marrow was recommended. The increased uptake in the liver, compared with that on a previous scan, was consistent with the progression of the disease.

Representative coronal slice of FDG whole-body study.
DISCUSSION
Compared with the scanner geometry of the previous whole-body PENN PET scanners, which use 6 flat detectors in a hexagon, cylindric geometry optimizes spatial resolution throughout the FOV because of a reduction in the parallax errors and a decrease in the discontinuities across the gaps between detectors. Theses changes improve overall image quality. For example, the spatial resolution in the center in the transaxial direction is 4.9 mm for the PENN PET 240H (1) and 4.6 mm for the C-PET. The use of large, continuous detectors has the advantage of a sampling density that is the same in all directions, leading to a nearly isotropic spatial resolution. Furthermore, such a detector is less costly than other scintillators and requires far fewer PMTs and electronic channels. A limitation of the scanner design is the interdetector gaps, which result in missing data and sensitivity loss. The gaps between the crystals are minimized using virtual PMTs at the edge of the crystals (24), leading to a gap of approximately 2.8°, which causes a loss of 4.7% of the data. However, this is significantly less than for a block detector–based scanner with comparable geometry. Gap compensation for the C-PET scanner is important because of the relatively large size of the 6 gaps, whereas the gaps for a block detector are small and uniformly distributed and do not need compensation. Another limitation is the relatively high count rates in each detector that result from use of only a few large detectors. Special hardware and software techniques (e.g., pulse clipping, multiple triggers, local centroid position) are required to achieve a high overall count-rate capability. Compared with the PENN-PET 240H whole-body scanner, the C-PET, with its extended axial FOV, has higher sensitivity and count rates. For example, the NU2-1994 sensitivity is >300% higher for the C-PET, and the maximum true count rate for the 19-cm-long uniform cylinder is >200% higher for the C-PET.
The measured recovery coefficients are comparable with those of other whole-body systems. However, the comparison of recovery coefficients and CRCs from the image-quality phantom shows that measurement of a small lesion is much more difficult if the background is hot instead of cold and if the phantom is nonuniform. The low CRCs also indicate that the scatter and random-event corrections need to be improved.
Several projects to improve the C-PET scanner are under way. These include a scatter correction using a dual-energy window method (25), which takes advantage of the good energy resolution of NaI(Tl). The hardware has already been implemented, and the software implementation is soon to follow. In combination with measured random-event contamination using a delayed coincidence timing window, which will also be available soon, this method will make the background subtraction obsolete and improve correction of the data. Recent changes to the acquisition hardware and software allow an increased sinogram size (192 × 256) and larger images (256 × 256 or 288 × 288 pixels per slice). These will improve image resolution and should lead to higher measured recovery coefficients. We are investigating the use of 3-dimensional RAMLA (25). Initial results show that images reconstructed with 3-dimensional RAMLA have higher contrast and lower noise, compared with images reconstructed with ordered-subsets expectation maximization (16).
As expected, the differences in the performance standards lead to differences in the results. In particular, the method used to determine scatter in the IEC and NU2-1994 measurements affects not only scatter fraction but also sensitivity and count-rate measurements. Use of phantoms whose axial extent is shorter than the axial FOV of the scanner underestimates the actual count-rate capabilities of the scanner, compared with a scanner with a shorter axial FOV. This is also true for the NU2-1994 and IEC sensitivity values, which are underestimated because of the shortness of the phantom.
CONCLUSION
Compared with previous PENN PET scanners, the C-PET scanner, with its use of curved detectors and improvements in pulse shaping, integration dead time, and triggering, has an improved count-rate capability and spatial resolution. Along with refinements in the single-event transmission technique and iterative reconstruction, the image quality is improved and scan times are shortened. With single-event transmission scans interleaved between sequential emission scans, a whole-body study can be completed in <1 h. Overall, the C-PET scanner is cost-effective and performs well in a broad variety of clinical applications.
Concerning the performance standards, the current NU2-1994 and IEC measurements (which use 19-cm-long phantoms) characterize the best performance for PET imaging, whereas the new proposed measurements (using longer phantoms for scatter, count-rate, and sensitivity measurements) better characterize the performance under clinical conditions and are better suited to characterize 3-dimensional whole-body scanning. Specifically, the clinical count-rate behavior is better predicted by the 70-cm-long phantom than by the IEC whole-body phantoms. The use of 70-cm-long phantoms will also allow better comparison between scanners with different axial FOVs. In addition, measurements and data analysis are simplified in the NU2-2001 standard, which permits faster testing with little loss of information with regard to scanner performance.
Acknowledgments
The authors acknowledge the help and support of ADAC/UGM, in particular Gerd Muehllehner and Michael J. Geagan, as well as the contributions of the NEMA Imaging Task Group to design new performance measurements, in particular Michael E. Casey, PhD (CTI PET Systems, Knoxville, TN); Horace Hines, PhD (ADAC Laboratories, Milpitas, CA); Phil Vernon, PhD (SMV, Twinsburg, OH); Vilim Simcic, PhD (Siemens Medical Systems, Hoffman Estates, IL); and Charles Stearns, PhD (General Electric Medical Systems, Milwaukee, WI). This study was supported by grant DE-FG02-88ER60642 from the Department of Energy and, in part, by a Benedict Cassen Postdoctoral Fellowship from the Education and Research Foundation of the Society of Nuclear Medicine.
Footnotes
Received Sep. 18, 2000; revision accepted May 2, 2001.
For correspondence or reprints contact: Lars-Eric Adam, PhD, Department of Radiology, Hospital of the University of Pennsylvania, 3400 Spruce St., Philadelphia, PA 19104.
†Robin J. Smith died in April 2000.
REFERENCES
In this issue


Jump to section
Related Articles
Cited By...
- Sequential Positron Emission Tomography Using [18F]Fluorodeoxyglucose for Monitoring Response to Chemotherapy in Metastatic Breast Cancer.
- Expanding Role of Positron Emission Tomography in Cancer of the Uterine Cervix
- Imaging Characteristics of a 3-Dimensional GSO Whole-Body PET Camera
- Within-Patient Variability of 18F-FDG: Standardized Uptake Values in Normal Tissues
- PET Instrumentation and Reconstruction Algorithms in Whole-Body Applications
- Whole-Body Tumor Imaging Using PET and 2-18F-Fluoro-L-Tyrosine: Preliminary Evaluation and Comparison with 18F-FDG
- Comparative Evaluation of Lesion Detectability for 6 PET Imaging Platforms Using a Highly Reproducible Whole-Body Phantom with 22Na Lesions and Localization ROC Analysis
- PET Performance Measurements Using the NEMA NU 2-2001 Standard
- Staging of Regional Nodes in AJCC Stage I and II Melanoma: 18FDG PET Imaging versus Sentinel Node Detection
- New Developments in PET Instrumentation: Quo Vadis PET?