


Abstract
The lesion detectability performance of 6 PET imaging platforms has been compared using a highly reproducible whole-body phantom and localization receiver operating characteristic (LROC) analysis. Methods: A realistic whole-body phantom consisting of brain, thorax with lungs and liver, and pelvis with bladder was assembled and outfitted with 27 semipermanent 22Na lesions of various sizes and activity concentrations. The background compartments were reproducibly filled with 18F solutions. The phantom was imaged under the condition of equal emission scan time on 7 PET platforms: Advance, HR+, HR961, C-PET, IRIX, MCD, and AXIS. Imaging data were processed using manufacturer-supplied software and defaults, and LROC evaluation was performed using 11 human observers. Results: Near-nominal counting rates were obtained for the NaI systems, and the bismuth germanate (BGO) systems were operated well below nominal counting rates. The BGO systems provided the highest lesion detection performance, followed by the large-area dedicated NaI system, and hybrid PET gamma cameras. Lesion detectability was highly dependent on lesion size, with all systems exhibiting similar performance for 16-mm lesions but differentiated performance for lesions ≤12 mm. Conclusion: Reconstruction methodology can have a significant effect on lesion detectability. PET lesion detectability performance is correlated with system cost and imaging characteristics. For a particular imaging task, care should be taken to ensure that the scanner being used is appropriate and that the scan time is adjusted accordingly to ensure good lesion detectability.
A period of tremendous growth is being experienced by PET, which has become widely accepted for a range of cancer imaging applications. Past reimbursement policies have generally been set for the PET modality as a whole, generally based on data obtained from higher-end dedicated PET cameras. Manufacturers presently provide a wide range of dedicated and hybrid PET systems, and reimbursement policymakers are now taking into account platform-specific performance issues.
Several groups have investigated the differences in imaging performance for various PET and hybrid PET cameras (1–11), and numerous recent abstracts have compared hybrid PET with dedicated PET in particular (12–20). Most of these studies compare pairs of systems, and it is difficult to extend the conclusions to a larger number of systems. It is also difficult to perform clinical comparisons under identical physiologic conditions with controlled activity levels, and the truth regarding the presence or absence of disease is difficult to establish. Phantom work overcomes some of these limitations; however, the relatively simplistic phantoms generally available fail to provide a representative whole-body activity distribution, which is imperative if evaluations of fully 3-dimensional (3D) or counting rate-limited systems are to be performed.
The objective of this investigation was to comparatively evaluate the lesion detectability performance of a variety of PET-capable systems in as objective and reproducible a manner as possible. Acquisition times and whole-body activity distributions were held constant except where noted otherwise. A specialized whole-body phantom was assembled that used semipermanent 22Na focal lesions (t1/2 = 2.6 y) affixed within large background compartments filled with 18F (t1/2 = 110 min). The phantom was imaged under carefully controlled conditions on 7 different PET-capable imaging systems. The lesion detectability performance of 6 of the systems was then quantified and compared by performing a human observer study with localization receiver operating characteristic (LROC) analysis (21–24).
MATERIALS AND METHODS
Whole-Body Phantom
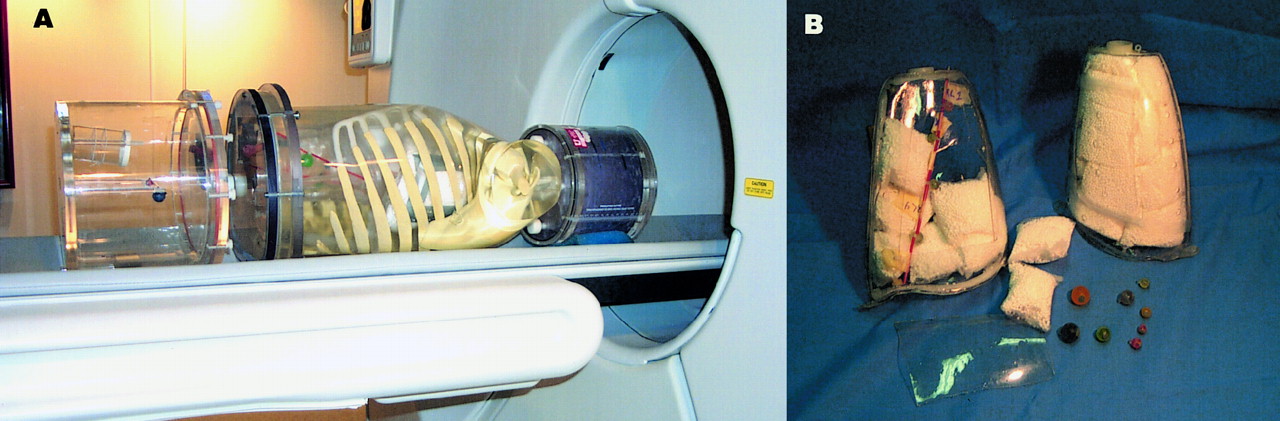
The whole-body phantom consisted of 3 main components as shown in Figure 1: a 3D Hoffman brain phantom (Data Spectrum Corp., Hillsborough, NC) (25), an anthropomorphic thorax phantom (Radiology Support Devices Inc., Long Beach, CA), and a 31.8 × 23.4 × 20.0 cm elliptic cylinder pelvis phantom (Data Spectrum). The thorax phantom contained lungs and a liver compartment, and a 110-mL plastic bottle was placed in the pelvis to simulate the bladder. The cardiac insert and central mounting assembly of the thorax were removed so that lesions could be placed in the mediastinum. The lungs were modified to be self-filling, using nylon mesh bags to hold the Styrofoam (The Dow Chemical Co., Midland, MI) beads in place. With this setup, the lungs passively filled as the thorax compartment was filled, thereby improving reproducibility and easing phantom preparation. Activity concentration in the lungs was measured to be 0.37 times that of the soft-tissue background using this setup, and lung density averaged 0.40 g/cm3.

(A) Whole-body phantom consisted of head, thorax, and pelvis compartments and contained 27 semipermanent 22Na lesions. (B) Lungs were custom-modified to permit passive filling. Styrofoam beads were contained using small nylon mesh bags, and lesions were permanently mounted using monofilament line.
Background Activity Concentrations
The activity concentrations used in the background compartments were based on 12 18F-FDG patient studies performed at our institution and were similar to representative values determined by Coleman et al. (4) and Turkington et al. (26). The values used for the standard activity phantom are listed in Table 1. The total activity present in the phantom was 111 MBq at the start of the scan. This value was chosen on the basis of estimated counting rate capabilities of the NaI-based PET cameras studied and is representative of a modest 185-MBq injected dose with 1-h delay before imaging.
Whole-Body Phantom Activity Distribution
22Na Lesions
Lucite spheres were machined to inner diameters of 7, 8, 12, and 16 mm (measured volumes of 0.17, 0.27, 0.91, and 2.10 mL, respectively) with a uniform wall thickness of 1 mm. The lesions were filled with an epoxy mixture containing dissolved 22Na activity and allowed to harden. The 22Na concentrations were accurately measured using Eppendorf pipettes (Brinkmann Instruments, Inc., Westbury, NY), and food coloring was used to help ensure homogeneous mixing and to color-code activity concentrations. Wipe tests and 99mTc-labeled controls were used to monitor radioactive containment.
The lesions were designed to have activity concentrations of 4, 6, 10, and 16 times that of soft-tissue background. Because measurable decay of the 18F background occurs over the duration of the scan, the semipermanent lesion activities were calibrated for the midpoint of the scans (24 min after scan start), and precise acquisition timing was maintained. Additionally, the 22Na activities were set to account for the difference in relative abundance for positron emission between 22Na (89.8%) and 18F (100%).
Twenty-seven lesions were mounted in the phantom. Rather than using nylon rods or other mounting hardware, which displace background activity, the lesions were mounted on monofilament line using small plastic spacers. Lesion sizes and activities were mixed to cover a wide range, some of which were easily detectable on all systems and others which were undetectable even on the highest-end systems studied. The lesions were arrayed throughout the phantom as follows: 4 in the brain, 5 in the mediastinum, 4 in each lung, 4 in the liver, 4 in the abdomen, and 2 in the pelvis.
Systems Studied
The phantom was imaged on a total of 7 PET-capable systems, including 3 dedicated bismuth germanate (BGO) systems (unit cost, approximately $1.5–2.5 million), 1 dedicated NaI system (cost, approximately $1 million), and 3 hybrid PET/SPECT gamma cameras (cost, approximately $0.5–0.75 million):
Advance (General Electric Medical Systems, Milwaukee, WI)
ECAT EXACT HR+ (CTI PET Systems, Knoxville, TN)
ECAT EXACT HR961 (CTI PET Systems)
C-PET (ADAC Laboratories, Milpitas, CA)
IRIX (Marconi Medical Systems, Cleveland, OH)
VERTEX MCD (ADAC Laboratories)
AXIS (Marconi Medical Systems)
Table 2 lists the imaging performance characteristics of each of the systems according to the National Electrical Manufacturers Association (NEMA) NU2-1994 standard as reported (27–33), the Reilly Communications Group Research Report 319 (September 2000; www.itnonline.net), and the manufacturers’ product data sheets. Ranges are provided where different sources were not in agreement. The Advance and HR+ systems were each <2 y old, but the HR961 was an older system installed in 1992. The C-PET is a 6-detector dedicated PET camera using curved NaI crystals and operates in 3D mode only. The MCD is a 2-head hybrid PET/SPECT gamma camera with an attenuation correction transmission system. The IRIX and AXIS are 3-head and 2-head hybrid PET cameras, respectively, and both were equipped with the γPETAz electronics upgrade. The IRIX camera had a β-test Beacon transmission device, and the AXIS camera had no transmission scanning capability.
Reported NEMA NU2-1994 Performance Characteristics for Cameras Studied
Data Acquisition
The comparative experiment was performed under the condition of identical emission scanning times for all cameras, and, unless otherwise indicated, the standard 111-MBq phantom and lesion set was used. The background compartments were precisely filled with 18F water solutions calibrated for the target start time. Because the 22Na lesion activities remain essentially fixed but the 18F background decays measurably over the duration of the scan, the scan times were precisely controlled to ensure that the correct target-to-background ratios were achieved for each study.
The experiments were performed over a period of several weeks, during which time the 22Na lesions decayed by <3%. A second C-PET experiment was also performed about a year later (22.4% lesion decay). For each experiment, the amount of 22Na decay was computed and the 18F background activity levels were reduced accordingly to exactly reproduce the desired target-to-background ratios. The emission scans were targeted to cover an axial extent of 86.7 cm in 48 min, and the scan time for each experiment (except the second C-PET experiment) was increased by the same factor as the 18F activities were decreased so that the product of the activity present times the emission scan time was constant across all studies.
Because the axial field of view (FOV) and degree of overlap differed among the cameras studied, the emission scans were setup as follows. The number of bed positions required to scan an axial extent of at least 86.7 cm was determined, and the actual axial coverage for this number of beds, ΔZ, was computed. Note that ΔZ ≥ 86.7 cm. The total emission scan time was then set as closely as possible to (ΔZ/86.7)·48 min. When ΔZ was >86.7 cm, the scan start time and starting position were adjusted by half of their respective disparities so that the time after injection, at which each individual portion of the phantom was imaged, was reproduced as closely as possible across all systems.
The emission scans were acquired in oncologic whole-body mode starting at the pelvis and moving toward the head. All systems were operated in 2-dimensional (2D) mode with septa or slat collimators in place, except for the C-PET, which operates exclusively in 3D mode. After emission scanning was complete, transmission scanning was performed according to manufacturer-suggested guidelines. Thus, whereas emission scan times were held constant, transmission scan times were allowed to vary between systems.
Data Processing
The data were reconstructed using manufacturer-supplied software with manufacturer-suggested default processing parameters. It is important to note that the processing parameters were not specifically optimized for the lesion detection task being studied. As listed in Table 3, each camera used iterative ordered-subsets expectation maximization (OSEM) except for the C-PET, which used Fourier rebinning (34,35) followed by the row action maximum likelihood algorithm (RAMLA) (36). Note that while the C-PET data were acquired in fully 3D mode, 2D reconstruction methods were applied; future development of fully 3D reconstruction methods would likely lead to improved image quality for this system. Randoms correction and segmented attenuation correction were performed when available.
Reconstruction Parameters for Each Camera
The reconstructed images for each camera were downloaded for local display and analysis. Each image was interpolated onto a 256 × 256 × 512 image matrix with cubic 2-mm voxels. The precise location of each lesion was determined using interactive coregistration techniques, accounting for slight differences in positioning between experiments. For each lesion, 4-mm-thick transaxial images were formed by summing the 2 adjacent 2-mm-thick slices closest to the lesion center. Maximum intensity projections (MIPs) of the whole-body images were also computed.
LROC Study
An LROC study was performed using 11 human observers. Each observer was presented with 20 training images followed by 46 test images for each camera as described below. Each image consisted of a single transaxial slice that either was normal or contained exactly 1 lesion. In cases where a second lesion overlapped or intruded on the slice of interest, the intruding lesion was masked by blacking out a 24 × 24 pixel region containing the lesion. Additional masked regions were randomly placed on a similar proportion of the normal images so that the presence of a masked region did not provide any information as to whether or not there was a lesion present.
To use all 27 lesions for test purposes, simulated lesions were added to normal slices for training purposes. This was done by grabbing a true lesion and its immediate local area from a positive slice, translating it a random distance, and then blending it onto a normal slice. Care was taken to ensure that there was no visual indication on the final training images that the lesions were simulated.
Eleven observers participated in the LROC study, including 3 trained nuclear medicine physicians, 5 PhD researchers, and 3 graduate students in the Medical Imaging Research Laboratory. The images were read over 2 sessions approximately 1 wk apart. For each camera, the reader was presented with 20 training images followed by 46 test images. Approximately half of the images were normal and half were abnormal. The observer was asked to provide 2 responses for each image: a discrete 6-point confidence rating that a lesion was either present or absent, and the location that the observer felt was most likely to contain a lesion. The location data were entered by flagging crosshairs controlled by a computer mouse, and the most likely location was entered regardless of which confidence rating was chosen.
To minimize the effects of reading order, the order of the images presented for each camera was randomized, and the order in which the sets of images for each camera were presented to each reader was also randomized. The readings took place in a darkened room, and the display monitor settings were calibrated so that the gray scale provided a logarithmic-linear relationship (37). No restraint was placed on reading time, and each reading session averaged about 1 h.
The observer data were analyzed using the LROCFIT program (21) to obtain LROC curves and the probability of correct localization for each camera. The LROC results were analyzed by a 2-way ANOVA, and differences between individual cameras were tested using the Scheffé multiple comparisons test (38). No significant difference in performance between observers was measured. The curves were averages over all observers to obtain the average area under the LROC curve and the average probability of correct localization for each camera. These values were used as figures of merit for the analysis.
RESULTS
Statistics and Counting Rates
The lesion detectability performance of a particular system will depend on its imaging characteristics, including detection efficiency, spatial resolution, 2D versus 3D acquisition mode, reconstruction methodology, and compensation for attenuation, randoms, and scatter. The reported performance characteristics of the systems studied are listed in Table 2, and the imaging statistics for our series of experiments are given below. The count levels for each experiment correlated well with the corresponding NEMA sensitivities. The Advance and HR+ acquired 35 and 36 million coincidence events (after randoms correction), respectively, and the HR961 acquired 28 million. Note that these systems were each operated well below their nominal counting rates, representative of a clinical center using low-to-moderate doses.
Because of lower detection efficiency and dead-time limitations, the 2D NaI systems acquired considerably fewer events. The MCD dual-head system had a singles rate of 2.2 Mcps (1.1 Mcps per head) at the start of the scan, with a nominal singles rate of ∼2.0 Mcps. This system acquired a total of 7.2 million coincidence events (trues + scatter + randoms). The initial singles rate for the AXIS dual-head system was 2.0 Mcps, and 6.5 million coincidence events were acquired. However, the AXIS had γPETAz electronics with a nominal singles rate of ∼4 Mcps. Because the AXIS data were acquired well below the nominal counting rate, and because it had no transmission scanning capability, the AXIS results were excluded from the quantitative analysis of lesion detectability.
The 3-head IRIX system also had the γPETAz electronics upgrade. To operate at its nominal counting rate, a second set of lesions was constructed with twice the 22Na activity as the standard set, and the experiment was performed with twice the activity in the background compartments as well. With this setup, the IRIX had an initial singles rates of 5.9 Mcps (∼2.0 Mcps per head), and 13 million coincidence events were acquired. The nominal counting rate was ∼5.5 Mcps; hence, the IRIX was slightly above its recommended counting rate at the start of the scan.
The 6 detector C-PET camera had a singles rate of 7.0 Mcps in its first experiment. Picchio et al. (20) recently showed that the C-PET lesion detectability performance drops when the camera is operated outside the range of 3–5 Mcps. Thus, a second C-PET experiment was performed 1 y later, allowing the 22Na lesions to decay to 77.6% of their initial activities. The background activity was reduced from 111 to 85.1 MBq, accordingly, and this experiment yielded an initial singles rate of 5.0 Mcps (∼800 kcps per head). Because the counting rates for this second experiment (2.9–5.0 Mcps) match the reported nominal range, these data were used for all subsequent analysis. The C-PET scan acquired a total of 103 million coincidence events; however, because this system was operated in 3D mode, a higher proportion of these events included scatters and randoms (actual numbers not available). Thus, a direct comparison between the number of coincidence events obtained by this system with the other 2D systems may not be appropriate.
Image Quality
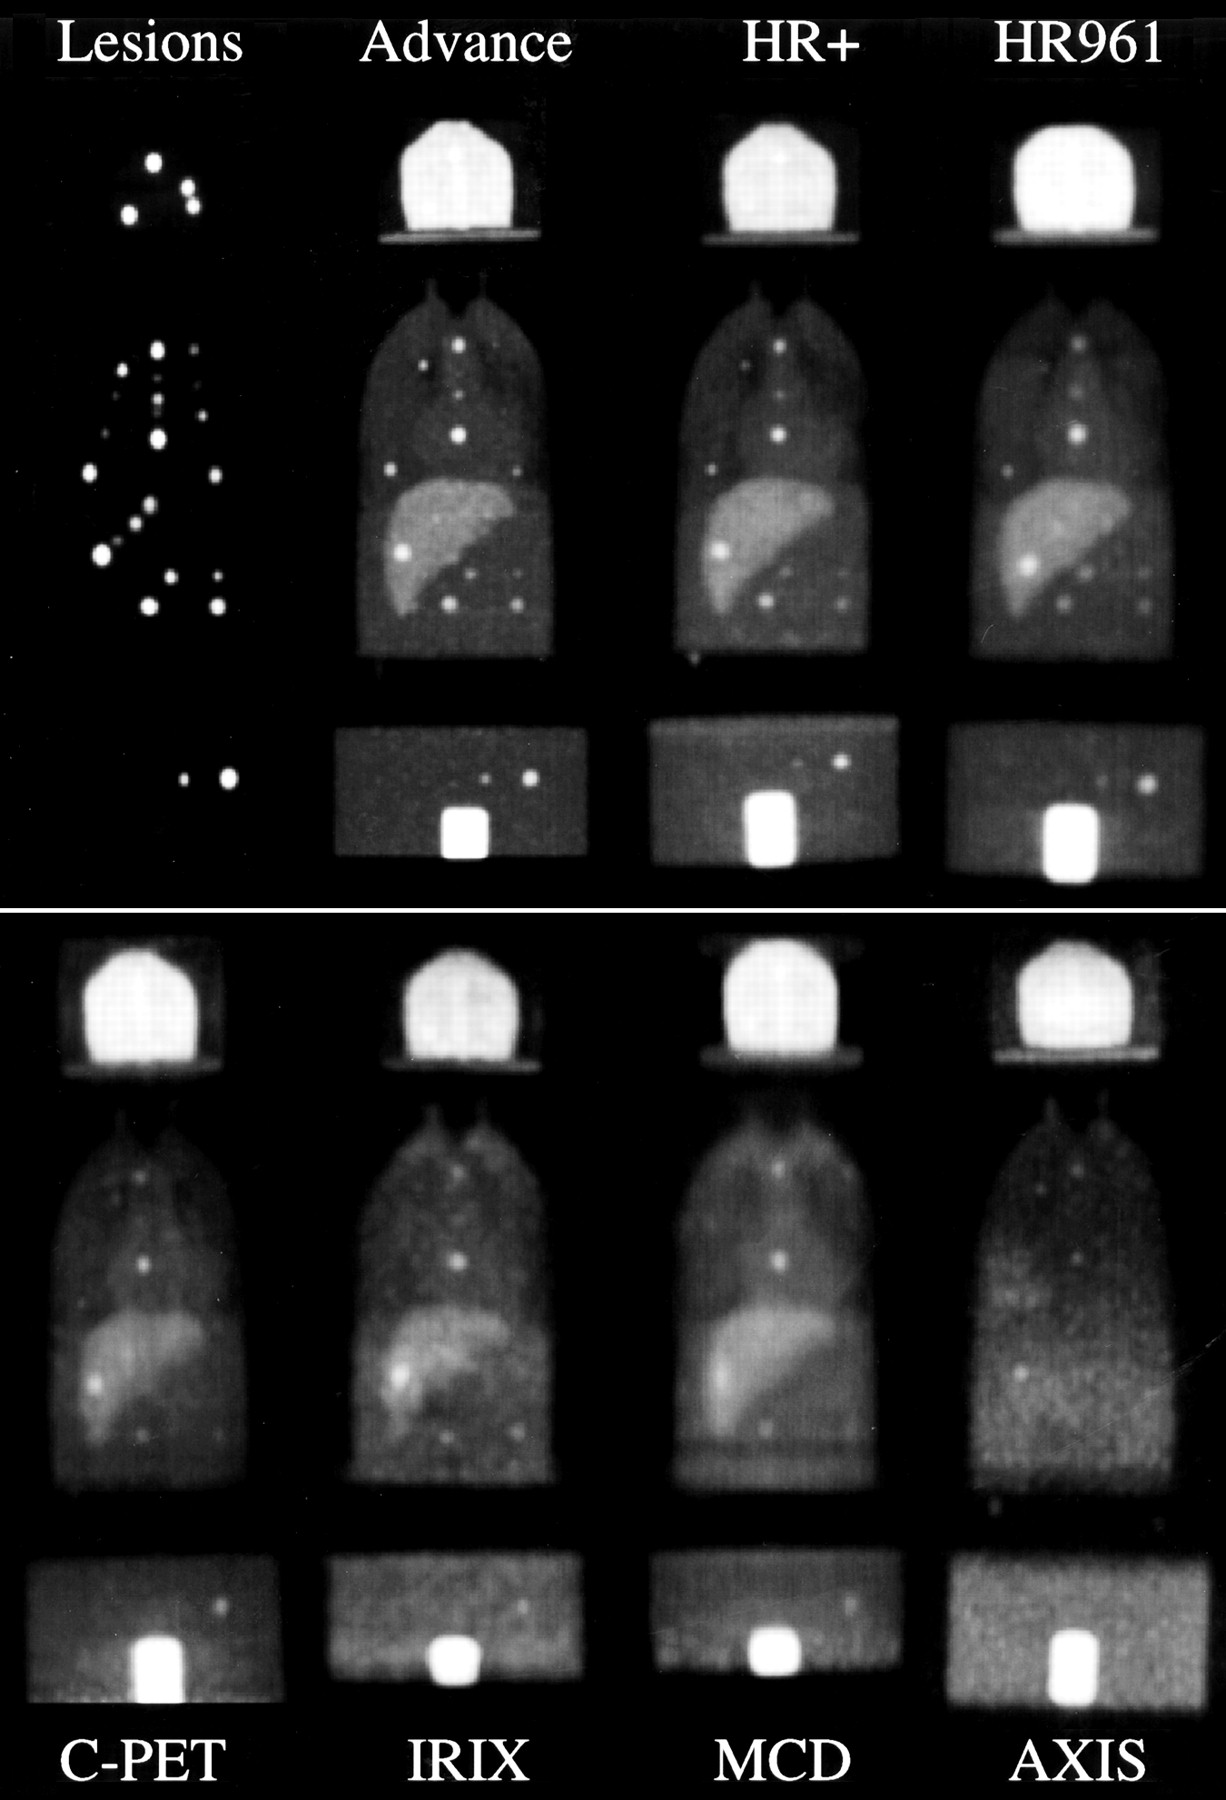
The imaging results are summarized in Figure 2, which shows coronal MIPs for each camera studied. Significant differences in visual image quality can be observed for the different cameras, and there is a reduction in the number of lesions that can be easily visualized as one moves from the dedicated to the hybrid systems. There was also a subtle artifactual background in the shoulder region visible on the images from the hybrid PET systems that did not appear for any of the dedicated systems. The shoulder region of the thorax phantom consisted of a thick plastic wall with embedded bone structures; hence, it had significant attenuating medium but no background activity. We postulate that the artifactual background in the shoulder region for the hybrid PET systems arises from incomplete compensation for scatter or randoms.

Coronal MIPs of whole-body phantom for each camera studied. Note that BGO systems (top row) were operated well below nominal counting rates, and NaI systems (bottom row) were operated at near-nominal counting rates. AXIS image is shown without attenuation correction because no transmission source was available on that system.
Figure 3 show transaxial images—for example, lung, mediastinal, and liver lesions. These images demonstrate marked differences in lesion visualization for the different cameras, and differences in noise texture, contrast, and streak artifacts between systems can also be seen. The differences in image quality are due in part to the varying resolution and imaging statistics achieved by the various hardware used, but differences in data processing also play a major role.

Transaxial images of 8-mm-diameter lesion in right lung at target-to-background ratio of 43:1 (A), 7-mm-diameter lesion in mediastinum at 16:1 (B), and 12-mm-diameter lesion in liver at 3:1 (C). Images demonstrate significant differences in lesion visualization for various systems. Marked differences in speckle noise patterns are also seen, a direct result of various count levels and data-processing parameters of each system.
LROC Study
The radius of correct localization for the analysis was chosen on the basis of Figure 4, which plots the fraction of lesions that were correctly localized versus the radius threshold. The threshold value used was 5 pixels (10 mm), which intersects the curves in regions of low variability. Thus, a small change in the choice of localization threshold would have little effect on the results.
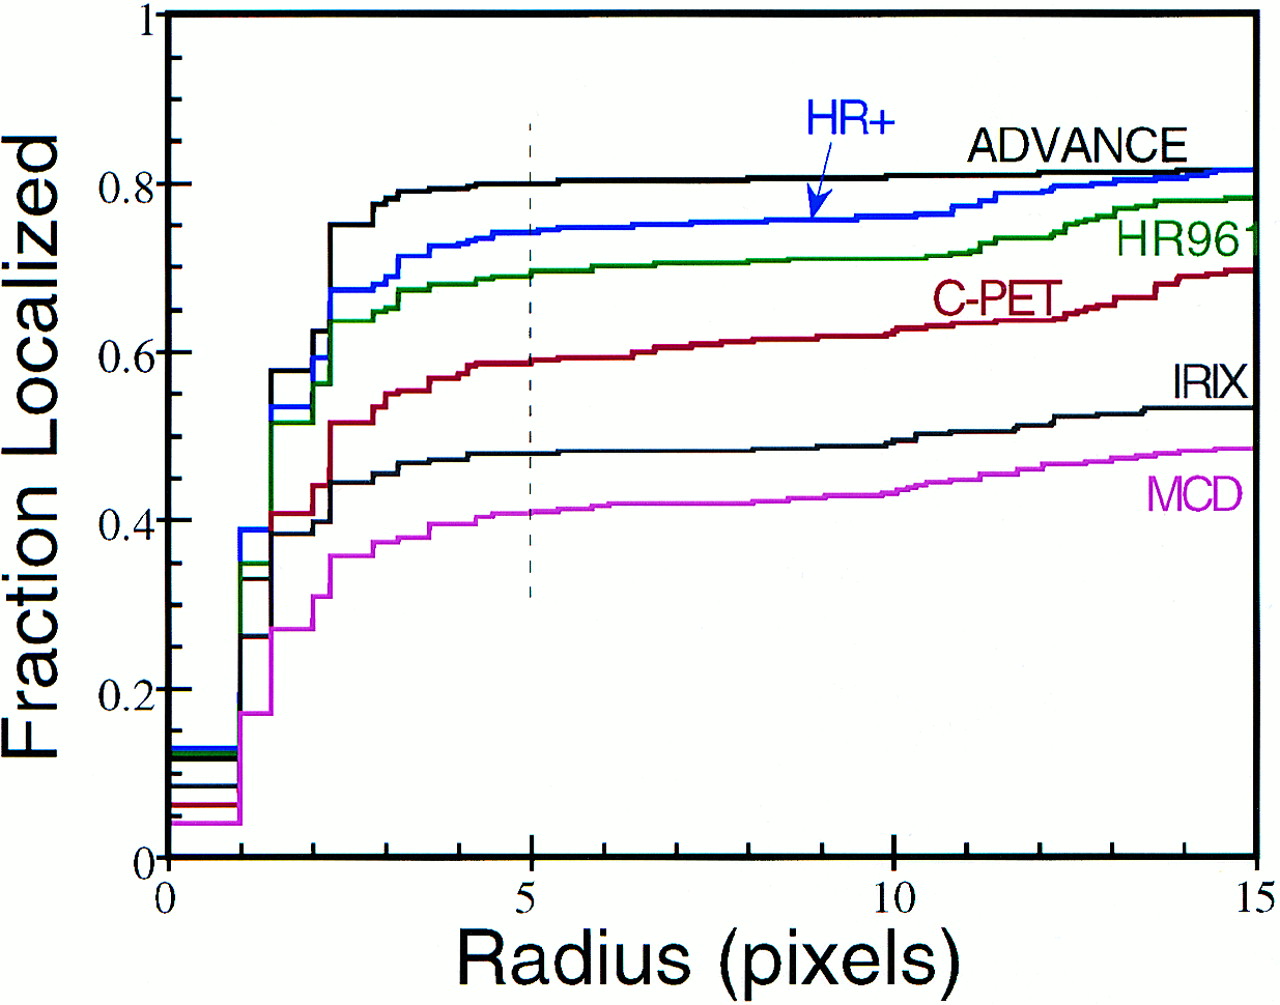
Fraction of correct tumor localizations plotted as function of radius of correct localization. Dashed vertical line indicates threshold chosen for LROC analysis (5 pixels = 10 mm), which marks point of low variability for each curve.
Figure 5 depicts the LROC curves—correctly localized true-positive fraction (TPF) plotted versus false-positive fraction (FPF)—for each camera averaged over all observers. The results of the analysis are also shown quantitatively in Table 4, where the areas under the LROC curves and the probabilities of correct localization are listed. These results show a progression of improved lesion detectability performance when moving from hybrid cameras toward high-end dedicated systems, as expected. Although a significant difference in lesion detectability performance was measured between the Advance and the HR+, such a difference would not be expected given their similarities in technical specifications. This difference may be due in large part to the different processing parameters applied on the different systems, which is discussed further in the Discussion. Although the HR961 had the best-reported NEMA spatial resolution, it was outperformed by both the Advance and the HR+. This was partly a result of its lower sensitivity, although data processing may have played a role as well.
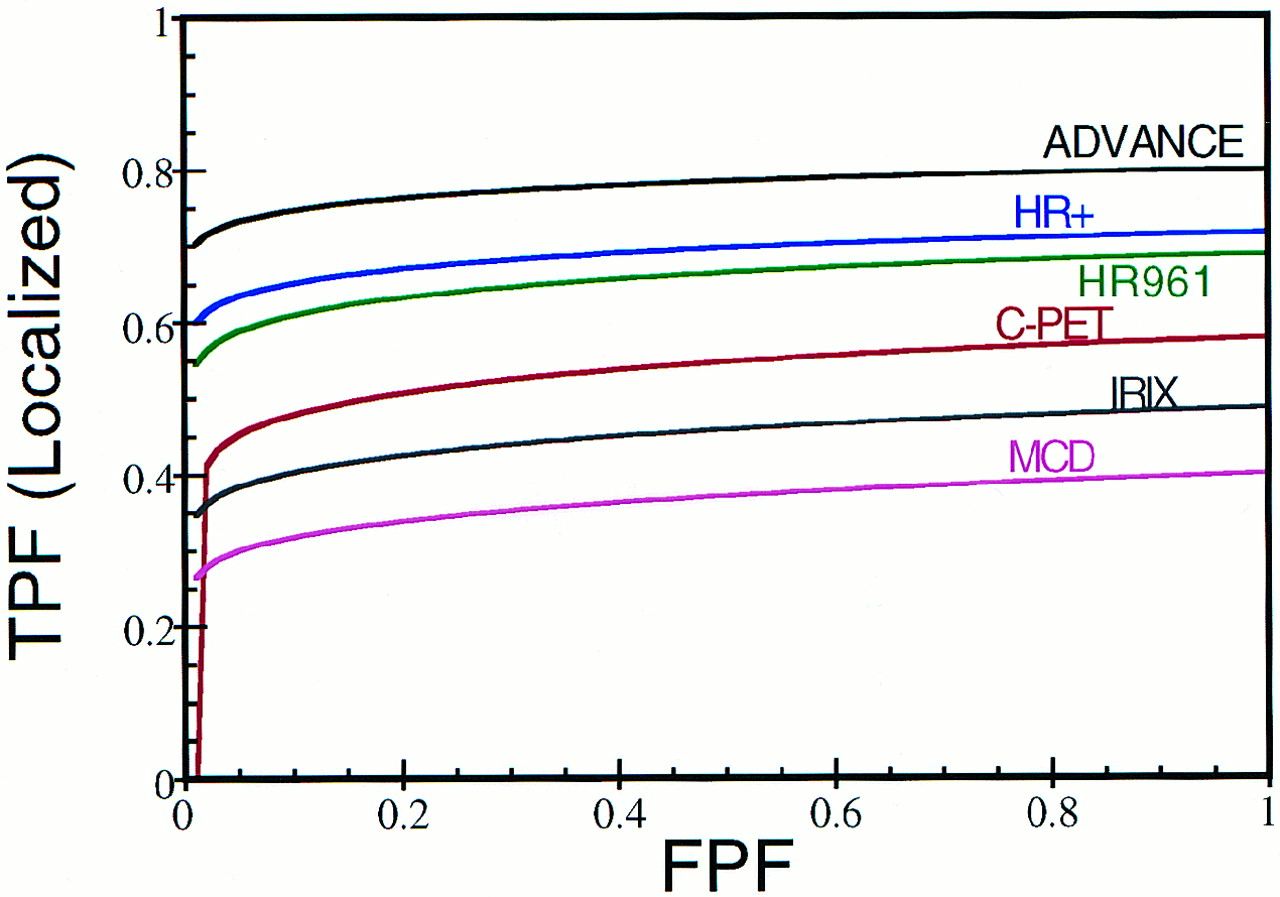
LROC curves for each camera averaged over all observers. Area under curve measures lesion detectability performance, and intersection at false-positive fraction (FPF) = 1.0 indicates probability of correct localization for each system. TPF = true-positive fraction.
LROC Results Averaged Over All Observers
Effect of Lesion Size and Concentration
The percentage of correctly localized lesions for each camera is plotted versus lesion size and activity concentration in Figure 6. Note that all cameras performed similarly for the largest (16 mm) lesions, and individual performance varied for smaller lesions. There was an overall trend of improved performance for hotter lesions, as expected, but Figure 6 also shows differences in performance at each particular lesion activity concentration. These results demonstrate that the relative performance of the individual systems studied depends on both the size and the activity concentration of smaller lesions. Given these results, care should be taken to ensure that each instrument is used appropriately in a clinical setting. For example, all of the systems studied may perform adequately for evaluating single pulmonary nodules that are ≥16 mm in size. However, for a whole-body task such as staging melanoma, in which small distant metastases may be clinically significant, we recommend using the highest-end systems possible.
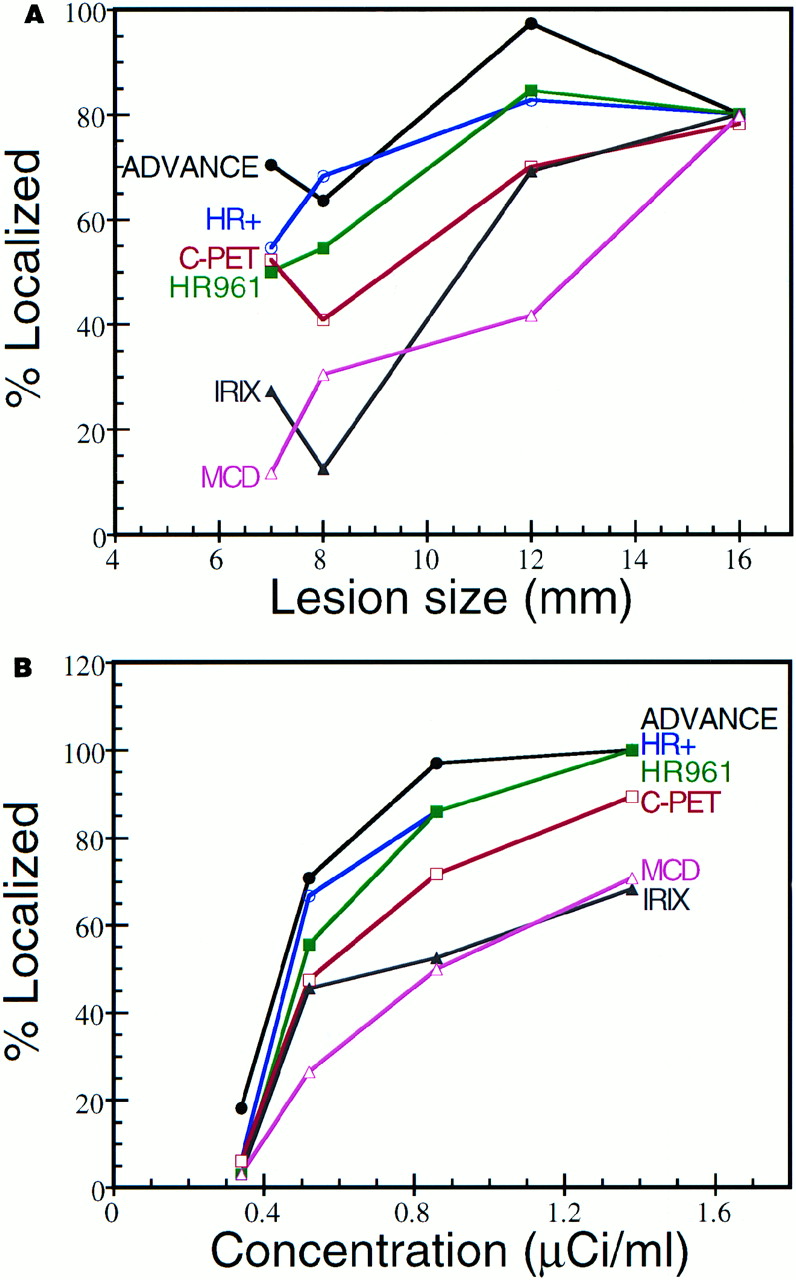
Percentage of lesions correctly localized in observer study for each camera plotted as function of lesion size (A) and lesion activity concentration (B). Each camera studied gave similar performance for largest (16 mm) lesions, and differences in individual performance were observed for smaller lesions. Each camera also obeyed trend of improved performance for higher activity concentrations, as expected.
DISCUSSION
The results of this study show a clear trend in the rankings of the various systems studied, from block-design BGO scanners to the large-area NaI scanner and multihead coincidence-detection gamma cameras. The system rankings correlate with price and with the performance characteristics listed in Table 2 (except that the sensitivity of the 3D mode C-PET doesn’t directly compare with those of the 2D systems). There are few papers in the literature comparing the lesion detectability performance of dedicated PET cameras. Picchio et al. (20) compared the Advance and the C-PET in 28 patients, reporting the same lesion detection sensitivity when the C-PET counting rate was in its nominal range. A single 18F-FDG injection was used, and the C-PET scans were acquired hours later when activity levels had decayed to appropriate levels. Because lesion uptake and contrast are higher 2–3 h after injection than at 1 h (39,40), physiologic conditions benefited the C-PET in that study. Using reproducible phantom methodology to obtain identical imaging conditions, we identified a difference in lesion detectability for these 2 cameras.
Numerous clinical studies have compared coincidence-detection hybrid gamma cameras with dedicated PET (1,3,5–18). The reported sensitivity of hybrid PET ranged from 55% to 95% (average, 78%) of that of dedicated PET, and there is general agreement that hybrid PET performs well for large lesions, but sensitivity drops significantly for lesions ≤10–15 mm in diameter. Our results are consistent with these findings. Phantom comparison work has also been done by Coleman et al. (4) and Yutani et al. (8). Again, their results were consistent with our findings with regard to both comparative sensitivity and size-related detectability issues.
Although the design of our study was set up to be as objective as possible, logistic and practical issues placed subjective constraints on data processing. Recall that the processing parameters for each camera were chosen on the basis of manufacturer-determined defaults. Because the processing parameters were not specifically optimized for each individual camera, this study did not explicitly compare camera hardware; rather, the combined hardware/software packages were compared. Different software parameters could therefore affect the results of the study.
Consider, in particular, the Advance and the HR+ data. These systems have similar specifications, but we measured a significant difference in lesion detectability performance. Figure 7 shows transaxial images of an 8-mm lesion in the left lung. The HR+ image (Fig. 7, left) was reconstructed using 2 iterations of OSEM with 8 subsets, roughly equivalent to 16 maximum-likelihood expectation maximization (MLEM) iterations. This may be insufficiently converged to recover the resolution and definition necessary to detect small focal lesions. The HR+ data were reprocessed using 7 iterations OSEM with 8 subsets (∼56 MLEM iterations), shown in the middle image in Figure 7. This resulted in much improved lesion definition and visualization and was comparable with the Advance image (Fig. 7, right). Given the similarity in hardware specifications, we postulate that the performance difference between the Advance and the HR+ measured in this study was a result of suboptimal data processing and is not representative of the HR+ hardware capabilities. Care should be taken in differentiating between hardware and software issues when drawing conclusions from this work.
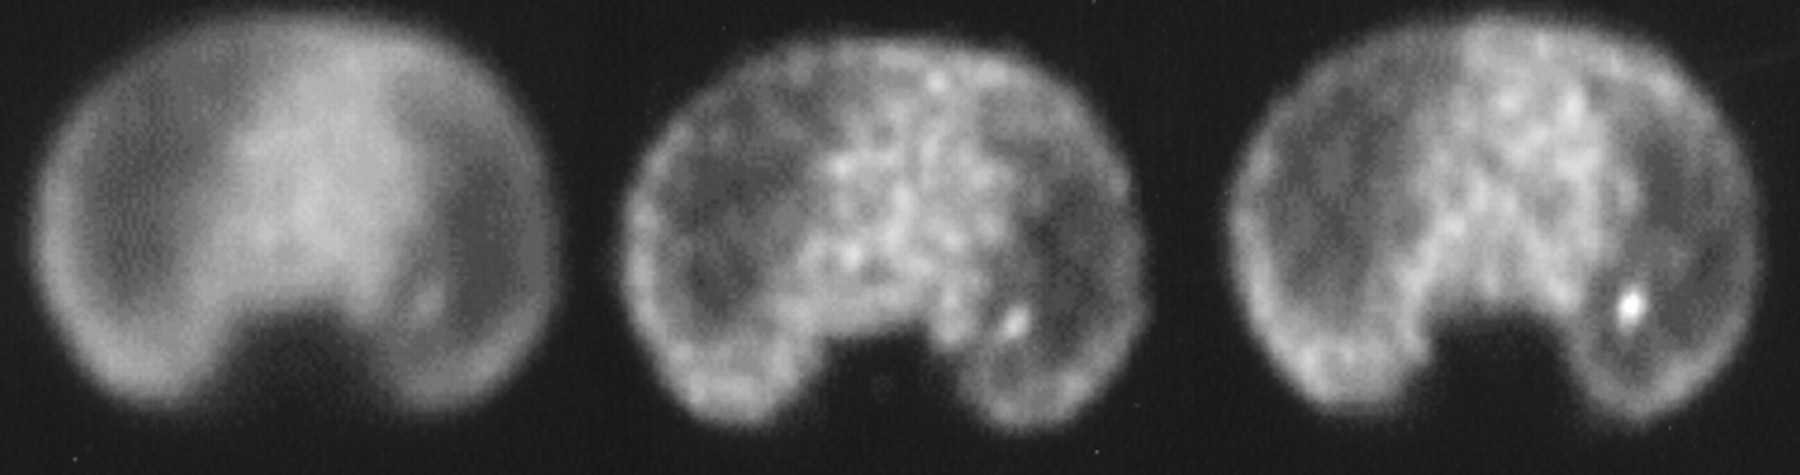
Images of 8-mm-diameter lesion in left lung for HR+ processed with default 2 iterations (left) and with 7 iterations (middle) compared with Advance image (right). Reprocessed HR+ image shows much better lesion definition and visualization. Results suggest that HR+ performance would have been comparable with Advance performance if improved data-processing parameters had been used.
Our study held the acquisition time constant for all systems, in effect evaluating performance under fixed throughput conditions. In practice, longer scan times are generally recommended for the lower-end systems to make up for detection efficiency or counting rate limitations. Although our results provide a generalized overall comparison, the actual performance of a particular camera could be improved by increasing the scan time at the expense of reduced throughput. A full cost comparison and discussion of issues related to patient discomfort and motion artifacts is beyond the scope of this paper. Along similar lines, the performance of the BGO systems could be improved by increasing the dose, whereas the large-area NaI systems were operated at nominal counting rates. For example, we repeated the Advance experiment using the 2× activity phantom, which increased the area under the LROC curve from 0.777 to 0.874 (P < 0.001). All of these issues need to be considered in determining which instrument is appropriate for particular imaging centers and clinical applications.
CONCLUSION
To our knowledge, this work represents the first detailed comparison of a large number of PET-capable systems using a highly reproducible whole-body phantom. Such a comparison is complex, and the particular details of the study should be considered when evaluating the results. Note that this study evaluated combined hardware/software platforms using clinically representative processing parameters. Differences in performance were measured between the dedicated BGO systems, but this was likely due to differences in data processing and may not represent a disparity in hardware performance. A significant difference in lesion detectability performance was measured between the dedicated BGO scanners and the current NaI-based systems, which have lower detection efficiencies and more limited counting rate capabilities. Increased scan times, or technologic advances, would be required for large-area NaI-based systems to become more competitive. The next generation of PET scanners will include pixelated NaI systems, lutetium oxyorthosilicate and cerium-doped gadolinium orthosilicate (GSO) scintillators, and advanced fully 3D geometries that enhance and refine features of the scanners studied here to improve performance. It is hoped that this work will guide future development of PET hardware and also serve to highlight the crucial role that reconstruction algorithms and data-processing parameters play in determining lesion detectability performance.
Acknowledgments
The authors thank Jim B. Slater, PhD (Loma Linda University Medical Center); Alan Waxman, MD, and Mark Hyun (Cedars-Sinai Medical Center); David C. Price, MD, and Carole Schreck (University of California San Francisco PET Center); Joel S. Karp, PhD, and Gerd Muehllehner, PhD (University of Pennsylvania); and Robert Quaife, MD, and Nina Leitman (University Hospital of Colorado). The authors also give special thanks to Howard Gifford, PhD; Mike King, PhD; B.M.W. Tsui, PhD; Richard G. Swensson, PhD; Philip F. Judy, PhD; and Georges El Fakhri, PhD, for software and advice on LROC studies and to the observers: Boyd D. Vomocil, MD; Nancy McDonald, MD; Karen Salzman, MD; Grant T. Gullberg, PhD; Edward V.R. DiBella, PhD; Alex Veress, PhD; Eun-Kee Jeong, PhD; Frederic Noo, PhD; Girish Bal, Harshali Khare, and Swaminathan Nagarajan. This work was supported in part by a pilot research grant from the Society of Nuclear Medicine Education and Research Foundation and by Research Project grant RPG-00-200-01-CCE from the American Cancer Society.
Footnotes
Received Jul. 28, 2001; revision accepted Feb. 4, 2002.
For correspondence or reprints contact: Dan J. Kadrmas, PhD, Medical Imaging Research Laboratory, Department of Radiology, University of Utah, 729 Arapeen Dr., Salt Lake City, UT 84108-1218.
Email: kadrmas{at}doug.med.utah.edu


