


Abstract
The purpose of this study was to confirm with pathologic verification 2 beliefs related to Alzheimer's disease (AD): (a) the long-standing impression that bilateral temporo-parietal hypometabolism, as noted on FDG PET imaging, is the metabolic abnormality associated with Alzheimer's disease (AD) and (b) that the sensitivity, specificity, and diagnostic accuracy of the metabolic pattern of bilateral temporo-parietal hypometabolism allows differentiation between other degenerative causes of dementia. Methods: Twenty two individuals (8 women, 14 men) with difficult-to-characterize memory loss or dementia (using standard clinical criteria), and who eventually received pathologic confirmation of diagnosis, were evaluated. FDG PET brain scans were obtained and visually graded by an experienced nuclear medicine physician as to the presence of classic bilateral temporo-parietal hypometabolism as seen in Alzheimer's type dementia. Sensitivity, specificity, positive predictive value, negative predictive value, and diagnostic accuracy of the metabolic pattern of bilateral temporo-parietal hypometabolism were determined using pathologic diagnosis as the gold standard. Results: The clinical diagnosis of possible or probable AD was determined as the primary cause of dementia in 12 patients. The sensitivity and specificity of the clinical diagnosis for probable AD were 63% and 100%, respectively. The sensitivity and specificity of the clinical diagnosis for possible and probable AD were 75% and 100%, respectively. The sensitivity, specificity, and diagnostic accuracy of bilateral temporo-parietal hypometabolism being associated with AD were 93%, 63%, and 82%, respectively. Conclusion: This study confirms that bilateral temporo-parietal hypometabolism is indeed the classic metabolic abnormality associated with AD. Furthermore, in individuals with dementia whose FDG PET scans indicated a metabolic pattern other than bilateral temporo-parietal hypometabolism, a cause of dementia other than AD should be suspected. These observations may be of clinical importance in differentiating dementia syndromes. The sensitivity, specificity, and diagnostic accuracy of FDG PET are acceptable as tests to be used in the evaluation of dementia and particularly to confirm the clinical suspicion of AD.
Structural and functional imaging studies have been used in the evaluation of patients with dementia in an attempt to better differentiate the etiology and improve diagnostic accuracy. The results of PET and SPECT imaging studies performed for the evaluation of dementia can be found in the medical literature (1–4). Resting-state temporo-parietal hypometabolism in PET and temporo-parietal hypoperfusion in SPECT have been the functional imaging diagnostic findings to differentiate Alzheimer's disease (AD) from other dementing illnesses (1–13). Bilateral temporo-parietal hypometabolism and hypoperfusion are characteristic patterns seen in AD but may not be specific to AD (14,15). Typically, however, the pattern is sensitive and specific in differentiating AD from other dementing illnesses in most cases. Perfusion studies with SPECT and metabolism studies with FDG PET performed in the resting state are being used as adjuncts in the clinical evaluation of patients with dementia, particularly when the clinical diagnosis is difficult or problematic (1,2,4–6,8,9).
A basic deficiency with the functional imaging studies that have been performed to date has been the lack of pathologic confirmation of functional imaging diagnoses. In most published studies, the presumed diagnosis obtained from clinical criteria has been used to determine sensitivity, specificity, and diagnostic accuracy for the functional imaging study. The clinical diagnosis has rarely been confirmed by pathology. Particular patterns of resting-state hypoperfusion or hypometabolism have been described in numerous dementia syndromes as characteristic for that particular disorder. However, there are overlap and variability in these patterns. Pathologic verification of the diagnosis for the determination of sensitivity, specificity, and diagnostic accuracy of the various metabolic and perfusion patterns has not been available.
Because resting-state FDG PET studies are being used increasingly in the clinical evaluation and differentiation of dementia syndromes and diagnosis of AD (1,2,4), verification of the classic findings of temporo-parietal hypometabolism with pathologic confirmation of diagnosis is extremely important. At present, only a few cases have been reported correlating pathologic and FDG PET metabolic findings (8,16–24). In these cases, however, there is excellent agreement between histologic diagnosis of AD and the metabolic finding of temporo-parietal hypometabolism. The majority of resting-state FDG PET studies describing temporo-parietal hypometabolism have relied on the clinical diagnosis of probable AD as defined by National Institute of Neurological and Communicative Disorders and Stroke/Alzheimer's Disease and Related Disorders Association (NINCDS-ADRDA) criteria (25). However, there is obvious potential for discrepancy if pathologic verification is never obtained. This study was designed to answer specific questions regarding the accuracy of both clinical evaluation and resting-state FDG PET metabolic patterns in pathologically verified dementia.
MATERIALS AND METHODS
The study sample was composed of 22 individuals (8 women, 14 men) who were patients at the Memory Disorder Clinic of the Joseph and Kathleen Bryan Alzheimer's Disease Research Center at Duke University (Durham, NC). The specific etiology for the patients' memory loss was considered diagnostically challenging or difficult by clinical criteria. For this reason, the patients agreed to eventually have pathologic confirmation of diagnosis. All patients received standard dementia evaluations and were diagnosed by board certified neurologists who specialize in dementia evaluation. Diagnoses were defined by standard NINCDS-ADRDA (25) and Consortium to Establish a Registry for Alzheimer's Disease (CERAD) (26) criteria. Resting-state FDG PET brain scans were obtained and were visually graded by an experienced nuclear medicine physician for the presence of the classic bilateral temporo-parietal hypometabolism seen in Alzheimer's type dementia. The interpreter was unaware of all clinical information. The subjects were followed over time and had pathologic confirmation of diagnosis (biopsy, n = 2; autopsy, n = 19; biopsy and autopsy, n = 1). Sensitivity, specificity, positive predictive value, negative predictive value, and diagnostic accuracy of clinical diagnosis as well as FDG PET findings were determined for AD. Sensitivity was defined as the percentage of patients with pathologic AD who had the classic imaging pattern; specificity was defined as the percentage of pathologic non-AD patients who were negative for the pattern. Positive predictive value was defined as the percentage of patients who were PET positive for the pattern and who had pathologically confirmed AD divided by all PET-positive patients for the pattern. Negative predictive value was defined as the percentage of patients who did not show the classic PET pattern and who were pathologically confirmed as non-AD dementia divided by all PET-negative patients for the pattern.
All FDG PET brain scans were performed on the ECAT III (CTI, Knoxville, TN) or the GE 4096 Plus tomograph (GE Medical Systems, Milwaukee, WI) using standard techniques. We administered 370 MBq (10 mCi) FDG followed by a 40-min uptake period during which the patient remained quiet in a dimly lit room. Transaxial imaging of the entire intracranial contents was obtained. The images were filtered and reconstructed using standard techniques.
The FDG PET images were displayed on film and graded for the confidence of the classic pattern of bilateral temporo-parietal hypometabolism. This grading scheme has been described and validated previously (27). The grading scale was as follows: 0 = definitely normal; 1 = probably normal; 2 = definitely abnormal with varying degree of bilateral temporo-parietal hypometabolism; 3 = classic bilateral temporo-parietal hypometabolism; and 4 = abnormal but not AD pattern (including frontal, focal, or only unilateral hypometabolism). For the purposes of statistical analysis, grades 2 and 3 FDG PET interpretations were grouped together as being metabolically diagnostic of AD. The standard CERAD battery of neuropsychologic tests (26,28,29) was obtained, and on the basis of this specific information and NINCDS-ADRDA criteria (25), the best clinical diagnosis at the time of the FDG PET study was noted.
The standard CERAD criteria for pathologic determination of AD were used in this particular study (30). These criteria have been evaluated and optimized for diagnostic accuracy in numerous multicenter studies to date.
RESULTS
Specific patient information is noted in Table 1. The mean age at the time of histologic diagnosis was 67.5 y (SD, ±9.6 y). The mean age at the time of the FDG PET study was 65.4 y (SD, ±9.4 y). Two individuals had histologic confirmation with biopsy 2 mo and 65 mo before the FDG PET study. The interval from the FDG PET study to pathologic verification was 24.9 mo (SD, ±28.1 mo) in all individuals when the 2 individuals who had biopsies at 2 and 65 mo before the PET study were included. When these 2 patients were excluded, the interval from the FDG PET study to pathologic verification was 30.8 mo (SD, ±19.3 mo). In this sample of patients with dementia, for whom autopsy and PET–clinical data were available, the clinical diagnosis of probable or possible AD was determined as the primary cause of dementia in 12 of 22 patients. The pathologic diagnosis of AD was found in 16 of the 22 patients. In 1 of the cases, the pathologic diagnosis included AD and Lewy body disease (patient 12; Table 1) and in another patient, AD and progressive supranuclear palsy (PSP) (patient 16; Table 1).
Summary Data
The sensitivity, specificity, positive predictive value, negative predictive value, and accuracy for the clinical diagnosis of AD are described in Table 2. The data are grouped to account for those occurrence in which AD and another pathologic diagnoses existed, as well as for AD only. The sensitivity of the clinical diagnosis of probable AD in this series was 64.3% when the pathology was only AD and 63% when AD was associated with another diagnosis. Diagnostic accuracy was 73%. The sensitivity and diagnostic accuracy of the clinical diagnosis were low in this group of patients who were considered hard to diagnose. The specificity of the clinical diagnosis, however, was excellent and comparable with that in many other reported studies. When possible AD and probable AD were grouped to represent the clinical diagnosis of AD, there was marked improvement in sensitivity and diagnostic accuracy (Table 2).
Clinical Diagnosis Versus Pathologic Diagnosis Results
The sensitivity, specificity, positive predictive value, negative predictive value, and accuracy for AD for the interpretation of the FDG PET images are given in Table 3. The table data are also grouped to account for those occurrences when AD and a coexisting pathologic diagnosis were present, as well as for AD only. The data presented in this table group the FDG-interpretation grades 2 and 3 as being metabolically diagnostic of AD.
FDG PET Interpreter Results Versus Pathologic Diagnosis
The sensitivity of the PET pattern of bilateral temporo-parietal hypometabolism for AD was high at 93% (13/14) when only a single pathology was present. Sensitivity dropped to 87.5% (14/16) when the confound of 2 pathologic diagnoses were present. The specificity of the pattern for AD was significantly lower at 62.5% (5/8) for a single pathologic diagnosis or 67% (4/6) depending if 2 pathologic diagnoses coexisted. The positive predictive values of the AD PET pattern were 81.3% (13/16) for a single pathologic diagnosis and 87.5% (14/16) if 2 pathologic diagnoses were present. The negative predictive values were 83.3% (5/6) for a single pathologic diagnosis and 67% (4/6) if 2 pathologic diagnoses were noted. Diagnostic accuracies were 81.8% (18/22) for a single pathologic diagnosis and 81.8% (18/22) if 2 pathologic diagnoses were present. Representative images are shown in Figures 1–4, with the clinical information provided in Table 1.

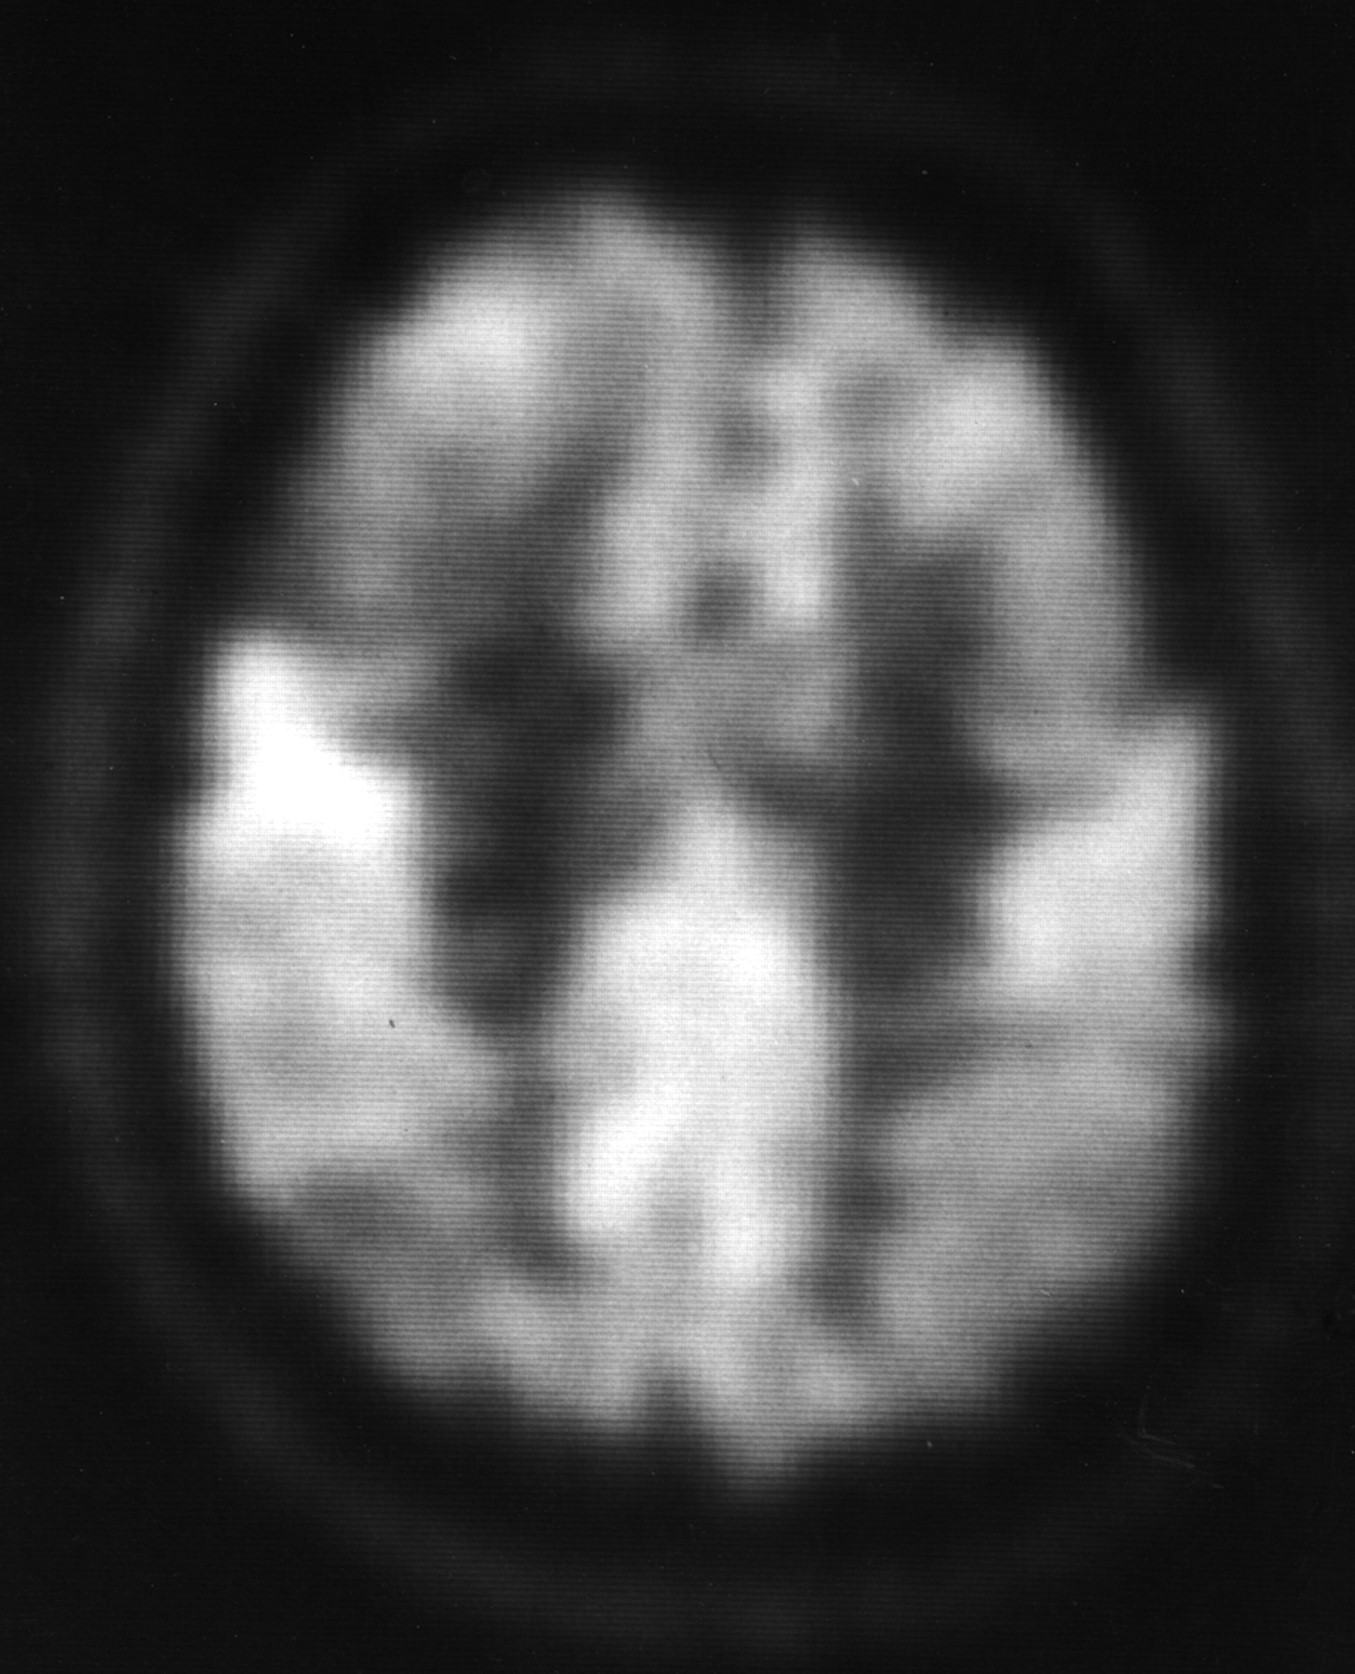
FDG PET scan of 54-y-old woman with progressive dementing illness (patient 7; Table 1). Note significant reduction in FDG in parietal, temporal, and frontal cortices (arrows). The metabolic pattern noted on this particular study would be considered classic for AD. The patient had AD, verified by pathological examination.
In 2 of the cases, the pathologic diagnosis included AD and another pathologic diagnosis. In 1 patient (no. 12; Table 1), the clinical diagnosis was probable AD and the pathologic diagnosis was AD with Lewy bodies. The PET score in this case was considered classic AD. In the second patient (no. 16; Table 1), the clinical diagnosis was progressive supranuclear palsy (PSP); however, the pathologic diagnosis was PSP and AD. In this instance, PET was interpreted as abnormal but not as AD. The PET interpretation substantiated the clinical diagnosis but was incorrect when eventual pathologic confirmation was obtained.
A significant finding in our study was that in only 2 patients (nos. 16 and 19; Table 1) was the PET scan interpreted as abnormal but not indicative of AD when in reality the patient did have AD. In 1 case (no. 16; Table 1), coexisting PSP was present. Only patient 19's FDG PET scan (Table 1) was interpreted as abnormal but not consistent with AD when in fact the final pathologic diagnosis was AD only. In 2 patients, the PET was interpreted as AD when the pathologic diagnosis was not AD (nos. 2 and 18; Table 1); 1 was a case of Creutzfeldt-Jacob disease, which can have a metabolic pattern similar to AD (31–33) (Fig. 2) but is seldom confused with AD clinically, and the other was a case of Lewy body disease.
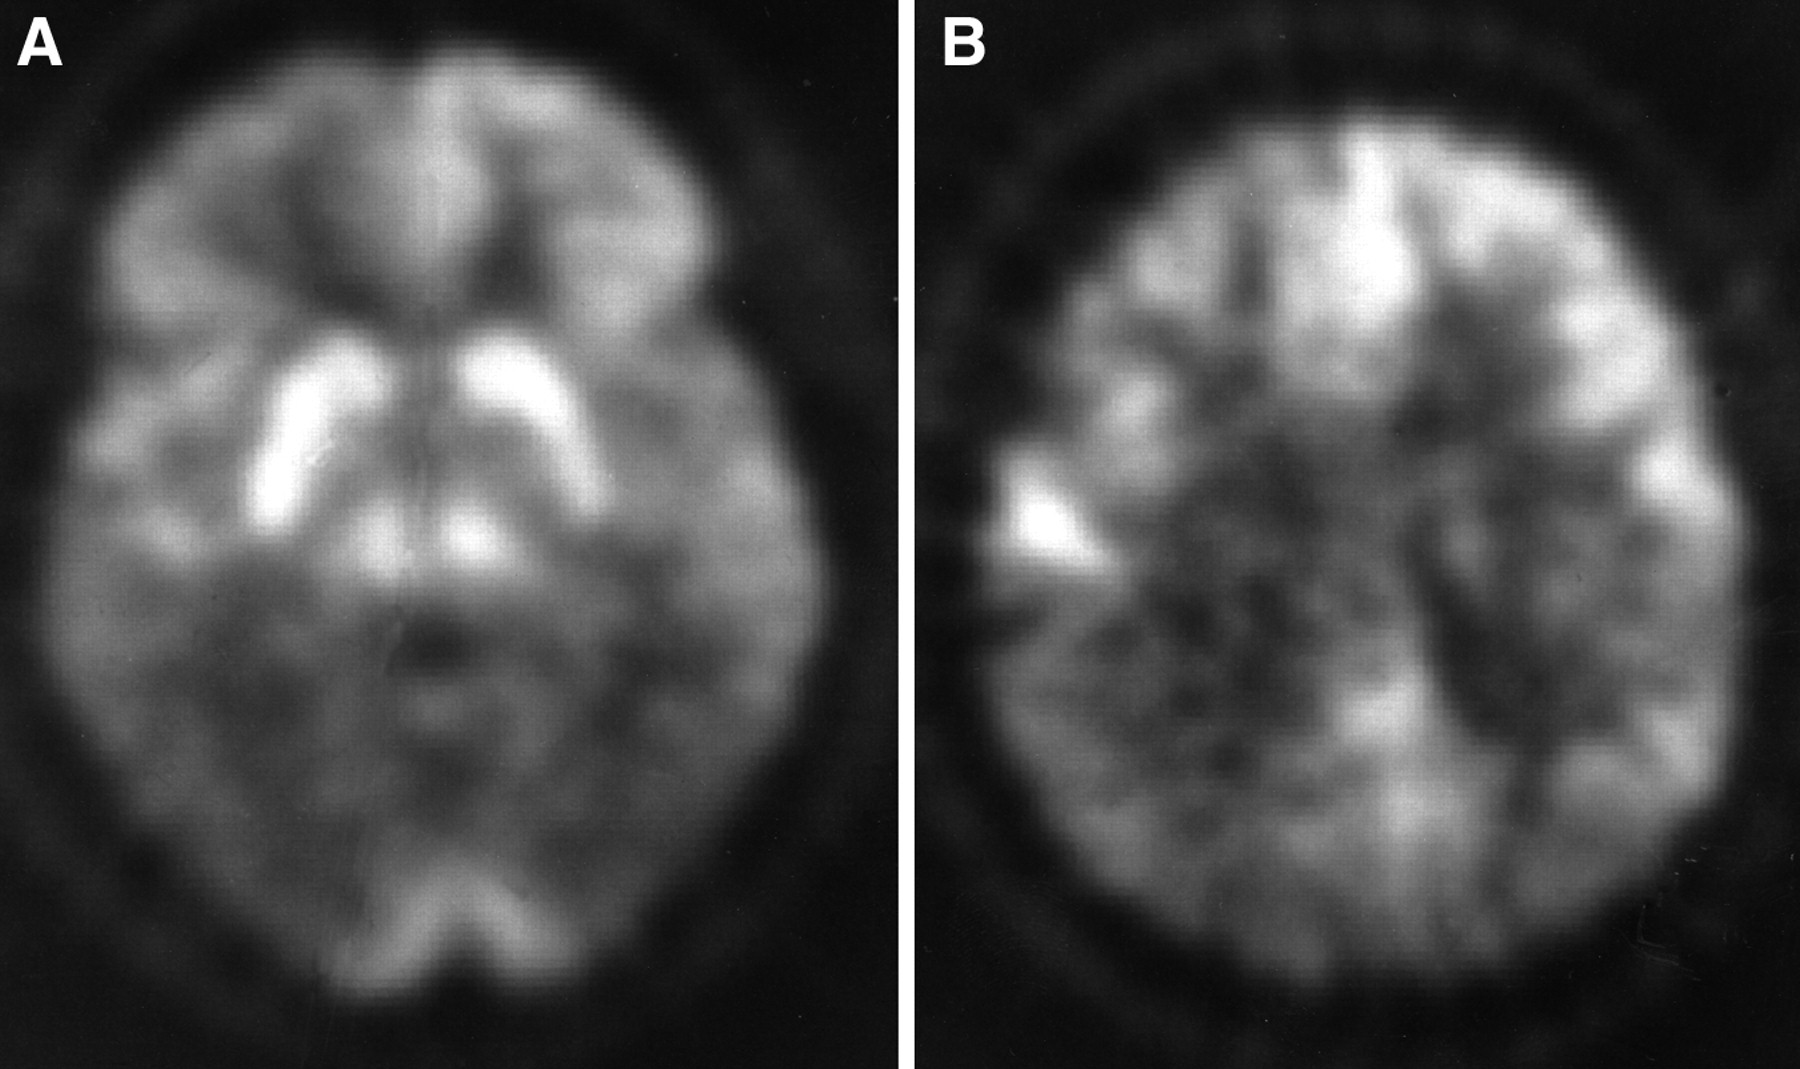
FDG PET scans of 60-y-old man with a rapidly progressive dementia syndrome (patient 2; Table 1). Patient had both biopsy and autopsy confirmation of diagnosis of Creutzfeldt-Jacob disease. FDG PET scans at 2 levels show marked reduction in FDG uptake in temporo-parietal (A) and parietal (B) regions bilaterally. A pattern very similar to AD has been reported in previous cases of Creutzfeldt-Jacob disease studied with FDG PET imaging (31–33).
DISCUSSION
The purpose of this study was to confirm, using accepted pathologic criteria, that bilateral temporo-parietal hypometabolism is the metabolic pattern seen in AD. This study was not specifically designed to show the superiority of FDG PET metabolic imaging versus careful clinical evaluation in diagnosing AD. On the basis of our data, we support the use of FDG PET imaging in the evaluation of a patient with difficult-to-clinically-characterize dementia. Our results in this group of patients who were difficult to diagnose clinically are certainly encouraging because the FDG PET diagnostic accuracy noted was better than the clinical result, and, in many instances, the FDG PET findings were correct and would have provided valuable diagnostic information. Our study confirms that bilateral temporo-parietal hypometabolism is highly correlated with the pathologic diagnosis of AD. In those individuals with a dementing illness other than AD, the FDG PET study is typically abnormal in a different metabolic pattern, thus making it possible to differentiate AD from non-AD dementia.
There are few previous studies examining FDG PET metabolic results or SPECT perfusion results in dementia with histologic confirmation of diagnosis. The first reports of histologic verification of AD in patients studied with PET were by Friedman et al. (16) and McGeer et al. (17). The patient described by McGeer et al. (17) had pathologically verified AD, with the most prominent pathologic findings in the right occipital, left frontal, and left parietal areas. The FDG PET study showed reduction of FDG uptake in the left frontal, left parietal, left temporal, and right parietal areas. In another study, McGeer et al. (17) described a single patient with histologically verified AD who had a PET scan (18).
In 1990, McGeer et al. (19) described 2 individuals, ages 45 and 68 y, in whom FDG PET scans were obtained that correlated with histologically verified AD. The authors did not give specific information about the histology or the FDG PET results in these 2 patients. However, they did state that a general pattern of metabolic deficits very close to the pattern of neuronal loss and plaque and tangle formation was seen in the autopsied brains. The authors further commented that they found strong correlation between regional metabolic deficits and cortical neuronal loss. McGeer et al. (20) also published the results of a study involving 9 patients with dementia and pathologic verification, including 6 patients with AD, 2 with Huntington's disease, and 1 with Parkinson's disease. The authors assessed neurochemical enzyme activity with cerebral metabolic rates and found varying correlations. They did not specifically describe the regional metabolic patterns or the histologic correlation. However, the authors did suggest that there is some correlation between the histology and metabolic pattern and described temporo-parietal metabolic abnormalities.
In 1991, Duara et al. (21) described 9 patients with the histologic confirmation of an AD diagnosis after having been assessed using FDG PET scans. Duara et al. also correlated metabolic findings with specific pathologic findings of gliosis, plaques, tangles, and neuronal loss. In 4 patients there was prominent temporo-parietal hypometabolism, in 4 patients there was a predominance of frontal metabolic abnormalities, and in 1 patient there was equivalent frontal and temporo-parietal metabolic abnormalities. Unfortunately, the authors did not provide quantitative information that would possibly show that even though in 4 patients there was a predominance of frontal metabolic dysfunction, there may have been coexisting temporo-parietal metabolic abnormalities compared with the control group. In this study, the authors concluded that the metabolic findings in AD were heterogeneous and no typical metabolic pattern existed. Furthermore, they concluded that the underlying neuropathologic findings did not correlate with a specific metabolic pattern. It was their opinion that the metabolic findings seen in AD are most likely secondary to disconnection phenomenon and synaptic loss. This particular study was performed with a scanner of poor spatial resolution compared with the scanners used in our study, and this may have contributed to the findings.
In 1992, DeCarli et al. (22) described 6 patients who had FDG PET scans and quantitative postmortem neuropathology. In 4 patients, there was a significant negative correlation between regional neurofibrillary tangle density and regional metabolic rates. In none of the patients did a correlation exist between senile plaque density and regional metabolic rates. The authors did note, however, that the associated cortical regions had the highest neurofibrillary tangle densities and the lowest metabolic rates. There was metabolic sparing of primary sensory and motor cortex.
In 1994, Salmon et al. (8) described a study of 129 individuals who underwent FDG PET imaging for differential diagnosis of dementia. Twelve patients eventually had pathologic confirmation of diagnosis. Five patients with dementia eventually had pathologic confirmation of diagnosis revealing AD. Three of the 5 patients had a characteristic pattern of bilateral temporo-parietal hypometabolism. One patient with milder clinical symptoms showed unilateral temporo-parietal involvement. Another patient had moderate dementia and unilateral frontal greater than unilateral temporo-parietal metabolic dysfunction. This particular patient had neurofibrillary tangles, amyloid angiopathy, gliosis, atrophic neurons, and plaques but no Pick bodies. The authors did note 1 patient with bilateral temporo-parietal hypometabolism who had histologic Creutzfeldt-Jacob disease. The remainder of the pathologically confirmed cases had metabolic patterns that were not confused with AD. The authors concluded that 94% of the patients with the clinical diagnosis of probable AD had a metabolic pattern of bilateral or unilateral temporo-parietal hypometabolism.
A report in 1995 by Tedeschi et al. (23) described 4 patients (out of 18 patients) with the diagnosis of normal pressure hydrocephalus (NPH) and AD who underwent FDG PET imaging and had right frontal biopsies obtained. The authors determined side-to-side and anterior-to-posterior asymmetry indices. In the 4 cases where the pathology revealed AD, 1 patient was found to have only left frontal metabolic dysfunction. In 1 patient, there was significant temporo-parietal hypometabolism. In 2 patients, there was global reduction in FDG uptake in frontal and temporo-parietal association cortices. Some asymmetry of the metabolic patterns was also noted. The authors concluded that the metabolic patterns seen in the patients with AD did not differ from those of idiopathic NPH not associated with a degenerative disease. This study is difficult to compare with other results because in the pathologically confirmed cases of AD, the coexistence of NPH may have also altered the metabolic pattern.
In 1996, Mielke et al. (24) described 4 patients with postmortem confirmation of the diagnosis of AD who had FDG PET imaging. Three of the 4 patients were studied serially during the course of their illness. The authors also correlated neuropathologic findings with regional metabolic abnormalities. All studies revealed significantly reduced temporo-parietal metabolism compared with control subjects. There was a significant relationship between regional and senile plaque density in only 1 patient. In this study, there was not a strong correlation between regional glucose metabolism and neurofibrillary tangle density. Pathologically, neurofibrillary tangles were concentrated in the hippocampus, amygdala, and entorhinal regions. The authors concluded that the metabolic abnormalities of involvement of the temporo-parietal and frontal association cortex were secondary to disruption of projection neurons in limbic areas.
Previous studies have specifically examined the characteristic pattern of temporo-parietal metabolic abnormalities in AD. A study by Powers et al. (15) found that the pattern was not adequately specific to be used as a clinical tool. In their study, however, PET brain perfusion imaging was performed with oxygen-15–labeled water, which does not have the image resolution or quality of FDG. Therefore, the lower accuracy of oxygen-15 PET perfusion studies is not unexpected compared with current high-resolution FDG PET studies.
In certain cases, overlap of metabolic patterns may exist and the interpreter needs to be aware of important and relevant clinical information. In this study, patient 2 (Table 1; Fig. 2) had the pathologic diagnosis of Creutzfeldt-Jacob disease. This particular disorder is clinically different than AD. In this study as well as in other studies (31–33), Creutzfeldt-Jacob disease may have a metabolic pattern that is indistinguishable from that of AD. In the patient in this study, the metabolic pattern was considered classic for AD (Fig. 2). Other dementing disorders may have different characteristic metabolic patterns, such as PSP with prominent frontal hypometabolism (34–36) (Fig. 4).

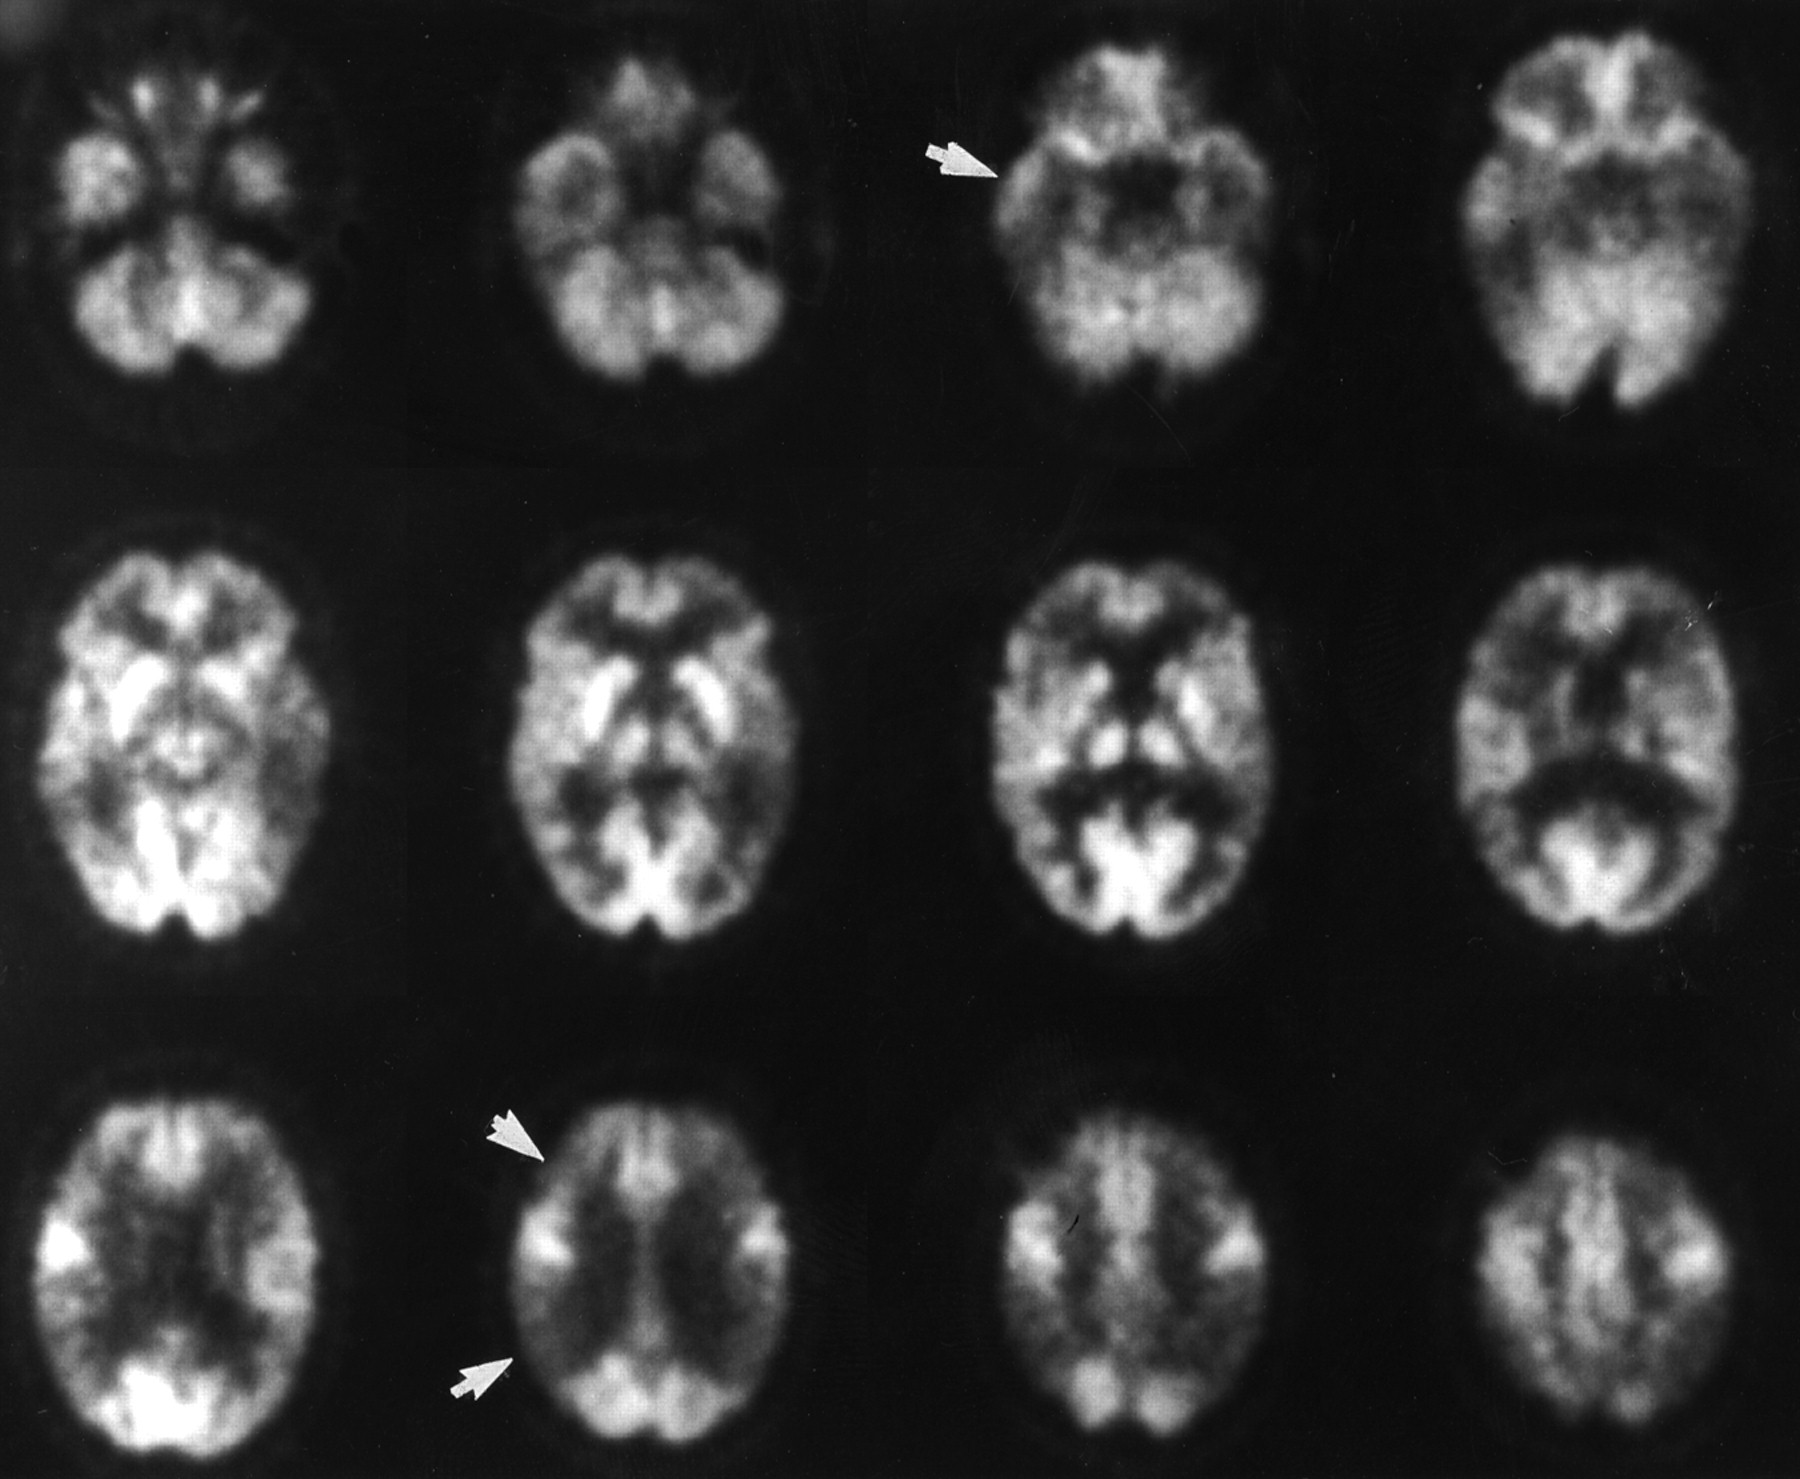
(A–C) FDG PET scans at 3 transaxial levels of 64-y-old man with progressive dementing illness (patient 5; Table 1). Pathologic diagnosis was nonspecific neuronal degeneration. FDG PET scan was interpreted as abnormal but not AD pattern. FDG PET images at 3 levels are shown. Note asymmetric FDG uptake, particularly in the left frontal area (arrow) on multiple imaging levels. Temporo-parietal hypometabolism was not a prominent finding in this patient with non–Alzheimer's type dementia.
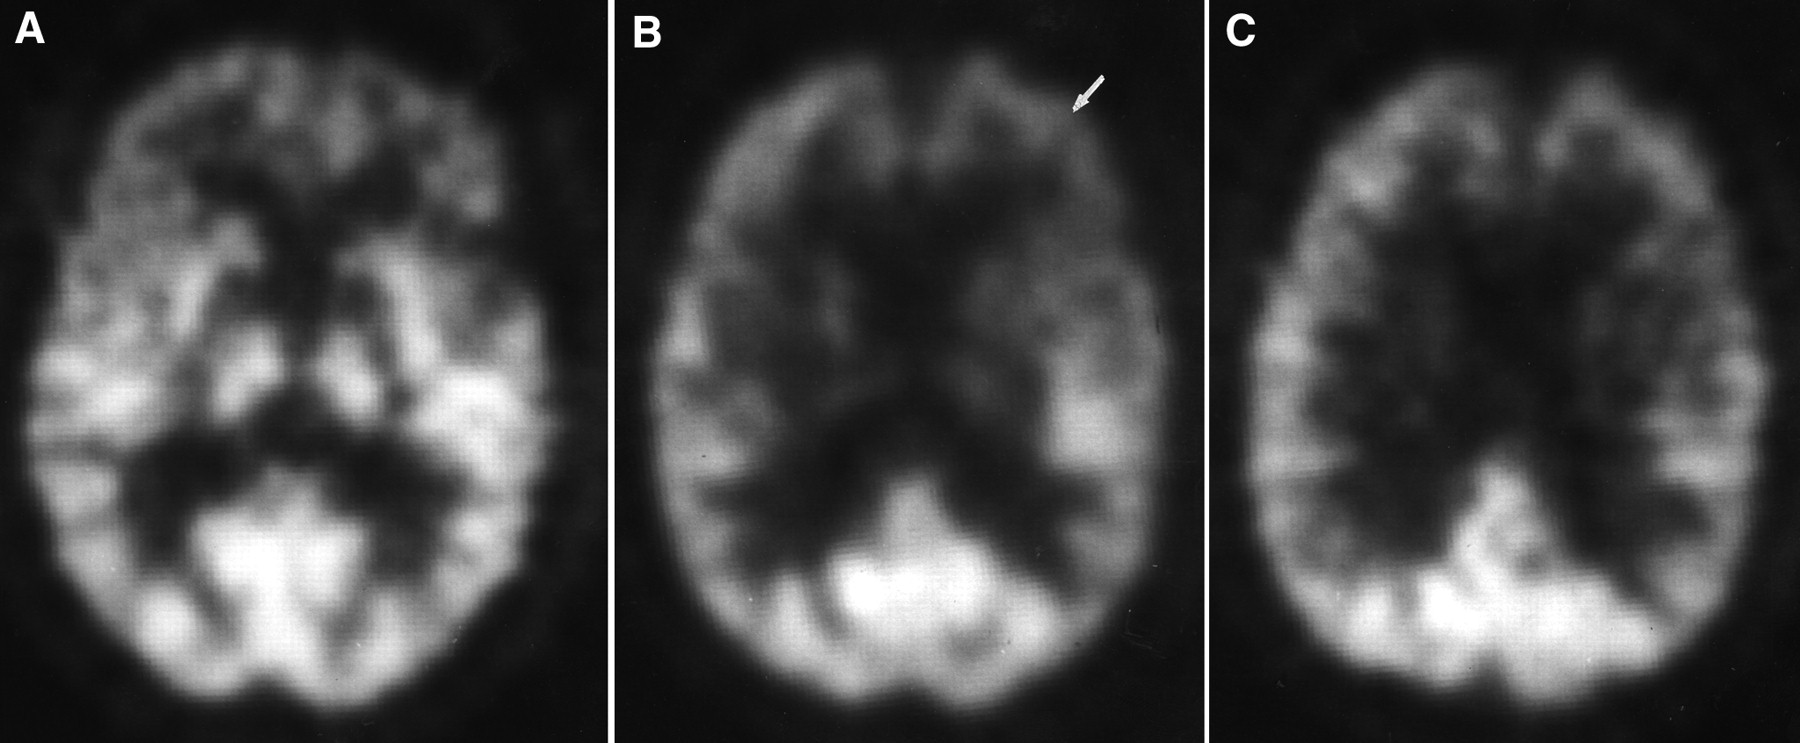
FDG PET scan of 66-y-old man with progressive dementia with extrapyramidal features (patient 13; Table 1). This individual had histologically proven progressive supranuclear palsy. FDG PET scan was interpreted as abnormal but not AD pattern. FDG PET image showed reduction in FDG uptake in frontal regions bilaterally. Prominent frontal hypometabolism has been previously described in patients with progressive supranuclear palsy with FDG PET (34–36).
Because of the more widespread availability of SPECT imaging with a perfusion agent, the number of studies describing pathologic confirmation and SPECT imaging has increased. In 1993, Jagust et al. (37) reported their experience with 11 patients with AD dementia and 5 individuals with non-AD dementia confirmed by autopsy. The authors used SPECT imaging of 123I iodo-amphetamine and noted that reduction in temporal and parietal perfusion was most effective in differentiating AD from non-AD dementia. In individuals with non-AD dementia, frontal lobe hypoperfusion was a common finding.
In 1993, Bonte et al. (3) described SPECT scans in 15 individuals with histologic diagnosis of dementia. The authors used 133Xe SPECT imaging, and 3 subjects were studied with 99mTc hexamethyl propleneamine oxime (HMPAO). Seven patients had histologic confirmation of AD, 2 had AD and Parkinson's disease pathology, 1 had equivocal AD pathology, 1 had polyglucason body disease, 1 biopsy was normal, 1 had AD plus multiple infarcts, and 1 had multisystem degeneration. In the AD patients, visual findings on the SPECT scans revealed prominent temporo-parietal hypoperfusion. In the other dementia syndromes, more frontal involvement was noted.
Numerous other studies at various centers have defined and described various sensitivities and specificities for SPECT perfusion imaging in differentiating dementia syndromes. In 1995, Read et al. (38) described a series of 27 consecutively evaluated and studied patients with dementia who were evaluated at a university-based memory disorder clinic. The authors correlated clinical SPECT findings with the autopsy diagnosis. SPECT imaging accurately predicted the pathologic diagnoses in 25 of 27 patients with dementia. Read et al. determined a sensitivity for SPECT perfusion imaging of 93% compared with 74% for the clinical diagnosis confirmed at autopsy. In addition, the authors were able to characterize specific perfusion patterns associated with various dementing illnesses and conclude that SPECT imaging provided useful positive information in the differentiation of AD from other dementing illnesses. In a study by Jobst et al. (39), using HMPAO SPECT imaging, the authors reported a 96% sensitivity and a 89% specificity for parietal hypoperfusion as diagnostic of AD.
In this study, as well as those of others, the gold standard of pathologic confirmation was used to determine sensitivity, specificity, and diagnostic accuracy. Unfortunately, it is often difficult to obtain pathologic verification (40), and this is the primary reason for the lack of correlative studies to date. Another problem with clinical–radiologic–pathologic correlations of AD is that there are no universally accepted pathologic criteria for this common cause of dementia (41,42). Various organizations and individual investigators have attempted to improve diagnostic accuracy of pathologic diagnosis by describing specific neuropathologic criteria for AD (30,43–48). However, these various diagnostic algorithms place varying degrees of reliance on the number of neuritic plaques, neurofibrillary tangles, and the clinical history of dementia. These algorithms also use somewhat different sets of brain sections. Thus, a given patient may not always receive the same autopsy diagnosis. For example, in 1 study there appeared to be only about a 60% correlation between 3 widely used sets of criteria (41). In a more recent study, however, there was much better correlation among the diagnostic criteria that are most widely used, including the CERAD, Khatchaturian, and NIA-Reagan criteria (48). Finally, the neuropathologic diagnosis of AD, like the clinical and radiologic diagnoses of AD, may be much more difficult when 2 disease processes coexist (48). Therefore, the definitive gold standard has its own problems as a benchmark for the confirmatory diagnosis of both clinical and functional imaging studies. It is difficult to provide unequivocal sensitivity, specificity, and diagnostic accuracy data in dementia, particularly if 2 disease processes coexist. Despite these limitations, this study provides important confirmatory data to support the fact that bilateral temporo-parietal hypometabolism is the metabolic finding in AD.
From this study, as well as those published with and without histologic verification, a specific metabolic or perfusion pattern was noted involving temporo-parietal association cortex. The exact reason for this specific pattern has been the subject of numerous studies. An excellent review by Smith et al. (13) describes the neurochemical, neuropathologic, and functional connectivity of the hippocampus and association cortex in AD. The cognitive deficits observed in AD are secondary to hippocampal neuropathologic and neurochemical changes (4,49,50), with resultant involvement of corticolimbic pathways (51–53). Recent neuropathologic studies have demonstrated excellent neuroanatomic localization of senile plaques and, in particular, neurofibrillary tangles to the association cortical areas known to be maximally affected in FDG PET studies (54,55). The previously described studies that specifically correlated the neuropathologic findings and regional metabolic measurements showed inconsistent results. These discrepant and often contradictory findings are undoubtedly a result of the small number of patients that were studied.
It has also been postulated that an inherent defect in glucose transport may actually precede biochemical and neuropathologic changes in AD (56). This theory has been evaluated with dynamic FDG PET studies (57,58). Piert et al. (57) noted that there was diminished glucose phosphorylation and transport in the temporo-parietal cortex in AD. It has also been postulated that the metabolic and perfusion deficits in association cortex may be primarily because of neuronal cell loss and neuropathologic changes in these brain regions. Numerous studies have examined the effects of atrophy secondary to neuronal cell loss and the resultant metabolic deficit (59,60). The general concurrence of the available information is that the metabolic and perfusion defects noted cannot be explained fully by tissue volume loss (60). Therefore, the metabolic pattern seen in AD is a complex finding secondary to specific hippocampal and cortical pathologic and neurochemical changes, neuronal disconnection effects, and cortical neuronal cell loss.
Despite these limitations, it appears that the NINCDS-ADRDA clinical criteria (25) and the CERAD criteria for pathologic confirmation (30), as used in this study, provide a current state-of-the-art ability to differentiate and confirm the various etiologies for dementia when correlated with both clinical and functional imaging results. We expect that FDG PET will assume an increasingly important role in the confirmation and differentiation of AD from other causes of dementia.
CONCLUSION
This study confirms that bilateral temporo-parietal hypometabolism, the classic finding seen in Alzheimer's type dementia on FDG PET scans, is highly correlated with the pathologic diagnosis of AD. Furthermore, in individuals with a significant dementia-related illness, but not AD, the FDG PET scan is typically abnormal but not in the same pattern as that seen in AD. This observation may be of clinical use in differentiating dementia syndromes. The sensitivity and specificity of FDG PET studies are certainly acceptable as confirmatory tests used in the evaluation and differentiation of dementia syndromes. It appears that by combining appropriate clinical, neuropsychologic, and FDG PET results, confirmation and improved accuracy of the diagnosis of AD are possible.
Acknowledgments
The authors wish to thank the following for their assistance in performance of the FDG PET scans, analysis of data, and preparation of the manuscript: Thomas Hawk, Sharon Hamblen, Keith Black, and David Coates. This study was supported in part by National Institute on Aging (NIA) grant 2P50 AG05128-07 ADRC, NIA grant P50 AG 05128-0751, and the Department of Radiology, Duke University.
Footnotes
Received May 3, 1999; revision accepted Mar. 2, 2000.
For correspondence or reprints contact: John M. Hoffman, MD, National Cancer Institute NCI/DCTD/DIP EPN/800, Diagnostic Imaging Program, 6130 Executive Blvd., MSC 7440, Bethesda, MD 20892-7440.
REFERENCES
In this issue


Jump to section
Related Articles
Cited By...
- BOLD Amplitude Correlates of Preclinical Alzheimers Disease
- Multi-transcriptomic analysis points to early organelle dysfunction in human astrocytes in Alzheimers disease
- A machine-learning approach for detection of local brain networks and marginally weak signals identifies novel AD/MCI differentiating connectomic neuroimaging biomarkers
- Clinical Neurology and Epidemiology of the Major Neurodegenerative Diseases
- Brain imaging in dementia
- Biomarkers in dementia: clinical utility and new directions
- Association of hypometabolism and amyloid levels in aging, normal subjects
- Diagnostic tests for Alzheimer disease: Judicious use can be helpful in clinical practice
- The Clinical Problem of Symptomatic Alzheimer Disease and Mild Cognitive Impairment
- Inclusion criteria provide heterogeneity in baseline profiles of patients with mild cognitive impairment: comparison of two prospective cohort studies
- Brain Imaging in Alzheimer Disease
- Effectiveness and Safety of 18F-FDG PET in the Evaluation of Dementia: A Review of the Recent Literature
- A tale of two tracers: The age of wisdom for dementia diagnosis?
- Early 11C-PIB Frames and 18F-FDG PET Measures Are Comparable: A Study Validated in a Cohort of AD and FTLD Patients
- Effects of Age on the Glucose Metabolic Changes in Mild Cognitive Impairment
- Imaging Approaches to Parkinson Disease
- What does fluorodeoxyglucose PET imaging add to a clinical diagnosis of dementia?
- Comparison of Regional Brain Volume and Glucose Metabolism Between Patients with Mild Dementia with Lewy Bodies and Those with Mild Alzheimer's Disease
- Dissociation of neuropathology from severity of dementia in late-onset Alzheimer disease
- APOE related alterations in cerebral activation even at college age
- Brain 18F-FDG PET in the Diagnosis of Neurodegenerative Dementias: Comparison with Perfusion SPECT and with Clinical Evaluations Lacking Nuclear Imaging
- Evaluating Early Dementia With and Without Assessment of Regional Cerebral Metabolism by PET: A Comparison of Predicted Costs and Benefits
- Direct Comparison of Spatially Normalized PET and SPECT Scans in Alzheimer's Disease
- SPECT Imaging in Dementias
- Practice parameter: Diagnosis of dementia (an evidence-based review): Report of the Quality Standards Subcommittee of the American Academy of Neurology
- A Tabulated Summary of the FDG PET Literature
- Evaluating Dementia Using PET: How Do We Put into Clinical Perspective What We Know to Date?