


Abstract
A method has been proposed to quantitate the myocardial water-perfusable tissue fraction (PTF) in the area of hypoperfused asynergic segments using 15O-water (H215O) and PET. This study investigated the histochemical correlates of PTF (and perfusable tissue index, PTI) in a canine model of old myocardial infarction. Methods: Myocardial infarction was produced in 12 mongrel dogs, and PET was performed 1 mo later, providing quantitative parametric images of PTF, regional myocardial blood flow (MBF), and extravascular density from H215O, 15O-carbon monoxide, and transmission datasets. At the end of scanning, the myocardium was sectioned, and the PET images were compared directly with the corresponding myocardial sections. Results: The distribution of tissue necrosis identified by histochemical staining corresponded well with the defect in PTF but not in MBF. PTF agreed with the equilibrium images of myocardial H215O distribution, obtained after injection of a large bolus of H215O. The defect surface area identified on PTF agreed well quantitatively with the morphometric estimates of the surface area of myocardial infarction. PTI agreed with the absolute proportion of histochemically defined normal myocardium (0.87 ± 0.09 and 0.83 ± 0.08, respectively; P < 0.01). Both PTF and PTI decreased significantly in segments of myocardial infarction and showed a significant difference between the transmural and nontransmural myocardial infarction. Conclusion: The absolute mass and proportion of histochemically defined noninfarcted tissue may be quantitated with PTF and PTI in the area of myocardial infarction segments.
Identification of ischemic but viable myocardium in patients with myocardial infarction and impaired left ventricular function is of major clinical importance. Several radionuclide techniques have been proposed and evaluated for the detection of reversibly injured myocardium in the clinical setting, including SPECT with either 201Tl (1) or 99mTc-methoxyisobutyl isonitrile (2,3), echocardiography during dobutamine stimulation (4), and flow-metabolism imaging with PET (5–7).
An alternative that has been proposed for assessing myocardial viability using PET and 15O-labeled radiotracers does not require metabolic imaging (8–10). This alternative measures the water-perfusable tissue fraction (PTF, in g/mL), which has been defined as the fraction of tissue capable of rapidly exchanging 15O-water (H215O) within a given volume of region of interest (ROI) (8,11). The perfusable tissue index (PTI) is also estimated and is the proportion of H215O-perfusable tissue within the total anatomic tissue derived from the transmission (tissue density) scan (8–10). The underlying hypothesis is that the ability to rapidly exchange water requires viable myocardium. In normal myocardium, values of PTF have been shown to be consistent with extravascular tissue density, which was independently measured using transmission and 15O-carbon monoxide (C15O) scan datasets, and the value of PTI agreed well with an expected value of unity (8). These PTF and PTI indices have further been shown to successfully predict recovery of contractile function after intervention in patients with myocardial infarction in both acute and chronic settings (9,10), with threshold values of at least 0.7 for the PTI and PTF of a control region. However, the direct correlation of these indices with histologic findings has not been fully investigated. The aim of this study was to directly compare the PTF and PTI indices to histochemical findings for old myocardial infarction (OMI) in experimental dog studies. In particular, we assessed the ability of PTF, PTI, and myocardial blood flow (MBF) to distinguish between infarcted and noninfarcted regions and to measure the infarct size and the fraction of infarcted tissue.
MATERIALS AND METHODS
Estimation of Functional Images
The radioactivity concentration in a small element of a myocardial region after administration of H215O has been expressed by assuming a single-tissue compartment model, as described previously (8,12,13). This formulation includes 3 parameters: regional MBF, PTF, and arterial blood volume (Va). The adoption of PTF has implications for the interpretation of MBF, such that the measurement exclusively represents the mean regional MBF to that mass of tissue within the ROI that is capable of rapidly exchanging water, that is, the mass of tissue defined by PTF. This MBF, because corresponding to blood flow only to perfusable tissue, is free from the so-called partial-volume effect. “MBFp” is the term adopted to describe this parameter, which has units of mL/min/g of perfusable tissue. Another blood flow is defined and used in this article as a product of MBFp and PTF. This blood flow represents the average to the volume of the ROI and has units of mL/min/mL of ROI. “MBFt” is the term adopted for this blood flow.
MBFt, PTF, and Va can be estimated with H215O and PET using a single-compartment kinetic model. The model equation has been fitted to the PET tissue and blood–activity curves by a nonlinear least squares fitting analysis (NLLSF) (8–10,12,13). In this study, an alternative approach—the weighted integration technique developed by Alpert et al. (14) and Koeppe et al. (15)—was applied so as to generate functional images of PTF and MBFt (not MBFp) simultaneously. The weighted integration method essentially provides the same results as NLLSF but requires a much shorter time for computation. Two time-dependent functions of unity and time were used, as suggested by Alpert et al. (14), and the parametric images were calculated using a look-up-table procedure. In this calculation, Va was estimated from the C15O blood volume and from the extravascular tissue density images, with an assumed venous fraction in the myocardium (0.10 mL/g), as reported previously (8,16,17). The extravascular tissue density images were calculated from the C15O blood volume and from the transmission datasets (8).
The arterial input function was obtained from the left ventricular time–activity curve, and a previously validated method (13) was used to correct for incomplete recovery of the left ventricular region and spillover from surrounding tissue. The PTI (9,10) was then calculated for a given ROI as:
 Eq. 1
Eq. 1
Animal Preparation
The subjects consisted of 12 mongrel dogs (body weight range, 10–20 kg; age range, 2–3 y) with OMI. All experiments were performed according to a protocol approved by the Committee for Ethics and Clinical Research of the Research Institute for Brain and Blood Vessels, Akita, Japan. During open-chest surgery, the main trunk of the left anterior descending branch of the left coronary artery was occluded in each dog. After at least a month of recovery (35–45 d), a series of echocardiographic, electrocardiographic, and PET studies was performed.
After an overnight fast, the dogs were sedated with 4 mg acetopromazine by intramuscular injection. Anesthesia was induced with intravenous thiopental sodium (25 mg/kg). The animals were intubated and mechanically ventilated with a mixture of oxygen, nitrous oxide, and air. Anesthesia was maintained by inhalation of 0.5%–1% halothane. Of the 12 PET studies, 8 were of the open chest, and adhesions of the myocardium to the chest wall and lungs were carefully removed before the scan.
Catheters were placed in the femoral artery to monitor arterial blood pressure and H215O input and in the jugular vein to infuse H215O. Electrocardiography findings and arterial blood gases were monitored throughout the procedure.
Echocardiography
Standard 2-dimensional echocardiography was performed by an experienced echocardiography physician on the same day before the PET study to evaluate wall motion (dyskinesis, akinesis, hypokinesis, and normokinesis) in the septum and in the anterior, lateral, and inferior walls.
PET Procedures
PET was performed using a Headtome-III tomograph (Shimadzu, Kyoto, Japan) (18), which enabled data acquisition in 5 planes simultaneously over an axial field of view of 7.5 cm. All emission and transmission data were reconstructed using a Butterworth filter to provide an in-plane spatial resolution of 10.0 mm full width at half maximum for both emission and transmission scans at the center of the field of view. The axial resolution was 13 mm full width at half maximum at the center of the field of view. The slice interval of this scanner was 15 mm. Data were acquired at 2 bed positions to provide adequate sampling for 10 slices over the axial field of view.
A 20-min transmission scan was acquired at each bed position. The blood-pool images were obtained at each of the 2 bed positions (a 2-min acquisition at each position) after inhalation of 3.7 GBq C15O (19). Arterial blood samples were taken every minute during scanning, and the radioactivity concentration in the whole blood was measured using a NaI well counter that was cross-calibrated with the PET scanner.
After 15 min to allow for decay of 15O-radioactivity to background levels, 370 MBq H215O was infused intravenously during 2 min, and then 2 dynamic scans were obtained at each of the 2 bed positions. The 20-frame, 6-min dynamic PET scan was started when radioactivity appeared in the right ventricle and consisted of 6 frames of 5 s each, 6 frames of 15 s each, and 8 frames of 30 s each (20). Between these 2 scans, radiolabeled microspheres (141Ce, 3 MBq) were injected into the left ventricle (n = 8 studies) for measuring regional MBF ex vivo.
An additional static scan was initiated 10 min after injection of a 3.7-GBq bolus of H215O at the 2 bed positions to measure the H215O equilibrium distribution in the body (both in the blood and in the myocardium). Because of the short half-life of 15O, the activity injected was considerably high, and this method is not practical for clinical human studies.
Histochemical Analysis
After the PET study, the dogs were killed with concentrated potassium chloride. Guided by the laser positioning lights attached to the PET device, we marked the imaging positions directly on the myocardium for the open-chest dogs and on the chest for the closed-chest dogs. The heart was then excised and sliced at a thickness of 7.5 mm to correspond to each PET acquisition plane. The myocardial slices were stained with triphenyltetrazolium chloride (TTC) and then by the elastica Masson (EM) and hematoxylin-eosin (HE) procedures.
Comparison with H215O Equilibrium Image
After injection of a large bolus of H215O, equilibrium is reached when the distribution of H215O no longer reflects flow. More than 10 min are required to reach this point. Thus, PTF was calculated from a single static equilibrium image (equilibrium method) measured at more than 10 min. First, this image was normalized by calibrating the left ventricular region to the blood density (1.06 g/mL). The C15O blood-pool image (VB) was then subtracted from the normalized image to provide a distribution of the perfusable tissue. The water content in the blood was assumed to be 0.86 g water/g blood, and that in the myocardium was assumed to be 0.78 g water/g tissue (11); thus, the resultant image was divided by a factor of 0.91 (0.78/0.86) to provide the quantitative image of PTF in g tissue/mL. PTF values calculated from the dynamic data were then compared with those obtained by the equilibrium method.
Comparison with Microsphere MBF
Estimated MBF (MBFp) values were compared with microsphere estimates for 8 studies. Five small myocardial samples were taken from the inferolateral wall to determine the regional blood flow with the radiolabeled microsphere, and the MBFp values were compared with the microsphere flow values. Samples were not obtained from anteroseptal regions so as not to disturb the histochemical analysis around the infarcted zone.
Comparison with Histochemical Results
Regional values of PTF, PTI, and MBF were compared with histochemical and wall motion findings for all ROIs; histochemical infarct surface area was compared with defect surface area on PTF and MBF images; and the fraction of infarcted myocardium in a central slice determined by PTI was compared with that determined by histochemical analysis.
Regional Comparison.
The ROIs were drawn on the septum, the anterior wall that included the infarcted region, and the lateral wall using the extravascular density images (Dev) without reference to the functional images. The ROIs were then projected onto the functional MBFt and PTF images. A small (1 cm in diameter) ROI was also selected at the center of the myocardial infarction for each study, and PTF, Dev, and PTI values were calculated for this ROI.
Comparison of Defect Surface Area.
The surface area of the infarcted left ventricular wall on the stained slices was compared with the defect surface areas determined on the MBFt and PTF functional images. The length of the infarcted zone, including both transmural and nontransmural infarction, was measured on each of the TTC-stained slices along the left ventricular wall. The surface area of the infarction (ΔS [in square millimeters]) was then calculated as:
 Eq.2where Li (in millimeters) denotes the length of the infarcted zone on the i-th slice (defined along the center of the myocardial wall) and ΔZ (in millimeters) is the slice interval, which is equal to that of the PET device (7.5 mm). The defect surface areas were similarly calculated for the MBFt and PTF functional images. Here, a significant defect was defined as a functional value less than 50% of that in the control region, and Li was traced along the 50% of peak count boundary of the C15O blood volume image.
Comparison of Fraction of Infarcted Tissue.
In the 8 open-chest experiments, the average PTI in a large region over the whole myocardium of a midventricular slice was calculated. The calculated PTI values were then compared with the fraction of the histochemically defined noninfarcted tissue.
Statistical Analysis
All data were presented as mean ± 1 SD. Specific differences were detected by either a paired or an unpaired Student t test. P < 0.05 was considered statistically significant.
RESULTS
The electrocardiogram, using 18 electrodes, showed evidence of myocardial infarction in all animals (through the appearance of the Q wave compared with the preocclusion study). Echocardiography showed significant asynergy (hypokinesis to akinesis) in the anterior wall in all dogs. Four animals had hypocontractile function (hypokinesis to akinesis) in the septum also. Wall motion was normal in the lateral wall of all dogs.
The histochemical (TTC, EM, and HE) staining analysis confirmed myocardial infarction in the anterior wall of all animals. The distribution of the myocardial infarction was visually identical for the TTC, HE, and EM staining procedures, although in 1 heart, multiple small necrotic areas found with HE and EM were not obvious with TTC. Of the 12 dogs, 8 had transmural infarction and the other 4 had nontransmural infarction. Myocardial infarction was not evident in the septum or the lateral or inferior walls of any animals.
Visual agreement was good between the PTF images obtained from the dynamic data (weighted integration method) and those obtained by the equilibrium method (Fig. 1). Quantitative values of PTF also showed overall good agreement between the 2 methods for the 3 myocardial segments, as shown in Figure 2. The equilibrium method, however, provided slightly but significantly greater values (by approximately 10%) in the anterior wall region that included the myocardial infarction (0.332 ± 0.111 g/mL for the dynamic data versus 0.305 ± 0.113 g/mL for the equilibrium method, P < 0.05). No significant difference was found for other regions. For the lateral wall and septum, no significant difference between the weighted integration and the conventional NLLSF techniques was confirmed for estimated MBFt or PTF values. The anterior wall showed a significant difference between the 2 techniques (P < 0.001); namely, MBFt and PTF were greater with NLLSF than with the weighted integration method, by approximately 10% and 15%, respectively.
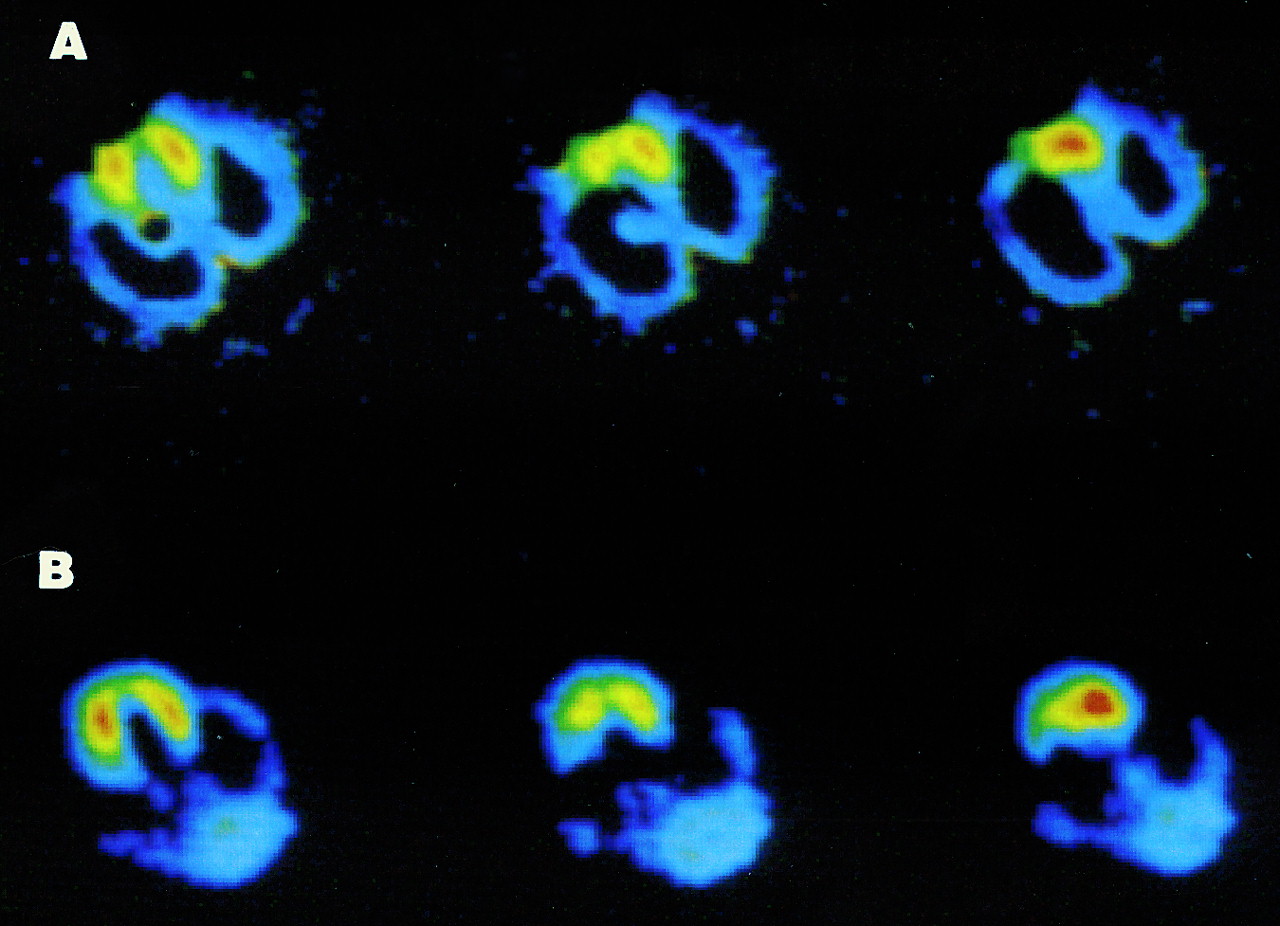
Comparison of PTF images obtained using 6-min dynamic images and weighted integration method (A) and those obtained using equilibrium method (B). Images represent 3 different transaxial slices. Small defect in anterior wall corresponds to myocardial infarction. Note that same color scale is used for the 2 functional images.

Comparison of PTF values obtained using 6-min dynamic images by weighted integration (WI) method with those obtained using equilibrium method. Symbols correspond to septum and to walls that included myocardial infarction. Data were obtained from all 12 dogs. No significant difference occurred between the 2 methods in septum or lateral wall, but PTF values were slightly but significantly greater in anterior wall for equilibrium method than for dynamic method (0.332 ± 0.111 g/mL and 0.305 ± 0.113 g/mL, respectively; P < 0.05).
PET functional parameters are summarized in Table 1 for the 3 myocardial regions. No significant difference was seen between the noninfarcted lateral wall and septum for either PTF or PTI. PTI was close to unity in these regions. PTF and PTI were significantly reduced in the anterior wall (which included the infarcted area) and also in the center of the myocardial infarction. PTF and PTI were significantly smaller in animals with a transmural infarction than in those with a nontransmural infarction (P < 0.05). In the septum, no significant difference was observed in PTF and PTI between animals with normal wall motion and those with abnormal wall motion. Because PTI may be affected by spillover from the chest wall, Table 1 shows only the open-chest results for the anterior wall. The mean anterior wall PTF values for all studies (n = 12) were 0.27 ± 0.10 g/mL for the whole area with transmural infarction and 0.37 ± 0.11 g/mL for the whole area with nontransmural infarction (P < 0.05). Corresponding values for the center of the myocardial infarction were 0.10 ± 0.06 g/mL for transmural infarction and 0.24 ± 0.12 g/mL for nontransmural infarction (P < 0.05).
Summary of PTF, Dev, and PTI Values for Each Segment
Table 1 also shows that no significant difference occurred in extravascular tissue density (Dev) between the transmural and the nontransmural infarcted segments at either the center of infarction or the whole anterior wall. Dev in the whole anterior wall was not significantly different from that in other segments in the open-chest animals. The anterior Dev value for the closed-chest animals was, on the other hand, 0.79 ± 0.11 g/mL, which was significantly greater (P < 0.001) than that for the open-chest animals because of spillover from the chest and was also greater than that for the other regions in the closed-chest animals (P < 0.001).
MBFp and MBFt were significantly reduced in the anterior wall and at the center of myocardial infarction, compared with the lateral wall (P < 0.01). MBFt for areas with transmural infarction was also significantly smaller than that for areas with nontransmural infarction. MBFp and MBFt in the septum were not significantly different from those in the lateral wall, but a significant difference was observed between animals with normal wall motion and those with abnormal wall motion. Regional blood flow determined by radiolabeled microspheres in the inferolateral wall (0.84 ± 0.33 mL/min/g, n = 8) agreed well with those determined by PET (MBFp, 0.88 ± 0.24 mL/min/g) and correlated significantly (P < 0.05; r = 0.835).
Figure 3 shows an example of PET images (MBFt and PTF) and histochemical staining analyses (EM and HE) from an open-chest experiment. In this study, severe wall motion dysfunction (akinesis) was observed in the septum and anterior wall on echocardiography. The stained specimen showed transmural infarction in the anterior wall but not in the septum. Although a decrease in the MBFt image (not confirmed by microspheres in this study) reflected the wall motion abnormality in the septum and anterior wall, the PTF image was decreased in only the anterior wall with the histochemically proven OMI. This pattern was seen in all 4 studies that showed asynergy in both the septum and the anterior wall (Table 1).
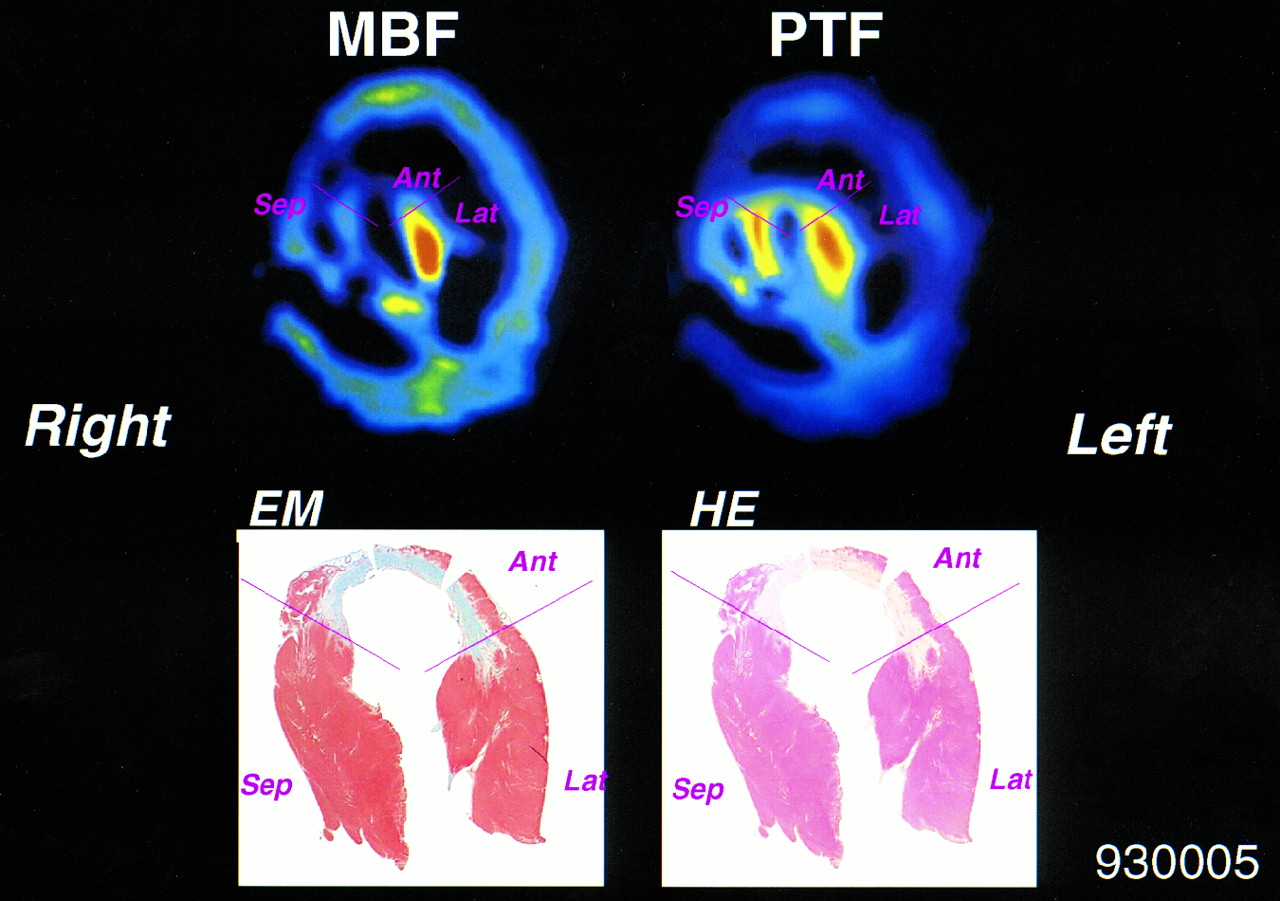
Representative MBFt and PTF images together with corresponding histochemical-stained (EM and HE) cross-section of myocardium. Ant = anterior wall; Lat = lateral wall; Sep = septum.
The defect surface areas in MBFt and PTF images were compared with the defect surface area of the histochemically defined infarcted zone along the left ventricular wall in Figure 4. The defect area in the PTF image agreed well with that in the histochemical analysis. In contrast, the defect area in the MBFt image was generally larger than that in the PTF image and, hence, larger than the surface area of OMI.
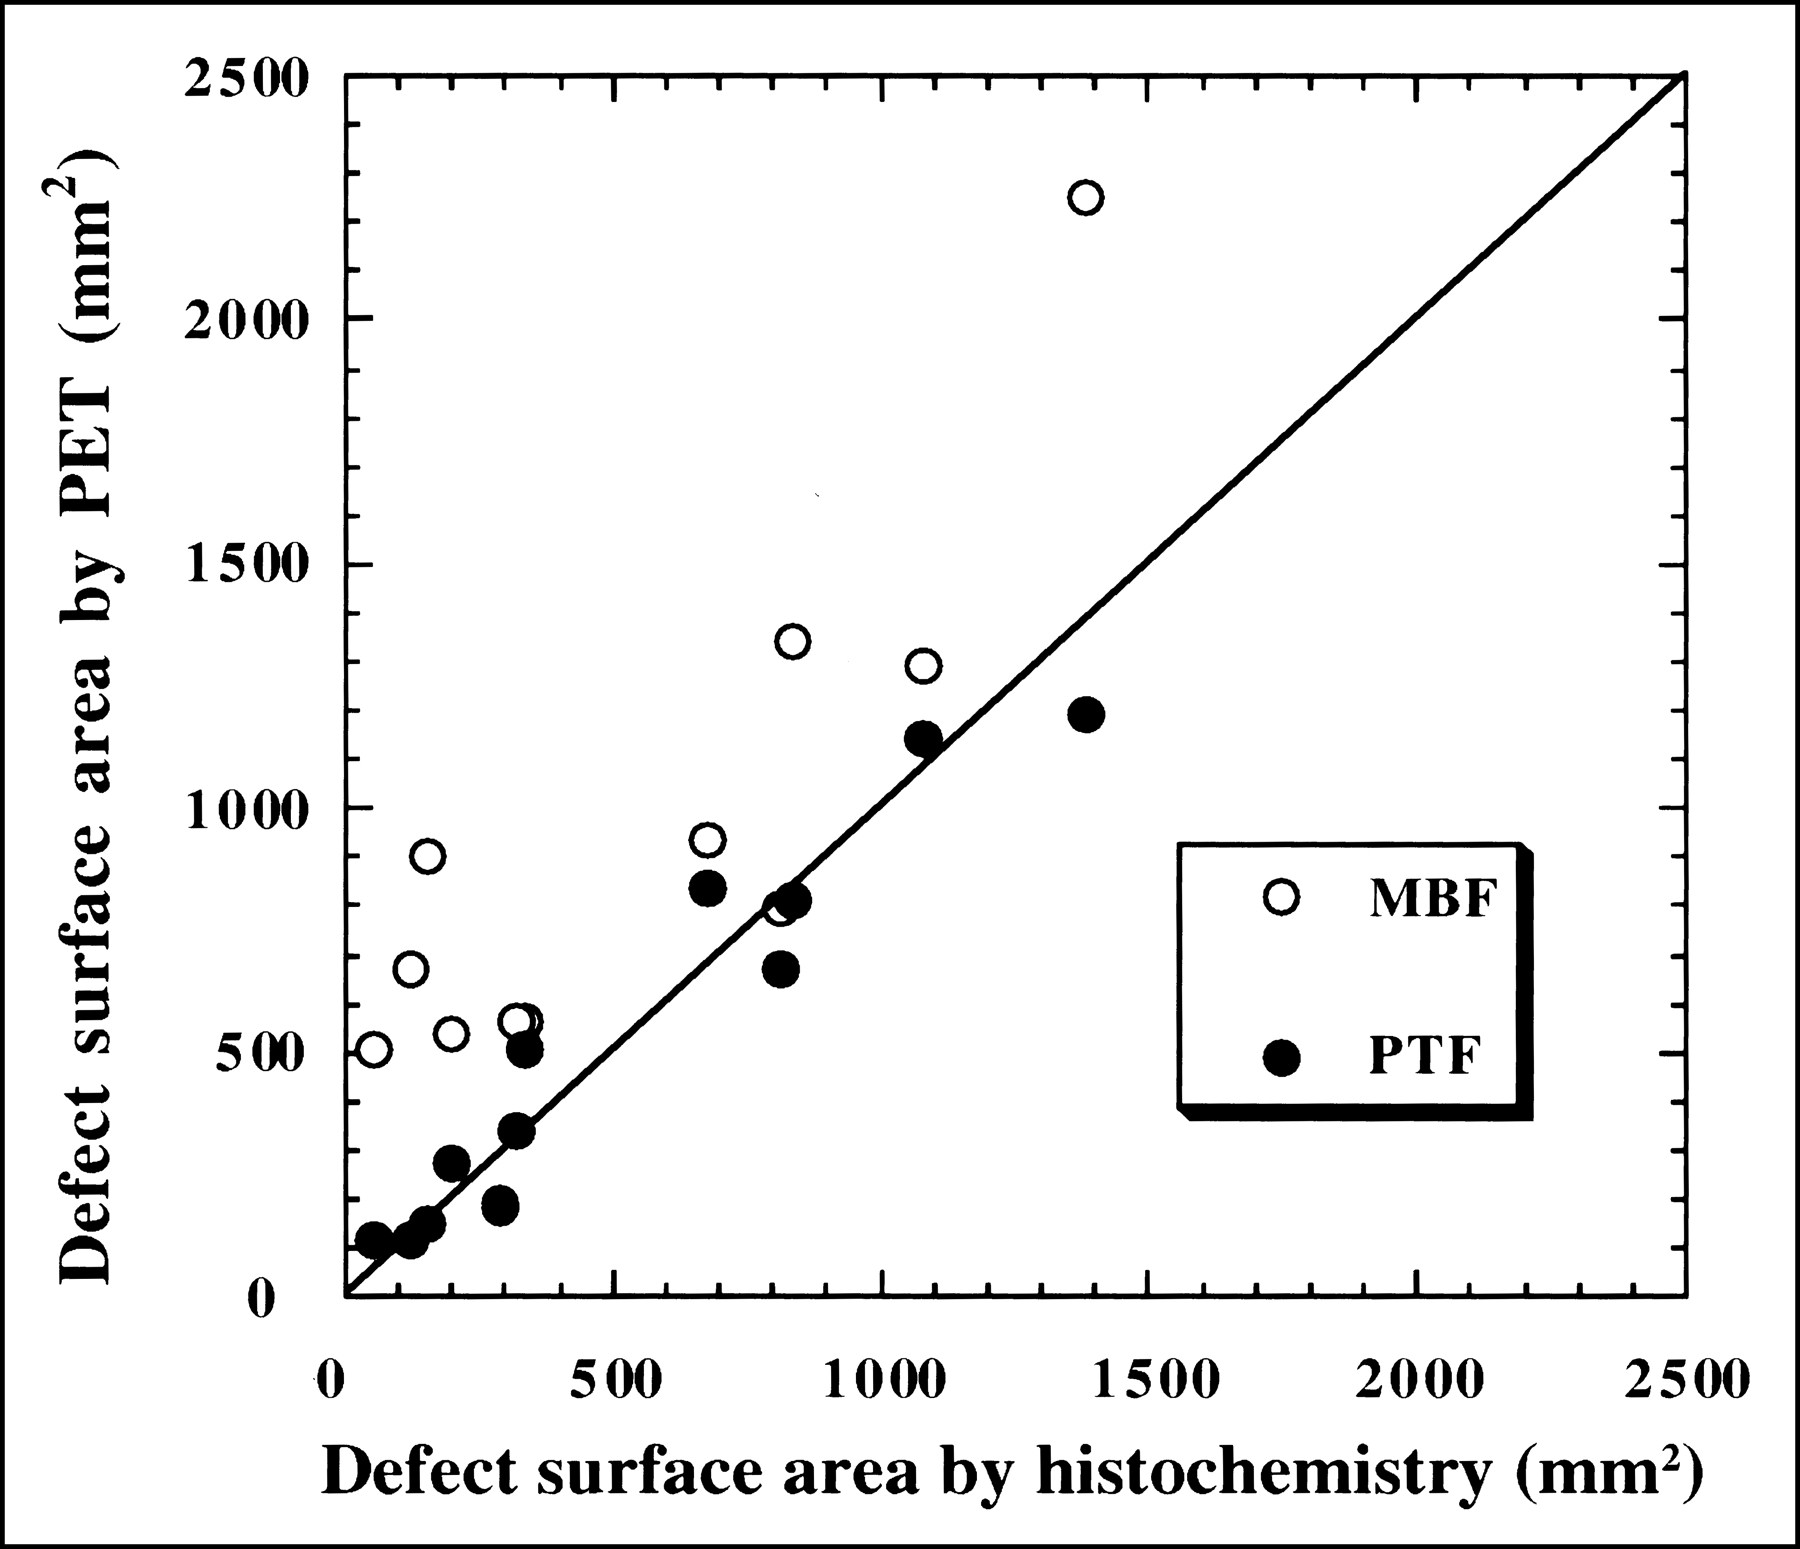
Comparisons of defect surface area identified on PTF and MBFt images and morphometric estimates of surface area of infarcted myocardium derived from myocardial slices stained with EM. Data were obtained from all dog studies (n = 12).
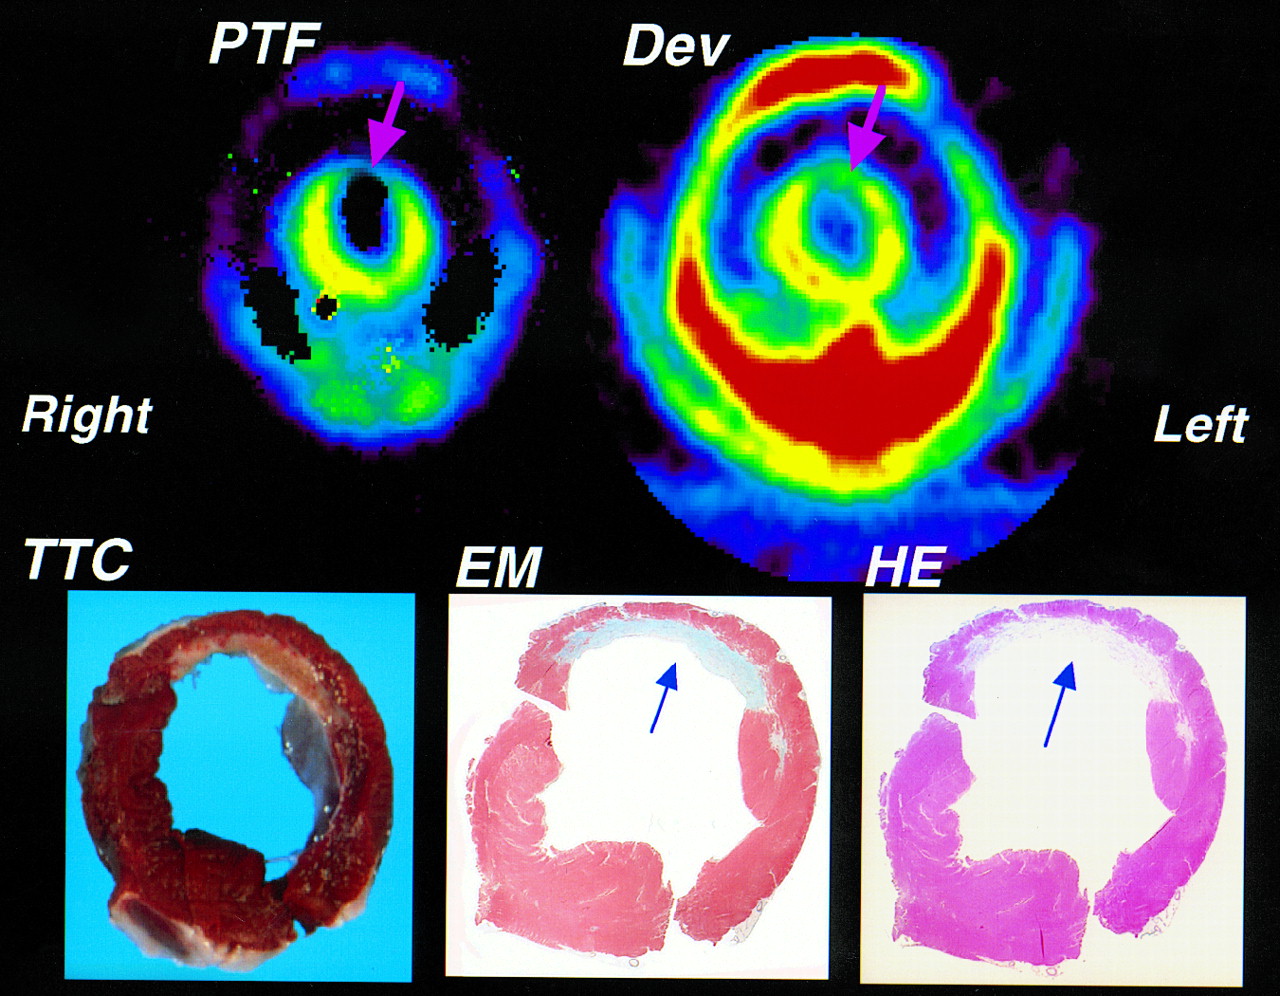
Figure 5 shows representative images of PTF and the Dev together with the histochemical-stained slices (TTC, EM, and HE). The stained slices indicated that the infarction in the anterior wall was nontransmural. Both PTF and Dev were reduced in the area of infarction. The decrease in Dev was caused by a decrease in the transmural wall thickness and the partial-volume effect. PTF was further reduced compared with Dev in the infarcted center, and PTI (calculated as PTF divided by Dev) was approximately 0.5 at the center of the infarction. This value is consistent with the finding that the nontransmural infarction had approximately 50% residual tissue (Fig. 5).

Comparison of PTF and Dev images together with histochemical-stained slices (TTC, EM, and HE). Data were obtained from open-chest experiment in which slice position for histochemical analysis was carefully determined on scanner bed by marking PET tomographic slice position directly on myocardium guided by laser beams. Arrows point to nontransmural infarction.
PTI calculated for the whole midventricular slice obtained from the open-chest experiments (n = 8) was compared with the fraction of the histochemically defined noninfarcted tissue in Figure 6. This fraction was 0.83 ± 0.08 for the midventricular tomographic slice, whereas PTI was 0.87 ± 0.09 for the corresponding slice. Although PTI was significantly greater (P < 0.01) than the proportion of noninfarcted tissue, the correlation between the 2 quantities was significant (y = 0.073 + 0.963x; r = 0.88; P < 0.001).
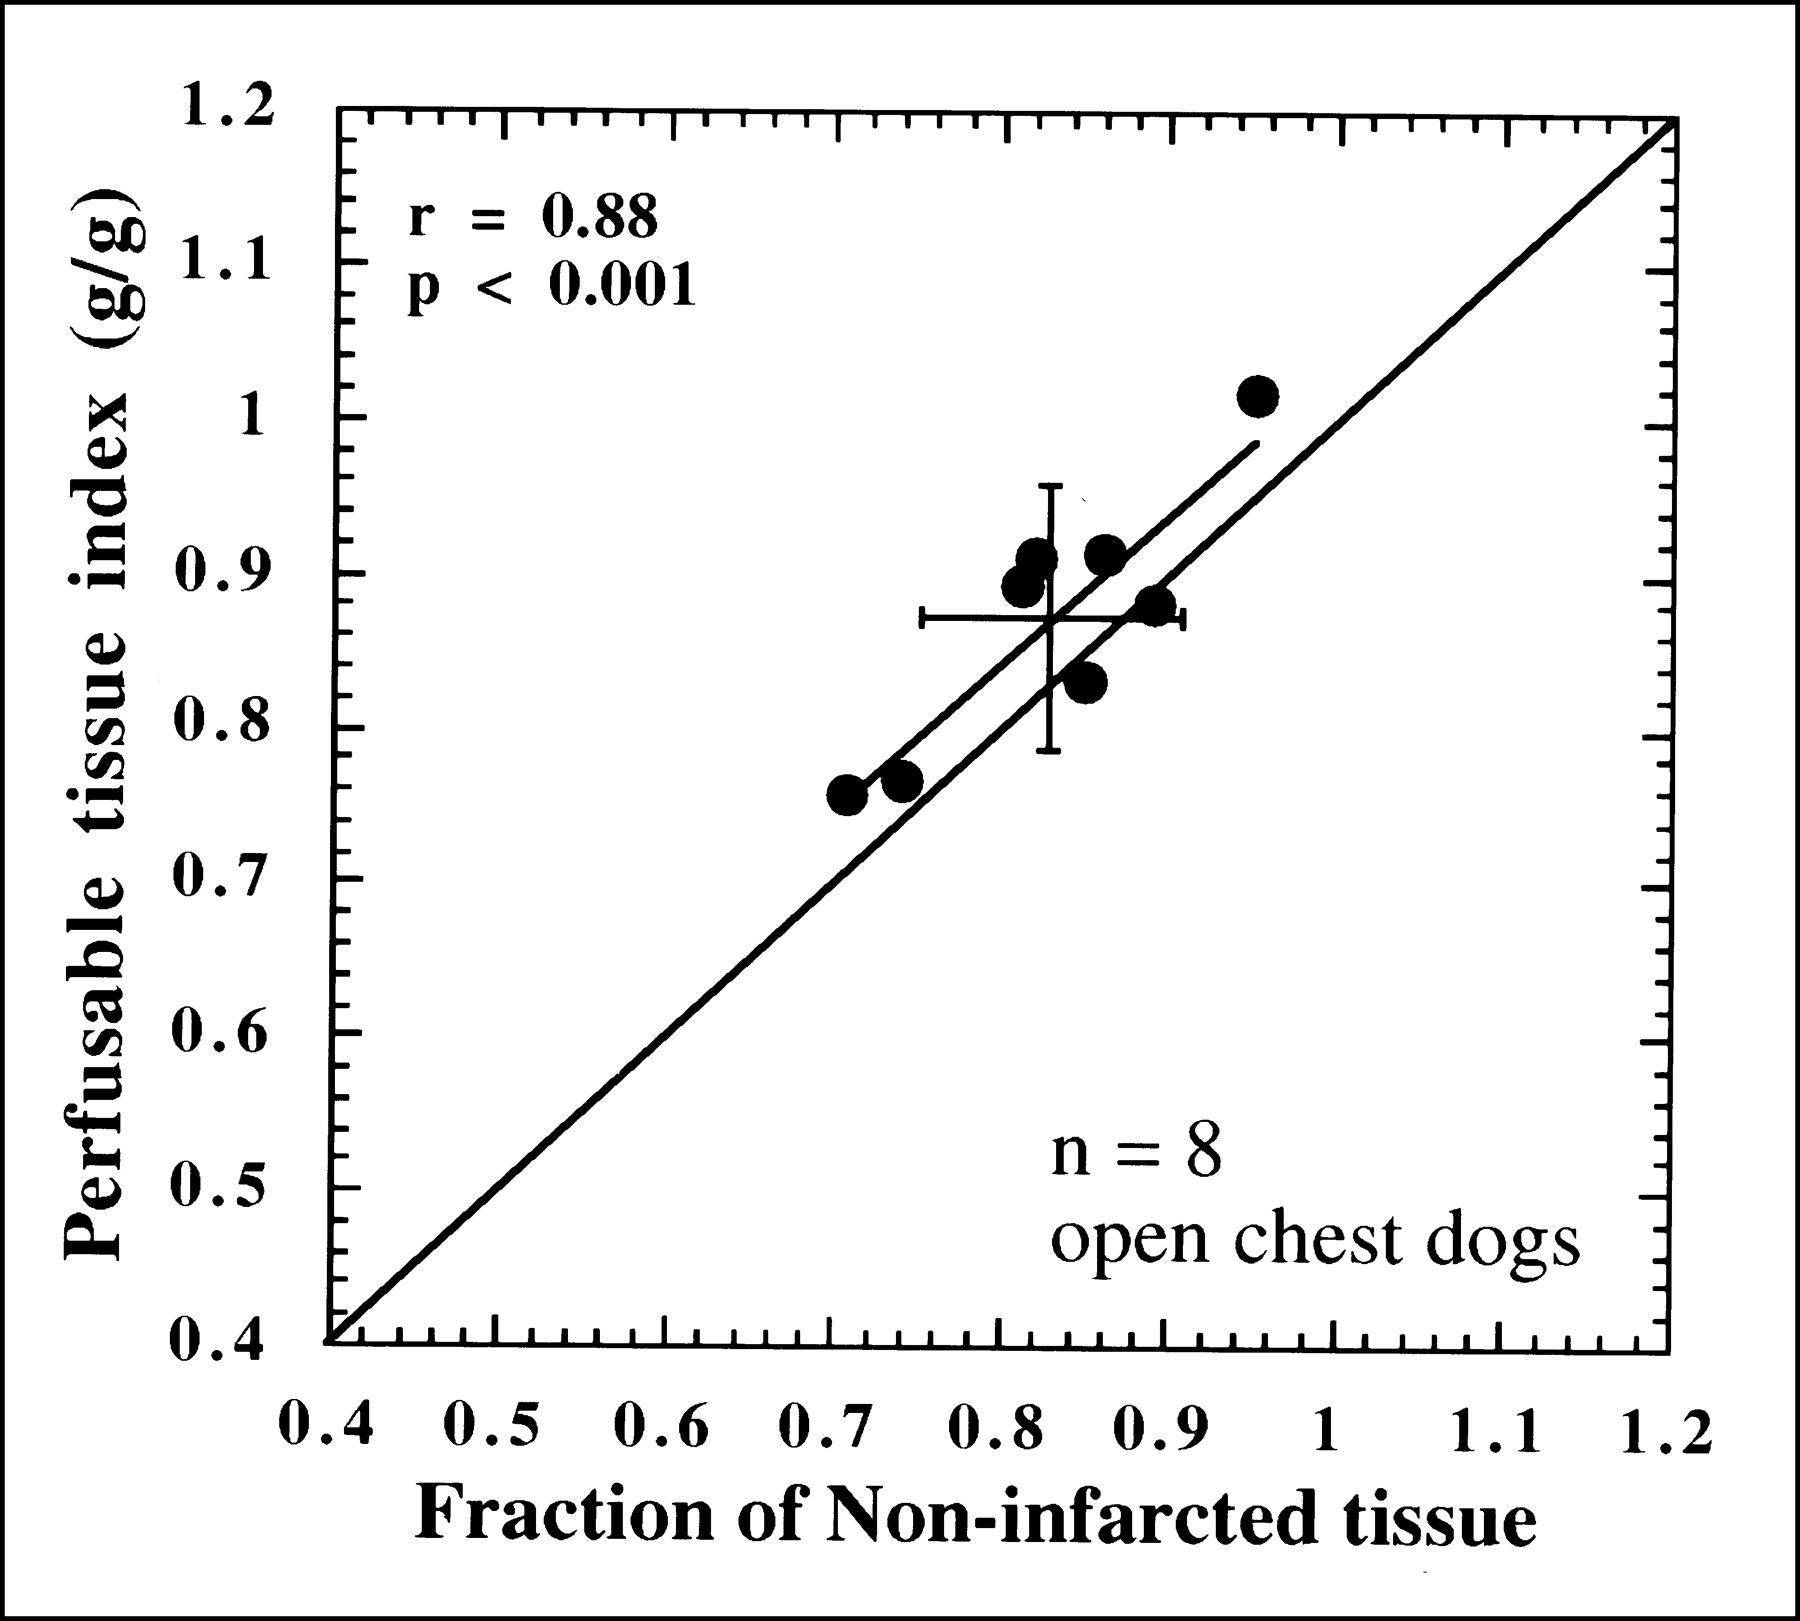
Comparison of PTI values with fraction of histochemically normal tissue for whole midventricular slice. Correlation was significant (y = 0.073 + 0.963x), although PTI values were significantly greater than results from morphologic estimates (0.87 ± 0.09 and 0.83 ± 0.08, respectively; P < 0.01).
DISCUSSION
In this study, we found that PTF calculated from early dynamic images after intravenous H215O administration agreed well with PTF obtained from the equilibrium myocardial H215O distribution. PTF and PTI could distinguish between infarcted and noninfarcted regions and were normal in dysfunctional (akinetic) but noninfarcted wall segments, which did, however, have decreased blood flow. The physical extent and size of the infarct defined by PTF and PTI agreed reasonably well with those of the histochemically defined infarct both visually and quantitatively.
Identification of Infarcted Tissue by PTF and PTI
H215O is a diffusible and chemically inert tracer (21). The early distribution after the administration of H215O reflects regional blood flow (22–24). On the other hand, rapid clearance from high-flow areas and further uptake into low-flow areas cause the H215O distribution, after a sufficient long delay, to be proportional to the distribution of perfusable tissue. According to our simulation study, the H215O distribution is expected to reach equilibrium 10 min after the bolus injection, and this technique is probably the simplest for visualization of PTF. However, because of the need for a large injected activity owing to the short half-life of 15O (e.g., 3.7 GBq for a 10- to 20-kg animal in this study), application of this technique to clinical studies is not practical. The present approach, which estimates the quantitative PTF (in addition to the MBFt) from the early dynamic dataset, requires only a tenth of the activity (370 MBq) and provides values that essentially agree with those obtained by the equilibrium technique (Fig. 2).
According to an early work in Europe (25), the radiation dose (whole-body effective dose) for this protocol can be estimated as 3–6 mSv, including C15O and H215O scans with an administration dose of 3.7 GBq and 370 MBq, respectively. This level of radiation is smaller than that for the typical combined protocol of 13N-ammonia and FDG, that is, 5–7 mSv with administration of 740 MBq 13N-ammonia and 185 MBq FDG.
This study also showed that the estimated PTF and PTI values were significantly smaller in infarcted regions and correlated with the degree of infarction; that is, regions with transmural infarction had significantly lower PTF (and PTI) values than did regions with nontransmural infarction. In contrast, in asynergic but noninfarcted septal segments, both PTF and PTI were preserved and not significantly different from normal control segments, whereas both MBFp and MBFt were reduced. Thus, PTF and PTI values can identify infarcted regions and differentiate infarcted areas from ischemic but noninfarcted areas. In addition, the distribution of tissue necrosis identified by histochemical staining (TTC, EM, and HE) corresponded well visually with the defect in PTF images. Quantitatively, the PTF defect surface area, using a cutoff of 50% of the normal PTF value, agreed well with the histochemically defined infarct area. The average PTI (ratio) for a given slice should correspond to the fraction of histochemically defined nonscar tissue in the slice. We found a good correlation between PTI and the fraction of noninfarcted tissue (Fig. 6), although a small but significant difference was present. This small overestimation of PTI can be explained by the exclusion of only Va in the calculation of PTF, whereas the calculation of Dev subtracts both arterial and venous blood volumes from the tissue signal (8–10). This factor causes PTI to be overestimated by approximately 10% in normal myocardium (8), a value that is consistent with our observation.
Thus, by directly comparing PTF and PTI with histochemical findings, we have shown that PTF and PTI can estimate the extent of infarction and the proportion of nonscar tissue in a given area of myocardium in OMI. Hypocontractile ischemic segments that have preserved PTF (and PTI) with a threshold level given in previous articles (8–10) should therefore be viable and can potentially benefit from revascularization.
Validity of Mathematic Procedures
Weighted integration is a convenient method for calculating functional images. Although the H215O methodology requires image manipulation, including blood volume subtraction using the C15O dataset, the MBFt and PTF images can be calculated automatically and require only selection of an ROI in the left ventricle. Earlier studies found that this technique provided quantitative values that were consistent with those obtained by the conventional NLLSF approach (14,15,26), and our study confirms this finding. Good agreement between MBFp and the in vitro microsphere flow measurement in the lateral wall further suggests the validity of this mathematic approach, although a potential limitation in the left ventricular injection of labeled microspheres still exists (i.e., incomplete mixing of the spheres). However, the NLLSF method yielded PTF and MBFt values in the infarcted segment that were approximately 10% and 15% greater, respectively, than were those obtained with the weighted integration method. Although the validity of MBF quantitation in areas of reduced MBF remains unknown, particularly in OMI segments, this small discrepancy can, at least partly, be explained by the overestimation in NLLSF caused by the limited count statistics in the infarcted region (27). Simultaneous determination of 3 parameters—MBFt, PTF, and Va—using NLLSF in areas of low count statistics (i.e., reduced flow or necrotic tissue) was shown to cause not only increased statistical uncertainty but also a systematic bias (overestimation) in both MBFt and PTF. Suggestions to minimize this systematic bias have included fitting only 2 parameters—MBFt and PTF—with a measured (fixed) Va (27); improving the image reconstruction algorithm, as has successfully been shown by Katoh et al. (28); or improving the count statistics of time–activity data using larger ROIs (13).
Recently, Gerber et al. (29) showed that the regional MBF values determined by H215O were significantly greater than those determined by 13N-ammonia in infarct regions. Those investigators claimed that the former methodology is not preferred over the latter. Although correct values are not known for that comparison, the discrepancy between the 2 methods may be caused by the limited count statistics in the regions with infarction. Systematic overestimation can also result if the noninvasive input function is not corrected for the limited recovery of the left ventricular (or left atrial) chamber, as has been shown (13). Further investigation is required.
Effects of Flow Heterogeneity
In the penumbra of the myocardial infarction, the microscopic flow distribution is unlikely to have the homogeneity assumed by the model; in theory, systematic errors in PTF as well as in MBF can result (30). Using simulations, Herrero et al. (31) showed that PTF (and hence PTI) could be underestimated by 25% at maximum for tissues containing a mixture of 4 different flows with a minimum flow level greater than 0.10 mL/min/g. Iida et al. (32), in a simulation of dynamic H215O studies in the brain, showed that the blood–brain partition coefficient of water (equivalent to PTF in the heart) could be systematically underestimated by 20% because of flow heterogeneity in regions containing a mixture of gray matter and white matter. However, Herrero et al. also showed that, for mixtures of extremely low-flow tissue (e.g., MBF < 0.01 mL/min/g), which should correspond to scar tissue, the estimated MBF and PTF well represent the values for only the high-flow tissue. Thus, PTF well represents the fraction of nonscar tissue around the myocardial infarction, and MBF should correspond to the flow for nonscar tissue. The work by Herrero et al. suggested that perfusion was low enough in the scar tissue to be neglected in the PTF and MBF calculations. In addition, we observed that NLLSF analysis of averaged ROI regions provided greater PTF values than did pixel-by-pixel calculation. This difference could not be explained by flow heterogeneity. Thus, flow heterogeneity is unlikely to be a significant source of error in practical applications.
Herrero et al. (31) also showed that H215O can diffuse into necrotic infarcted tissue within a PET study period. Diffusion into areas of scarring may explain the slightly but significantly higher PTF values obtained by the longer equilibrium method. Diffusion, along with the limited resolution of the PET scan and partial-volume effects, may contribute to the fact that PTF and PTI did not approach zero in scar tissue. The exact magnitude by which PTF (and PTI) are overestimated in infarcted tissue is unknown, and further systematic study is required.
Study Limitations
This study was designed to validate the underlying hypothesis that PTF and PTI indicate the physical extent of myocardial infarction, in a global sense. The accuracy of this approach in assessing myocardial viability needs to be further studied in a much larger patient population (9,10). Further study is also needed to compare this approach with other independent methods, such as FDG imaging, in clinical settings.
PTI and histochemical staining were compared in open-chest dogs, to avoid the confounding effect of chest-wall artifacts. PTI measurements may be unreliable in the anterior wall in some clinical studies, because spillover from the chest wall in the transmission study can cause systematic overestimation of Dev and, hence, underestimation of PTI for part of the anterior wall. In this study, anterior wall Dev in closed-chest dogs was 0.73 ± 0.06 g/mL (n = 4), compared with 0.48 ± 0.05 g/mL (n = 8) in open-chest dogs, resulting in a significant (∼30%) underestimation of PTI in the anterior wall of the closed-chest dogs. This effect is expected to be more pronounced in dysfunctional and dilated hearts. Pericardial fat accumulation around the inferolateral wall may also overestimate Dev and, hence, underestimate PTI, particularly in obese patients. On the other hand, a study showed that calculated PTF values were relatively homogeneous throughout the left ventricular wall in healthy volunteers, provided that the ROI selection was standardized (20). In addition, recovery of the contractile function of the wall after revascularization was well predicted not only by PTI but also by PTF alone (33). Thus, although PTI is largely unaffected by partial-volume effects caused by limited resolution of the PET scanner and wall motion, the use of PTF, rather than PTI, may be recommended in clinical studies.
Movement of a patient during a study is an important source of error. Transmission scans both at the beginning and at the end of the study are recommended, and significant movement between the 2 transmission scans has to be corrected or the study has to be repeated. Also recommended, as shown by Hermansen (34), is a methodology that does not require separate blood-pool scanning using 15O-carbon monoxide. Further investigation would be of value.
CONCLUSION
The distribution of water-perfusable myocardium estimated by 15O tracers and PET corresponded well to the histochemically proven noninfarcted tissue seen in a PET resolution of an animal model of OMI. Consequently, the PTF/Dev ratio (PTI) correlated well with both the histochemically determined defect surface area and the histochemically determined fraction of noninfarcted tissue in OMI. Despite some clinical limitations, measurement of PTF and PTI may be a reliable standard for evaluating other clinical protocols that assess myocardial viability. The PTI threshold for wall motion recovery (∼0.7 in earlier studies) should represent the lower limit of the proportion of histologically identified residual (noninfarcted) tissue in the asynergic segment.
Acknowledgments
The authors thank the staff of the Research Institute for Brain and Blood Vessels, particularly Yasuaki Shoji for handling the PET scanner and Youzou Itoh and Ryoetsu Satoh for helping with animal preparation. This study was supported in part by a grant from the Japan Heart Foundation and a research grant for cardiovascular diseases (8C-5, 1996–1998) from the Ministry of Health and Welfare of Japan.
Footnotes
Received Aug. 31, 1999; revision accepted Mar. 20, 2000.
For correspondence or reprints contact: Hidehiro Iida, DSc, PhD, Department of Investigative Radiology, National Cardiovascular Center—Research Institute, 5-7-1 Fujishiro-dai, Suita City, Osaka, 565-8565, Japan.
REFERENCES
In this issue


Jump to section
Related Articles
Cited By...
- Quantitative Perfusion Imaging with Total-Body PET
- Non-invasive imaging to identify susceptibility for ventricular arrhythmias in ischaemic left ventricular dysfunction
- 15O-Water PET Study of the Effect of Imatinib, a Selective Platelet-Derived Growth Factor Receptor Inhibitor, Versus Anakinra, an IL-1R Antagonist, on Water-Perfusable Tissue Fraction in Colorectal Cancer Metastases
- Impaired Hyperemic Myocardial Blood Flow Is Associated With Inducibility of Ventricular Arrhythmia in Ischemic Cardiomyopathy
- Parametric Images of Myocardial Viability Using a Single 15O-H2O PET/CT Scan
- Experimental Pig Model of Old Myocardial Infarction with Long Survival Leading to Chronic Left Ventricular Dysfunction and Remodeling as Evaluated by PET
- Blood flow and Vd (water): both biomarkers required for interpreting the effects of vascular targeting agents on tumor and normal tissue
- Microvascular Function in Viable Myocardium After Chronic Infarction Does Not Influence Fractional Flow Reserve Measurements
- Generation of Parametric Image of Regional Myocardial Blood Flow Using H215O Dynamic PET and a Linear Least-Squares Method
- Parametric Imaging of Myocardial Blood Flow with 15O-Water and PET Using the Basis Function Method
- Delayed Contrast Enhancement and Perfusable Tissue Index in Hypertrophic Cardiomyopathy: Comparison Between Cardiac MRI and PET
- Perfusable Tissue Index as a Potential Marker of Fibrosis in Patients with Idiopathic Dilated Cardiomyopathy
- Comparison of Microsphere-Equivalent Blood Flow (15O-Water PET) and Relative Perfusion (99mTc-Tetrofosmin SPECT) in Myocardium Showing Metabolism-Perfusion Mismatch
- Absolute Quantification of Myocardial Blood Flow with H215O and 3-Dimensional PET: An Experimental Validation