


Abstract
Fractional flow reserve (FFR) is an index of coronary stenosis severity. FFR is the ratio of hyperemic myocardial flow in the stenotic area to maximal flow in that same territory without stenosis and can be measured with a pressure wire. In patients with prior infarction, measuring FFR in infarct-related arteries may be different for 2 reasons: a smaller mass of viable myocardium depending on the stenotic infarct-related artery and greater microvascular resistance in the infarcted area than in the reference area. When microvascular resistance does not differ between the infarcted and the reference areas, FFR should equal relative flow reserve (RFR). RFR is the ratio of myocardial blood flow in the stenotic area to blood flow in a normally perfused reference area, at maximal hyperemia. H215O PET measures myocardial flow within only the viable areas of an infarct and can be used to measure RFR. The present study assessed in patients with chronic myocardial infarction whether microvascular resistance in the infarct is different from that in the reference area. Therefore, the correlation between FFR and RFR using H215O PET was studied. Methods: In the catheterization laboratory, FFR was measured in the infarct-related artery and a reference coronary artery. The H215O PET study and FFR measurements were performed on the same day in 22 patients. Results: In 27 patients, the mean interval between the PET study and infarction was 3.3 y. Most patients had an anterior infarction, and the mean ejection fraction was 44%. The mean FFR and RFR values were 0.75 ± 0.16 and 0.74 ± 0.18, respectively. A significant correlation (r = 0.81; P < 0.0001) was found between FFR and RFR. The linear regression line was close to the line of identity. Conclusion: In patients with chronic myocardial infarction and a reduced ejection fraction, a good correlation was found between FFR measurements in the infarct-related artery and RFR. Because the linear regression line between FFR and RFR was close to the line of identity, one can conclude that microvascular resistance in the viable myocardium does not differ from that in the reference area.
Coronary angiography remains one of the cornerstones in the evaluation of patients with coronary artery disease. However, the hemodynamic significance of a stenosis is difficult to assess from the angiogram alone. Measurement of fractional flow reserve (FFR) with a pressure wire is a simple and reliable index to determine the functional significance of a coronary stenosis. In patients with preserved left ventricular function, a well-defined cutoff of 0.75 has been shown to accurately distinguish hemodynamically significant stenoses (1–6).
In patients with a prior myocardial infarction, however, measurement of FFR in the infarct-related artery may be biased, for 2 reasons: the mass of viable myocardium depending on the stenotic infarct-related artery is smaller for a similar degree of stenosis, and microvascular resistance may be greater in the infarcted area than in the reference area, possibly blunting maximal hyperemia. To investigate the value of FFR measurements in patients with prior infarction, one needs to address these 2 potential pitfalls. The first issue can be addressed by using H215O PET to measure myocardial flow. H215O PET provides perfusion data only on the viable myocardium within an infarcted region (7–9). Because flow is expressed per milliliter of perfusable (viable) tissue, the smaller amount of viable myocardium within the infarcted area is accounted for and, thus, comparison of blood flow between the infarcted and reference myocardial areas is possible. The second issue can be examined by correlating FFR with relative flow reserve (RFR). FFR is the ratio of hyperemic myocardial flow in the stenotic area to maximal flow in that same territory without stenosis (4). RFR is the ratio of myocardial blood flow in the stenotic area to blood flow in a normally perfused reference area, at maximal hyperemia (10). If microvascular function in the viable, chronically infarcted myocardium does not differ from that in the reference area, and if the reference coronary artery has no stenosis, FFR should equal RFR; if microvascular resistance is higher in the infarcted area than in the reference area, FFR will be higher than RFR.
The present study assessed whether, in patients with chronic infarction, microvascular resistance in the infarcted area is different from that in the reference area. Therefore, the correlation between FFR and RFR measurements was examined using 15O-labeled water and PET. Furthermore, the best FFR cutoff was determined in these patients, based on the results of noninvasive stress testing.
MATERIALS AND METHODS
Study Population
Patients were included in the study if they fulfilled the following criteria: a documented single myocardial infarction more than 2 mo before the study, a nonoccluded infarct-related artery with a proximal culprit lesion, and at least one normal non–infarct-related coronary artery. Patients whose infarct-related or normal non–infarct-related artery was a nondominant right coronary artery were not included. PET and FFR measurements were performed on the same day in 22 patients; in the remaining 5 patients, the interval between the 2 procedures was less than 1 wk. For all patients, recent information was available from dobutamine stress echocardiography or 99mTc-sestamibi perfusion scintigraphy on the extent and location of the infarcted area and whether it was ischemic. The study was approved by the medical ethical committee of the VU University Medical Centre. Written informed consent was obtained from all patients.
Myocardial Perfusion Scintigraphy
SPECT was performed according to a 2-d stress/rest protocol. Exercise or adenosine was used for the stress images. 99mTc-labeled sestamibi was injected at maximal exercise or after intravenous infusion of adenosine (0.14 mg/kg per minute). SPECT was performed using a 2-head γ-camera equipped with low-energy high-resolution collimators. The images were acquired using a 360° circular orbit and were analyzed using a 13-segment model (11). Stress and rest segments were semiquantitatively scored as normal (grade 0) or as having a mild, moderate, or severe (grade 3) perfusion defect. Perfusion defects were allocated to the territory of a coronary artery. Defects in the anterior and anteroseptal region were allocated to the left anterior descending coronary artery, defects in the posterolateral wall to the left circumflex coronary artery, and inferior and basal inferoseptal defects to the right coronary artery. Apical defects were considered to be in the region of the left anterior descending coronary artery, unless the defect extended to the posterolateral (left circumflex coronary artery) or inferior (right coronary artery) wall. Perfusion defects were considered to be reversible and positive for the presence of ischemia when the rest perfusion score improved by one grade or more over the stress score. Segments with irreversible perfusion defects or normal perfusion were considered negative for the presence of ischemia. The scintigrams were scored by 2 experienced cardiologists; in cases of disagreement, a third cardiologist scored the images to achieve a majority decision.
Dobutamine Stress Echocardiography
An intravenous infusion of dobutamine was started at a rate of 10 μg/kg per minute and was increased by 10 μg/kg per minute every 3 min until either wall motion abnormalities were observed or a maximal rate of 40 μg/kg per minute was reached. In patients who did not reach 90% of their age-adjusted maximal heart rate and who had no objective signs of ischemia, 0.25 mg of atropine was given every minute up to a maximum of 1.0 mg while the dobutamine infusion was continued. Endpoints for stopping the infusion were the same as mentioned in the guidelines (12). Two-dimensional echocardiography was performed, obtaining parasternal long- and short-axis views and apical 4- and 2-chamber views. Imaging was performed throughout the study and during recovery until resolution of new wall motion abnormalities. Online digital images in quad screen format were analyzed for the presence, extent, severity, and location of segmental wall motion abnormalities. Myocardial contractile function was graded as normal, hypokinetic, akinetic, or dyskinetic in each segment. An echocardiographic stress test was considered positive when new or worsening stress-induced wall motion abnormalities were observed. The standard algorithm was used to assign ventricular segments to coronary territories: left anterior descending coronary artery (basal and midanteroseptal segments; basal, mid, and apical anterior segments; and mid and apical septal and apical lateral segments), left circumflex coronary artery (basal and mid lateral segments and basal and mid posterior segments), and right coronary artery (basal, mid-, and apical inferior segments and basal septal segments) (13). The dobutamine stress echocardiograms were scored by 2 experienced cardiologists; in cases of disagreement, a third cardiologist scored the images to achieve a majority decision.
PET Study
A short rectilinear transmission scan was performed to ascertain that the heart was positioned in the center of the view of the scanner. Then, a complete transmission scan was obtained to correct the subsequent emission scans for tissue attenuation. After the transmission scan, myocardial perfusion was measured using a dynamic H215O scan sequence. This measurement was taken at baseline and after hyperemia, induced by intravenous administration of adenosine (140 μg/kg/min). Finally, a static C15O scan was obtained to image the blood volume. Anatomic tissue images were generated by subtracting the blood pool from the transmission images. Transaxial anatomic tissue images of the left ventricle were reoriented according to the anatomic axis of the heart and displayed as short-axis slices. The same reslicing parameters were applied to the dynamic H215O images. Regions of interest were defined manually on the transaxial images at the basal, midventricular, and apical levels. Each basal and midventricular slice was divided in 6 equidistant sectors starting from the posterior insertion of the right ventricular free wall into the left ventricle. Corresponding regions of interest from a variable number of slices were grouped in each patient to generate 13 volumes of interest (6 basal, 6 midventricular, and 1 apical). Additional regions of interest were defined in the left and right ventricular chambers. The latter set was projected on the dynamic H215O images to generate image-derived input functions. The standard single-tissue-compartment model was used together with these input functions to determine myocardial blood flow (mL/min/mL of perfusable tissue), including intrinsic corrections for spillover from both left and right ventricles (14).
The original 13 regions of interest were regrouped into 5 larger segments (anteroseptum, inferoseptum, anterior, lateral, and inferoposterior walls). The apex and the anterior and anteroseptal walls were allocated to the left anterior descending coronary artery, the lateral wall to the left circumflex coronary artery, and the inferoseptum and inferoposterior wall to the right coronary artery. The RFR was defined as the ratio of myocardial perfusion in the infarcted area to perfusion in the contralateral normally perfused area, at hyperemia.
Quantitative Angiography and FFR Measurement
A 6- or 7-French guiding catheter was positioned in the coronary ostium, and the aortic pressure was measured. After intracoronary administration of 0.2 mg of isosorbide dinitrate, an angiogram of the infarct-related artery was made in 2 orthogonal projections. Nitrates were given to maximize epicardial dilatation. In this way, flow-mediated vasodilatation, which may affect the FFR measurement, was prevented. In addition, nitrates prevent coronary spasm from being induced by the presence of the wire in the coronary stenosis. Quantitative coronary angiography was performed off-line using the CAAS II system (Pie Medical Data). A pressure wire (WaveWire; Volcano Therapeutics) was advanced to the tip of the guiding catheter. At that time, both pressures were verified to be identical. Then, the wire was positioned distal to the coronary stenosis and the distal pressure was recorded. Maximal hyperemia was induced by intracoronary administration of 40 μg of adenosine. FFR was calculated as the ratio of distal pressure to aortic pressure at maximal hyperemia. Afterward, FFR was also determined in the contralateral reference coronary artery.
Statistics
All data are presented as mean ± SD. Differences in continuous variables between groups were compared using the Student t test. The relationship between FFR and RFR was assessed using linear regression analysis. A value of P less than 0.05 was considered significant. Receiver operator characteristics were calculated to determine the best FFR cutoff value to predict ischemia in the infarcted area by noninvasive testing. The sensitivity, specificity, and FFR cutoff to determine ischemia were calculated.
RESULTS
The clinical characteristics of the 27 patients are summarized in Table 1. The interval between the PET study and myocardial infarction varied widely. Most infarctions were at the anterior wall. The infarction was treated by primary coronary angioplasty in 8 patients, thrombolysis in 11 patients, and rescue angioplasty in 2 patients. In 6 patients, no reperfusion therapy was performed. The mean ejection fraction was 44% ± 15%.
Clinical Characteristics of Patients (n = 27)
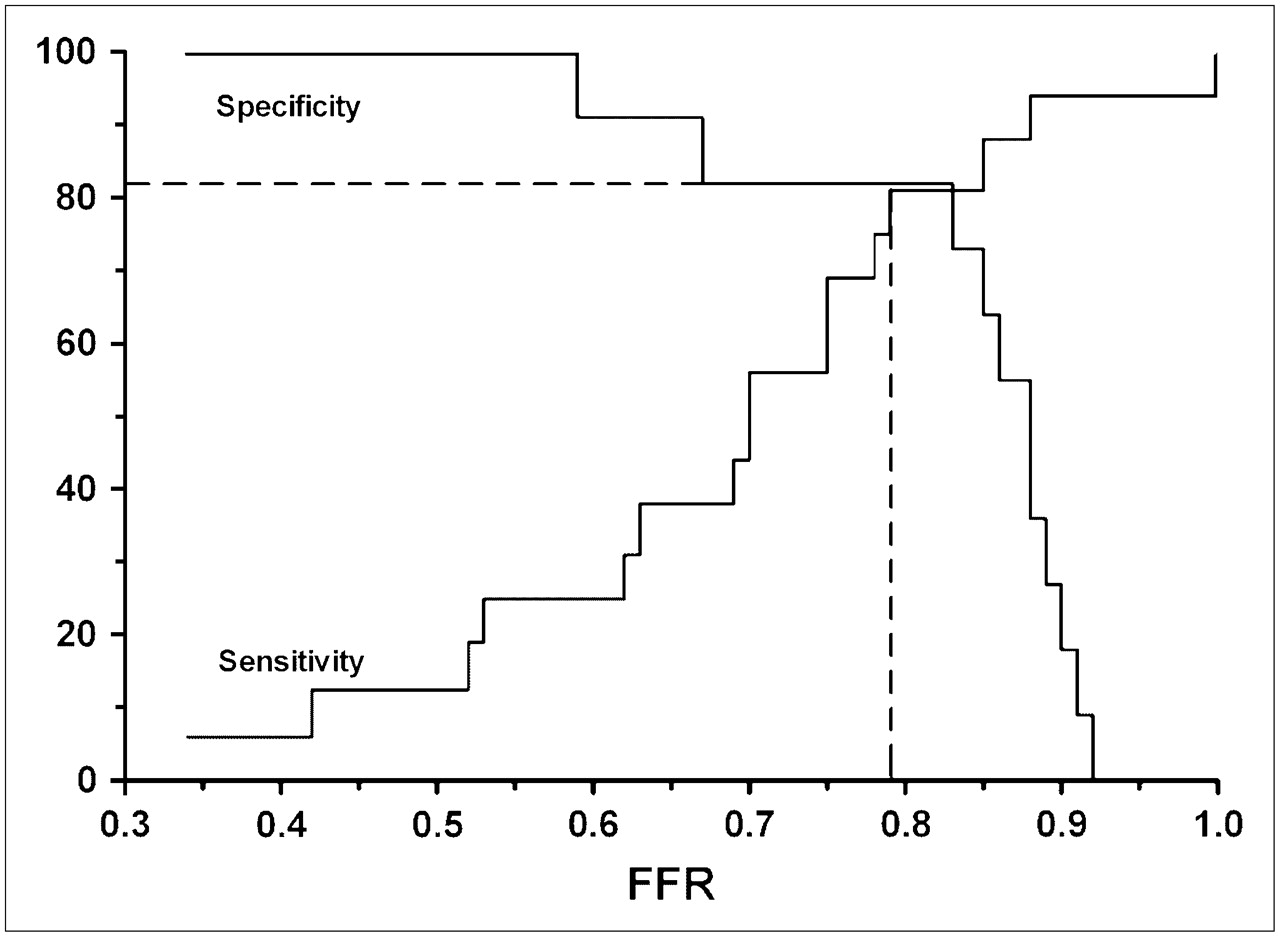
Table 2 displays the angiographic, hemodynamic, and perfusion data. The percentage diameter stenosis in the infarct-related artery ranged from 0% to 90%. FFR was significantly lower in the infarct-related artery than in the reference artery. In the infarcted region, FFR ranged from 0.34 to 1.0 (mean, 0.75 ± 0.16) and RFR from 0.24 to 1.06 (mean, 0.74 ± 0.18). Myocardial blood flow in the infarcted region was significantly lower at baseline and during hyperemia. The hyperemic rate–pressure products during catheterization and during the PET study were not statistically different. A good correlation was found between FFR and RFR (Fig. 1A). The mean difference between RFR and FFR was 0.01 ± 0.11 (Fig. 1B). To detect ischemia, we performed nuclear scintigraphy on 18 patients and dobutamine stress echocardiography on 9 patients. In 16 patients, the stress test findings were abnormal in the infarcted area. The optimal cutoff of FFR for discriminating reversible ischemia on noninvasive imaging was 0.79, resulting in a sensitivity of 81% and a specificity of 82% (Fig. 2). An FFR cutoff of 0.75 had a sensitivity of 69% and a specificity of 82%.

(A) Plot of relationship between RFR as assessed by PET and RFR as assessed by FFR. (B) Bland–Altman plot of FFR and RFR. Solid line represents mean difference; dashed lines represent 2 SDs from this mean.

Sensitivity and specificity curves for ability of FFR to detect ischemia by noninvasive stress testing.
Angiographic, Coronary Hemodynamic, and PET Data
DISCUSSION
In patients with chronic myocardial infarction and a reduced ejection fraction, a good correlation was found between FFR measurements in the infarct-related artery and RFR, determined with H215O PET. The linear regression line between FFR and RFR was close to the line of identity. This finding implies that in patients with chronic myocardial infarction, microvascular resistance does not differ between the infarcted and reference areas.
Rationale for Measuring RFR with H215O PET in Chronic Myocardial Infarction
H215O PET provides quantitative information on regional flow in the myocardium (15,16). In patients with chronic infarction, the amount of viable myocardium is decreased and so also is maximal achievable blood flow to the infarcted area, even in the absence of an infarct-related artery stenosis. Because the H215O PET technique expresses flow per milliliter of perfusable (viable) tissue only (and not per milliliter of total tissue in the infarcted area), the decreased amount of viable myocardium within the infarcted area is accounted for and, thus, comparison of blood flow between infarcted and reference myocardial areas is possible.
Correlation Between FFR and RFR in Chronic Myocardial Infarction
In patients without prior myocardial infarction, FFR measurements have been validated through comparison with RFR (17). FFR equals RFR if 3 conditions are fulfilled. The first of these is that significant narrowing of the reference coronary artery be absent; therefore, in the present study, FFR in the reference coronary artery was measured. The second condition is that FFR and RFR measurements be performed under similar hemodynamic conditions; in the present study, the rate–pressure products at maximal hyperemia during FFR measurement and during PET did not differ significantly. The third condition is that microvascular resistance be identical in the stenotic and contralateral areas during maximal hyperemia. This condition does not mean that microvascular resistance had to be normal in the reference and infarcted areas. Coronary flow reserve and maximal myocardial blood flow have been shown to be significantly higher in healthy volunteers than in myocardial regions perfused by normal coronary arteries in patients with remote areas of myocardial ischemia (18). In concordance with the data of Uren et al., maximal myocardial blood flow data measured in volunteers at our institution (4.31 ± 0.90 mL/min/mL) were also significantly higher than the reference area flow data in the present study (19). The implication is that microvascular resistance in the reference area in the present study was higher than truly normal resistance. However, maximal myocardial blood flow data and absolute flow reserve in the reference area (3.3 ± 1.2) were comparable between the present study and other H215O PET studies on patients with coronary artery disease (18,20–22). This comparability suggests that the degree of microvascular functional impairment in the present study was similar to that found by other studies.
In the acute and subacute phases of a myocardial infarction, microvascular resistance in the infarcted area can be increased (23–25). There are no data on microcirculatory resistance in chronically infarcted areas in patients. If microcirculatory function in a chronically infarcted area is similar to that in a reference area, FFR in an infarct-related artery should be identical to RFR. If microvascular resistance in a chronically infarcted area remains greater than that in a reference area, FFR will be higher than RFR. In this situation, FFR will overestimate RFR proportionally by the degree to which microvascular resistance is higher in the infarcted than the reference area. In the present study, RFR was measured with H215O PET. In infarcted areas, H215O-PET provides perfusion data only on tissue that is capable of exchanging water rapidly—a property of viable myocardium (7–9). Myocardial blood flow in nonperfusable (scar) tissue is negligible. The fact that in the present study the regression line of the relationship between FFR and RFR approached the line of identity (Fig. 1A), and that the mean difference in the Bland–Altman plot was not significantly different from zero (Fig. 1B), indicates that microvascular resistance did not significantly differ between the infarcted and reference areas.
The FFR Cutoff After Myocardial Infarction
In the present study, the optimal cutoff of FFR to detect ischemia in the infarcted area was 0.79, resulting in a sensitivity of 81% and a specificity of 82%. An FFR cutoff of 0.75 had a sensitivity of 69% and a specificity of 82%. These findings are in line with those of previous studies, performed during the subacute phase of an infarction. De Bruyne et al. found in 57 patients with a recent myocardial infarction (average time, 20 d) that the best cutoff of FFR was 0.78 (26). In another study, FFR measurements were compared with SPECT 4 d after myocardial infarction. The optimal FFR for discriminating inducible ischemia also was 0.78 (27). Usui et al. compared the reliability of FFR in infarct-related and non–infarct-related artery stenoses. They found a similar sensitivity and specificity in patients with and without prior infarction at an FFR cutoff of 0.75 (28). In all 3 studies, the ejection fraction was rather well preserved (58%, 53%, and 56%, respectively). The present study extends the validity of the 0.75 FFR cutoff to patients with chronic infarction and considerably diminished left ventricular function.
Limitations
PET and pressure measurements were not performed simultaneously. However, no difference in rate–pressure products between the 2 procedures was observed at hyperemia. Furthermore, hyperemia during PET and pressure measurements was induced by intravenous and intracoronary adenosine administration, respectively. Studies have shown, however, that both intracoronary and intravenous administration of adenosine can achieve maximal hyperemia (29). In the postinfarction setting, the accuracy of noninvasive stress testing is decreased, possibly influencing the FFR cutoff and its sensitivity and specificity. The FFR cutoff in the chronic phase of myocardial infarction should be confirmed in a larger study population.
CONCLUSION
The present study showed that in patients with chronic myocardial infarction, FFR correlated well with RFR, as assessed by H215O PET. The implication is that in patients with chronic myocardial infarction, microvascular resistance in viable myocardium did not differ from that in the reference area. Because microvascular resistance was similar to that found by previous studies on patients, the established 0.75 FFR threshold also is applicable to patients with chronic infarction. In many patients with coronary artery disease, including the present study population, microvascular function is worse than in healthy persons.
Acknowledgments
This study was supported by grant 98.102 from the Netherlands Heart Foundation.
Footnotes
-
COPYRIGHT © 2007 by the Society of Nuclear Medicine, Inc.
References
- Received for publication June 20, 2007.
- Accepted for publication August 27, 2007.


Jump to section
Related Articles
Cited By...
- Understanding Coronary Physiology Through Dynamic CT Perfusion Imaging
- Diagnostic Performance of Resting and Hyperemic Invasive Physiological Indices to Define Myocardial Ischemia: Validation With 13N-Ammonia Positron Emission Tomography
- Fractional Flow Reserve Returns to Its Origins: Quantitative Cardiac Positron Emission Tomography
- Relative Flow Reserve Derived From Quantitative Perfusion Imaging May Not Outperform Stress Myocardial Blood Flow for Identification of Hemodynamically Significant Coronary Artery Disease
- Anatomic Versus Physiologic Assessment of Coronary Artery Disease: Role of Coronary Flow Reserve, Fractional Flow Reserve, and Positron Emission Tomography Imaging in Revascularization Decision-Making
- Functional Measurement of Coronary Stenosis