


Abstract
Myocardial perfusion imaging with 99mTc-tetrofosmin is based on the assumption of a linear correlation between myocardial blood flow (MBF) and tracer uptake. However, it is known that 99mTc-tetrofosmin uptake is directly related to energy-dependent transport processes, such as Na+/H+ ion channel activity, as well as cellular and mitochondrial membrane potentials. Therefore, cellular alterations that affect these energy-dependent transport processes ought to influence 99mTc-tetrofosmin uptake independently of blood flow. Because metabolism (18F-FDG)-perfusion (99mTc-tetrofosmin) mismatch myocardium (MPMM) reflects impaired but viable myocardium showing cellular alterations, MPMM was chosen to quantify the blood flow-independent effect of cellular alterations on 99mTc-tetrofosmin uptake. Therefore, we compared microsphere-equivalent MBF (MBF_micr; 15O-water PET) and 99mTc-tetrofosmin uptake in MPMM and in “normal” myocardium. Methods: Forty-two patients with severe coronary artery disease, referred for myocardial viability diagnostics, were examined using 18F-FDG PET and 99mTc-tetrofosmin perfusion SPECT. Relative 18F-FDG and 99mTc-tetrofosmin uptake values were calculated using 18 segments per patient. Normal myocardium and MPMM myocardium were classified using a previously validated 99mTc-tetrofosmin SPECT/18F-FDG PET score. In addition, 15O-water PET was performed to assess kinetic-modeled MBF (MBF_kin), the water-perfusable tissue fraction (PTF), and the resulting MBF_micr (MBF_kin·PTF), which is comparable to tracer uptake values. 99mTc-tetrofosmin uptake and MBF_micr values were calculated for all normal and MPMM segments and averaged within their respective classifications. Results: Mean relative 99mTc-tetrofosmin uptake was 86% ± 1% in normal myocardium and 56% ± 1% in MPMM, showing a significant difference (P < 0.001), as was expected from the classification. Contrary to these findings, mean MBF_micr in MPMM myocardium was 0.60 ± 0.03 mL·min−1·mL−1, which did not significantly differ from normal myocardium (0.64 ± 0.01 mL·min−1·mL−1). All values are given as mean ± SEM. Conclusion: Differences between reduced 99mTc-tetrofosmin uptake and the unchanged MBF_micr in MPMM myocardium suggest that the pathophysiologic basis of MPMM is not a blood flow reduction but cellular alterations that affect uptake and retention of 99mTc-tetrofosmin independently of blood flow. Therefore, it seems that perfusion deficits in MPMM myocardium are greatly overestimated by 99mTc-tetrofosmin and that it tends to give false-positive findings.
Myocardial perfusion imaging with 99mTc-methoxyisobutylisonitrile and 99mTc-1,2-[bis(bis-2-ethoxyethyl)-phosphino]ethane (99mTc-tetrofosmin) is a well-established and widely used technique in the diagnosis of coronary artery disease (CAD). This technique is based on the assumption of a linear correlation between myocardial blood flow (MBF) and tracer uptake. Several animal trials have compared 99mTc-methoxyisobutylisonitrile and 99mTc-tetrofosmin uptake and MBF using radiolabeled microspheres. Most of these studies showed a good correlation between MBF and tracer uptake (1–3) within physiologic ranges. However, some animal trials indicated that in reperfused myocardium, after an episode of acute ischemia, at least 99mTc-tetrofosmin uptake decreases more than does reperfusion flow, as determined with microspheres (4,5). 99mTc-tetrofosmin is a monovalent lipophilic cation whose cellular uptake is related to the Na+/H+ ion channel (6,7), as well as cellular and mitochondrial membrane potential (6–10). These energy-dependent processes might be affected by a reduced viability. Therefore, the correlation between MBF and 99mTc-tetrofosmin uptake may be limited if different viability states are compared.
MBF estimation using dynamic PET with 15O-water overcomes these limitations because 15O-water is a freely diffusible flow tracer and distributes in tissue according to the Kety-Schmidt principle (11,12). Appropriate kinetic models describing the dynamic processes of 15O-water in the myocardium have been developed, and their accuracy and reproducibility have been validated (13–17).
Metabolism (18F-FDG)-perfusion (99mTc-tetrofosmin) mismatch (MPMM) myocardium indicates impaired but viable myocardium (18–21) with cellular and mitochondrial alterations (22,23). We therefore chose MPMM myocardium to quantify the blood flow-independent effect of cellular alterations on 99mTc-tetrofosmin uptake. We quantified and compared true MBF (15O-water PET) and 99mTc-tetrofosmin uptake in MPMM and normal myocardium.
Because the invasive microsphere technique, as a gold standard, is limited to animal trials, dynamic 15O-water PET was used for absolute quantification of MBF. Kinetic-modeled MBF (MBF_kin) by 15O-water PET results in units of flow rates per mass (mL·min−1·g−1) of water-perfusable tissue (13). Unlike the invasive microsphere technique and 99mTc-tetrofosmin uptake values, this method does not account for the volume of the region of interest (ROI) involved. To get comparable results, a microsphere-equivalent MBF (MBF_micr), which is the flow rate per ROI volume (mL·min−1·mL−1), could be derived from the MBF calculation (13,15,16).
This study focused on the comparison of MBF_micr and relative 99mTc-tetrofosmin uptake values in both normal and MPMM myocardium and the resulting quantification of the influence of cellular alterations on 99mTc-tetrofosmin uptake independent of blood flow.
MATERIALS AND METHODS
Patients
Forty-two consecutively admitted patients (35 men, 7 women; mean age ± SD, 63 ± 11 y; age range, 40–78 y; mean body mass index, 26.0 ± 3.3 kg·m−2) with severe CAD and scheduled for an 18F-FDG PET scan to assess myocardial viability were investigated. Thirty-three patients had a history of at least 1 previous myocardial infarction. Ten patients had 1-vessel, 12 patients had 2-vessel, and 20 patients had 3-vessel disease. The mean left ventricular ejection fraction of all 42 patients was reduced to 38% ± 13%. Diabetes mellitus was previously diagnosed in 9 patients. The mean fasting glucose level of all patients was 6.9 ± 2.1 mmol/L (range, 4.6–17.7 mmol/L).
Patient Preparation
All studies were performed on the same day with the patient supine. At presentation, all patients had fasted and had been taking their regular cardiac medication. Between injection of 99mTc-tetrofosmin and SPECT acquisition, a meal was served to reduce biliary activity. To reduce myocardial fatty acid metabolism, 250 mg of acipimox were given to all patients approximately 2 h before administration of 18F-FDG (24). About 1 h before injection of 18F-FDG, nondiabetics received an oral glucose load of 50 g. Insulin (2–8 IU) was administered intravenously to diabetics 5–10 min before administration of 18F-FDG.
18F-FDG PET
Static 18F-FDG PET scanning (ECAT EXACT 922/47; CTI, Knoxville, TN/Siemens Medical Systems, Inc., Hoffman Estates, IL) was performed 60 min after intravenous administration of 223 ± 57 MBq of 18F-FDG. The acquisition time was 30 min for emission (2-dimensional mode) and 15 min for transmission (68Ge/68Ga rod sources). Attenuation-corrected images were reconstructed using filtered backprojection (Hann; cutoff, 0.4 Nyquist). The matrix size was 128 × 128 pixels, and reconstruction zoom was 2.154. The resulting pixel size was 2.39 × 2.39 × 3.38 mm3.
15O-Water PET
A cyclotron (RDS 111; CTI/Siemens) was used to irradiate 15N with 11 MeV protons for production of 15O, which reacted to 15O-water in a water module (CTI/Siemens). Two dynamic resting 15O-water PET studies were performed on every patient and started with the beginning of intravenous injection of 700–1,000 MBq of 15O-water over 10 s followed by flushing of the line with 20 mL of saline solution over 20 s. Each dynamic study (2-dimensional mode) consisted of 26 frames (10 × 6 s and 16 × 15 s), for a total scan time of 5 min. For a transmission scan (68Ge/68Ga), 15 min elapsed between both dynamic studies to allow for decay of the 15O radioactivity. Attenuation-corrected images were reconstructed using filtered backprojection (Hann; cutoff, 0.4 Nyquist). The matrix size was 128 × 128 pixels, and reconstruction zoom was 2.154. The resulting pixel size was 2.39 × 2.39 × 3.38 mm3.
SPECT
Myocardial perfusion SPECT was done about 60 min after injection of 425 ± 49 MBq of 99mTc-tetrofosmin using a dual-head gamma camera (Solus; ADAC Laboratories, Milpitas, CA) equipped with a low-energy all-purpose collimator. A validated method (25) using a triple-energy-window acquisition was used to correct the datasets for attenuation and scatter. This method was based on calculation of attenuation distribution. Acquisition was done with a 360° rotation (180° per head) in 64 steps (128 projections) of 20 s each in 3 independent energy windows: 140 ± 14 keV for emission, 120 ± 6 keV for scatter detection, and 90 ± 11 keV for backscatter detection. Datasets of window 1 and window 2 were processed to obtain a scatter-corrected dataset, which was then reconstructed using a Butterworth filter (cutoff, 0.7 Nyquist; order, 5; matrix, 128 × 128) (set A). The dataset of window 3 was analyzed to derive the raw data for attenuation distribution. This dataset was reconstructed (filtered backprojection, ramp) and then optimized with a segmentation method to eliminate object-dependent variations (set B). The scatter-corrected dataset (A) was then corrected for attenuation by processing it with the segmented attenuation maps (B). Finally, a segmented attenuation and scatter-corrected dataset was obtained (128 × 128 matrix). Pixel size was then adapted to the pixel size of the PET data (2.39 × 2.39 × 3.38 mm3).
Data Analysis
Reorientation and Overlay.
18F-FDG PET and 15O-water PET studies were acquired primarily using ECAT 7.1 software (CTI/Siemens). Transaxial SPECT slices were imported into the ECAT 7.1 software. Next, all PET and SPECT images were reoriented in left ventricular short-axis slices of 1.2-cm thickness. For reorientation of the dynamic 15O-water PET studies, the reorientation axes of the respective 18F-FDG PET studies were transferred to the 15O-water PET studies and controlled for accuracy on early 15O-water study frames delineating the 15O-water-filled left ventricle chamber.
Each of 3 18F-FDG PET short-axis slices (apical, midventricular, basal) was divided into 6 ROIs (segments) measuring 7 mm in radial diameter (anteroseptal, septal, posteroseptal, posterolateral, lateral, and anterolateral), yielding a total of 18 segments per dataset (Fig. 1). These segments were projected to both the 15O-water PET images and the 99mTc-tetrofosmin SPECT images.
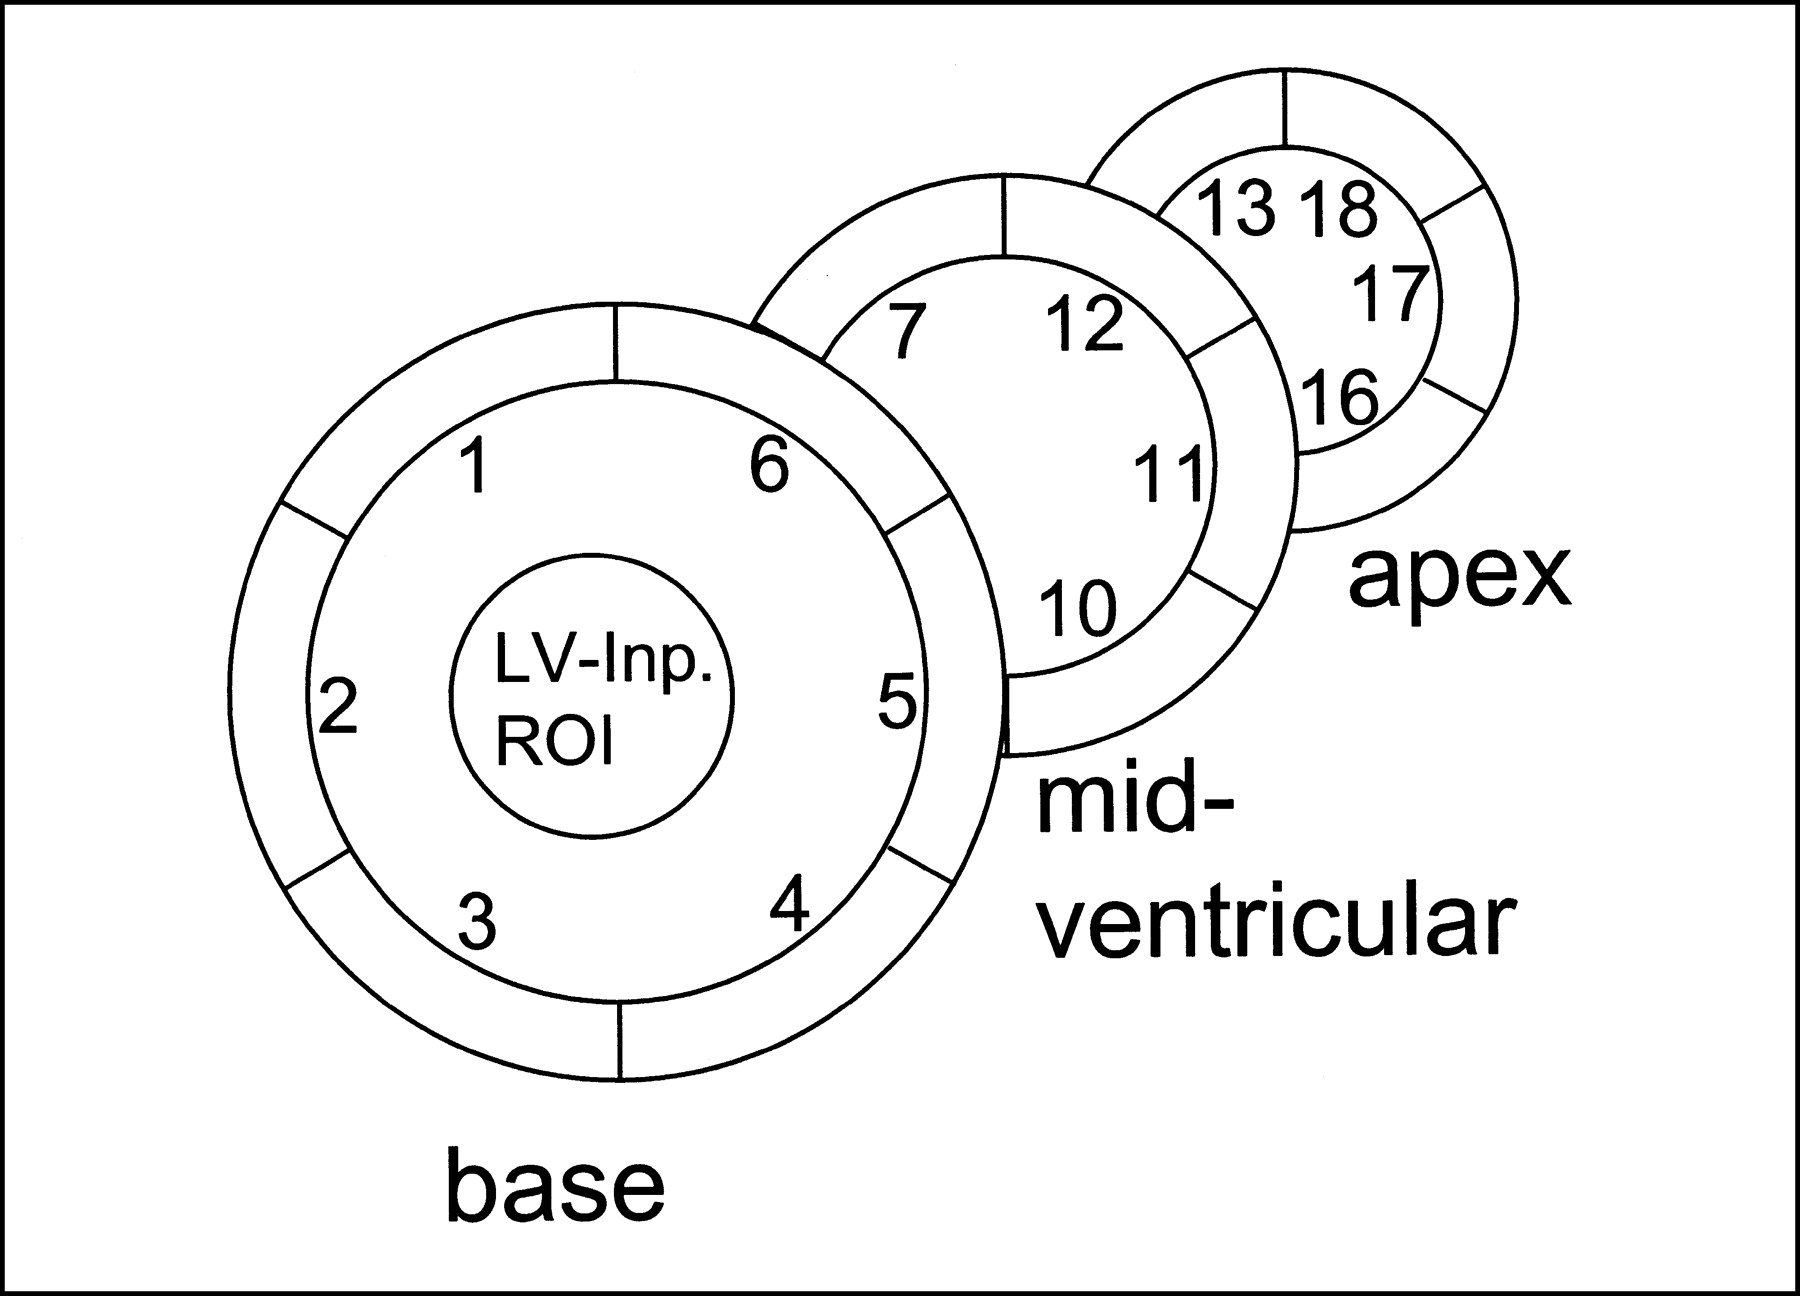
Definition of 18 myocardial tissue ROIs on 3 representative short-axis slices (apex, midventricular, and base). Left ventricular input (LV-Inp.) ROI is located in basal slice.
Quantification.
Myocardial 99mTc-tetrofosmin and 18F-FDG PET uptake was assessed by calculating the count densities (counts per pixel) in every segment. The reference region for both 99mTc-tetrofosmin and 18F-FDG uptake was the region with the maximum 99mTc-tetrofosmin uptake. Segmental 99mTc-tetrofosmin and 18F-FDG uptake values were then expressed as percentages of the respective reference region.
Myocardium was classified as normal if 99mTc-tetrofosmin was >70% and as MPMM if 99mTc-tetrofosmin was ≤70%, if 18F-FDG minus 99mTc-tetrofosmin was ≥20%, and if 18F-FDG PET was >70%. This classification was derived from previously reported studies on the same type of patient and using identical methods that showed that MPMM myocardium often reflects altered, dysfunctional myocardium capable of functional recovery after revascularization (18,19). Relative 99mTc-tetrofosmin uptake was averaged by segment for the 6 segments and for all ROIs for both normal and MPMM myocardium.
MBF_kin and MBF_micr.
MBF and water-perfusable tissue fraction (PTF) were calculated for each myocardial segment with a previously validated fitting routine based on a single-tissue-compartment model (11,12). The arterial input function was obtained from an ROI placed in the left ventricular chamber close to the base (26). MBF_kin was calculated as flow rate per mass of myocardium that is capable of rapidly exchanging radiolabeled 15O-water (mL·min−1·g−1). MBF_kin is free of the so-called partial-volume effect (PVE) due to the PTF, which is defined as the ratio of the mass of perfusable tissue within a given ROI to the volume of that ROI (g/mL) (13,15,16). The product of MBF_kin and PTF reflects the non-PVE-corrected blood flow in this ROI volume (13,15,16) in mL·min−1·mL−1 and was therefore termed the MBF_micr (15).
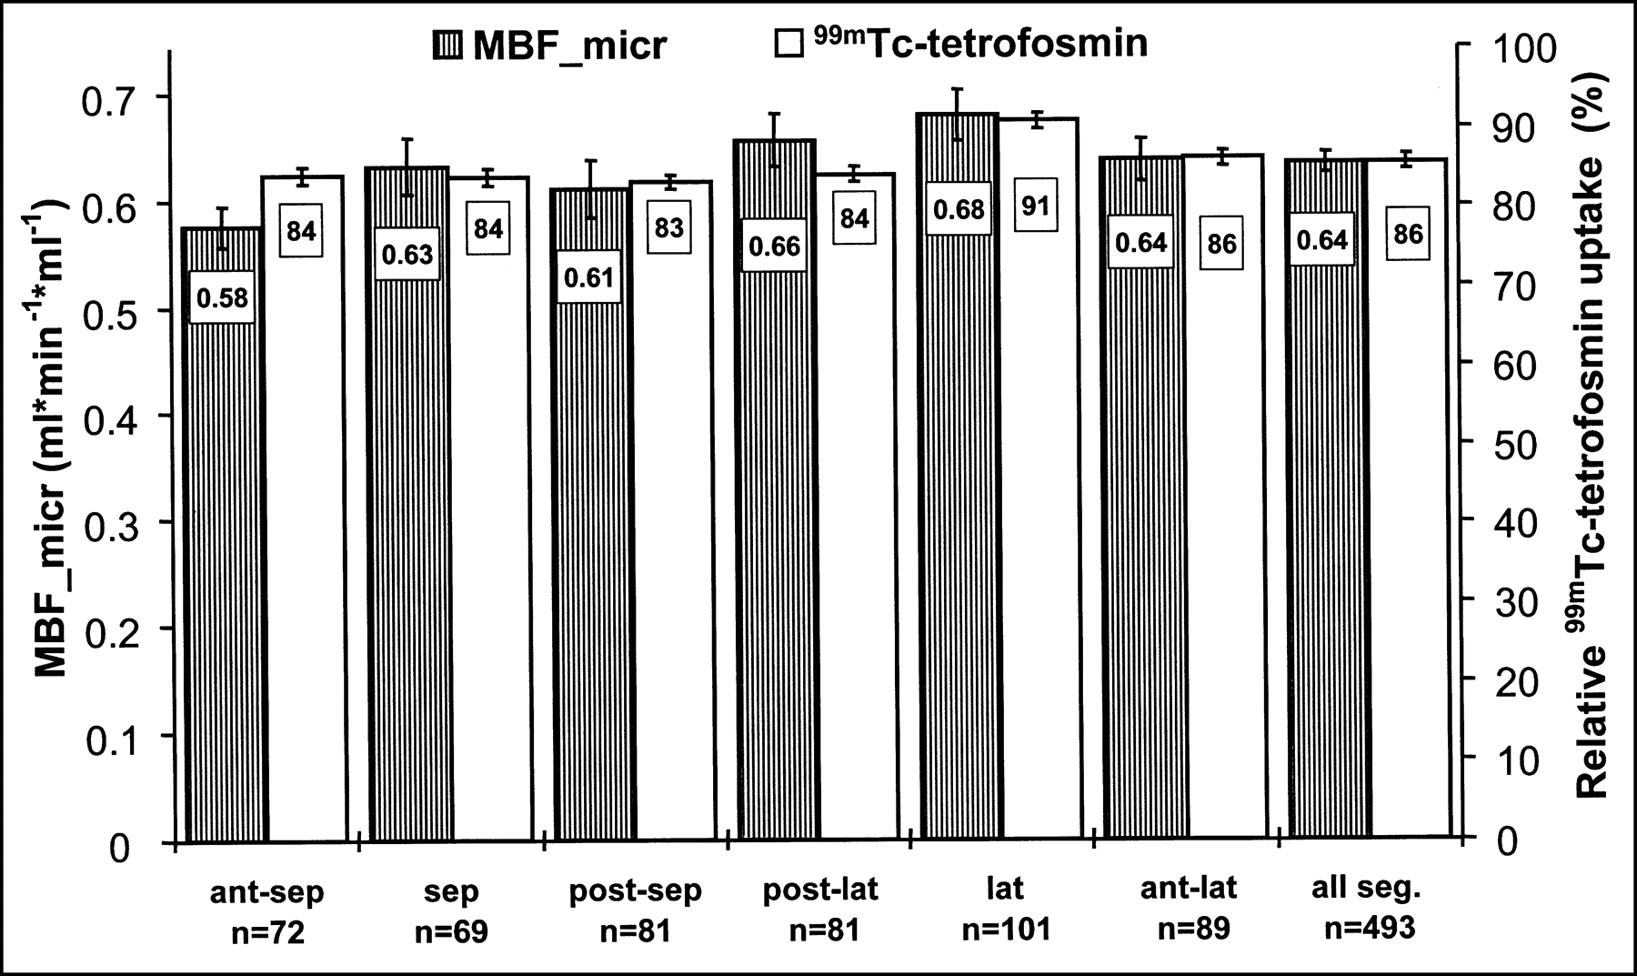
To prove that the inversion of the PVE correction of MBF_kin works well, MBF_kin, PTF, MBF_micr, 99mTc-tetrofosmin, and 18F-FDG uptake values were quantified in ROIs of different sizes (Fig. 2A), all containing approximately the same myocardial mass, as described by Iida et al. (13). The dependence of the quantities on the ROI volumes is shown in Figure 2B.

(A) ROIs with increased volumes but all containing approximately same myocardial mass. (B) ROI volume dependencies of MBF_kin, 99mTc-tetrofosmin uptake, MBF_micr, tissue fraction, and 18F-FDG uptake. All values are expressed as ratios of respective value with A (smallest ROI).
MBF_micr (mL·min−1·mL−1) values were calculated for each segment, and the results of both runs were averaged. The mean MBF_micr of all 6 segments (anteroseptal, septal, posteroseptal, posterolateral, lateral, and anterolateral) and of all ROIs was calculated for both normal and MPMM myocardium.
Segmental MPMM-to-Normal Percentages.
For each of the 6 segments, both the MBF_micr and the relative 99mTc-tetrofosmin uptake values in MPMM myocardium were divided by the segmental averaged corresponding values in normal myocardium, yielding the segmental MPMM-to-normal percentages.
Statistical Analysis
All statistical analyses used SPSS 10 (SPSS Inc., Chicago, IL). Data are shown as mean ± SEM. Differences were tested for significance using a nonparametric rank sum test (Mann-Whitney U test).
RESULTS
Comparison of MBF_kin, MBF_micr, 99mTc-Tetrofosmin, and 18F-FDG Uptake in ROIs with Increasing Sizes
MBF_kin values, assumed to be free of PVE, showed no significant changes with increasing ROI size. In contrast, all other parameters showed a concomitant, largely parallel decrease with increasing ROI size (Fig. 2B).
MBF_micr and 99mTc-Tetrofosmin Uptake in “Normal” Myocardium
The mean MBF_micr of patients with severe CAD in myocardial segments classified as normal (n = 493) was 0.64 ± 0.01 mL·min−1·mL−1, and the respective mean relative 99mTc-tetrofosmin uptake was 86% ± 1%.
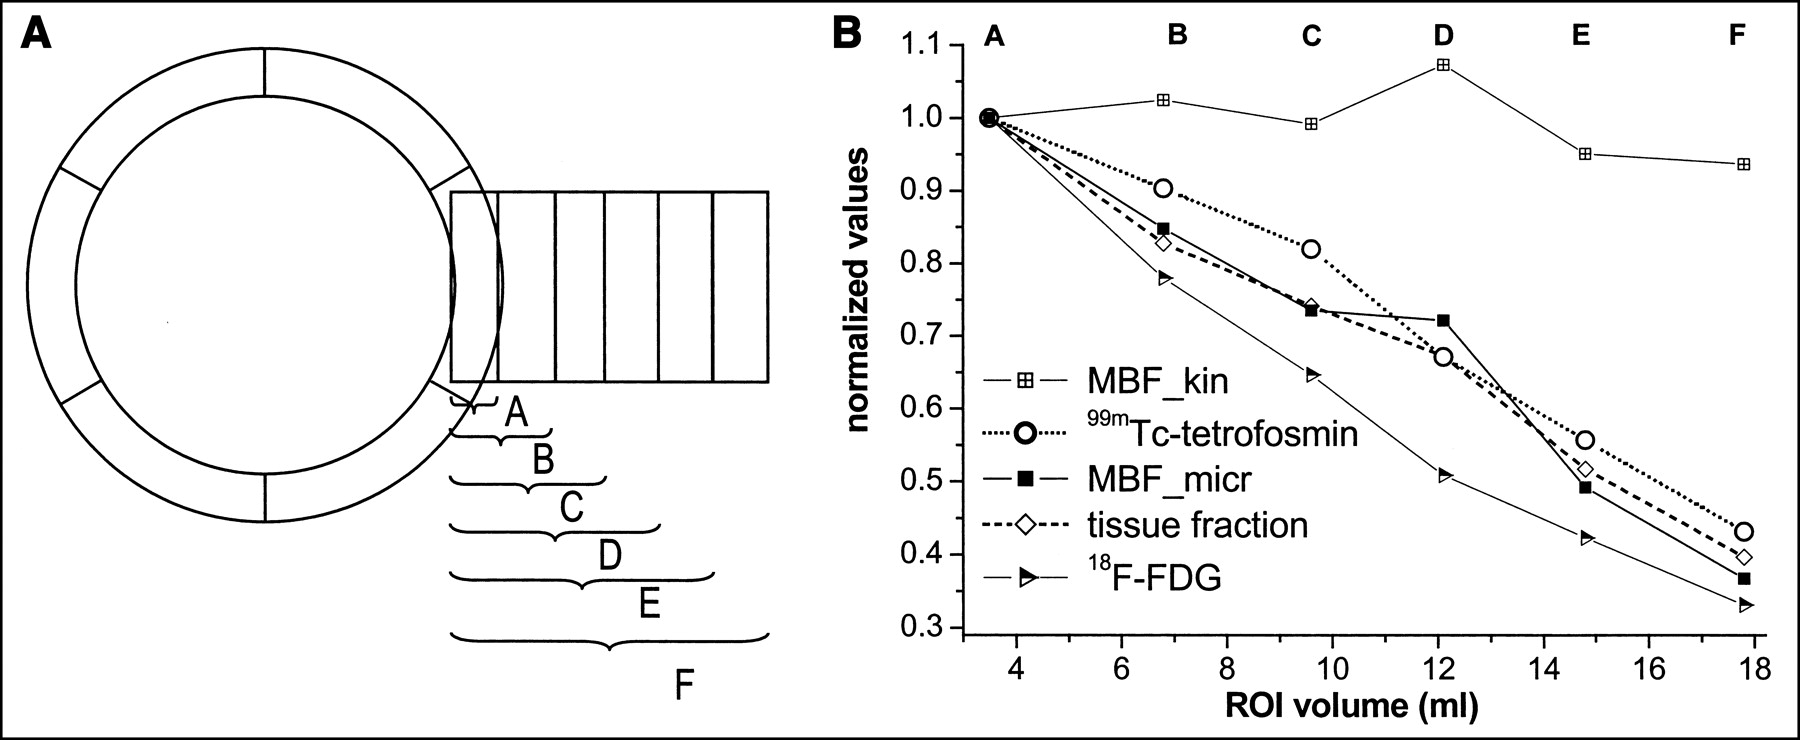
The segmental distribution of the MBF_micr values (Fig. 3) shows only a small variability within a range from 0.58 ± 0.02 mL·min−1·mL−1 (anteroseptal regions) to 0.68 ± 0.02 mL·min−1·mL−1 (lateral regions). Similarly, the 99mTc-tetrofosmin uptake shows a small variation over the segments from 83% ± 1% (posteroseptal regions) to 91% ± 1% (lateral regions). Figure 3 shows that both MBF_micr and 99mTc-tetrofosmin uptake tend toward higher values in the lateral than in the septal regions.
Mean MBF_micr (mL·min−1· mL−1) and relative 99mTc-tetrofosmin uptake of investigated 6 segments and of all segments classified as normal (abscissa). 99mTc-tetrofosmin uptake values are normalized to respective patient’s maximum uptake region, set as 100%. Ant = anterior; lat = lateral; post = posterior; seg. = segments; sep = septal.
MBF_micr and 99mTc-Tetrofosmin Uptake in MPMM
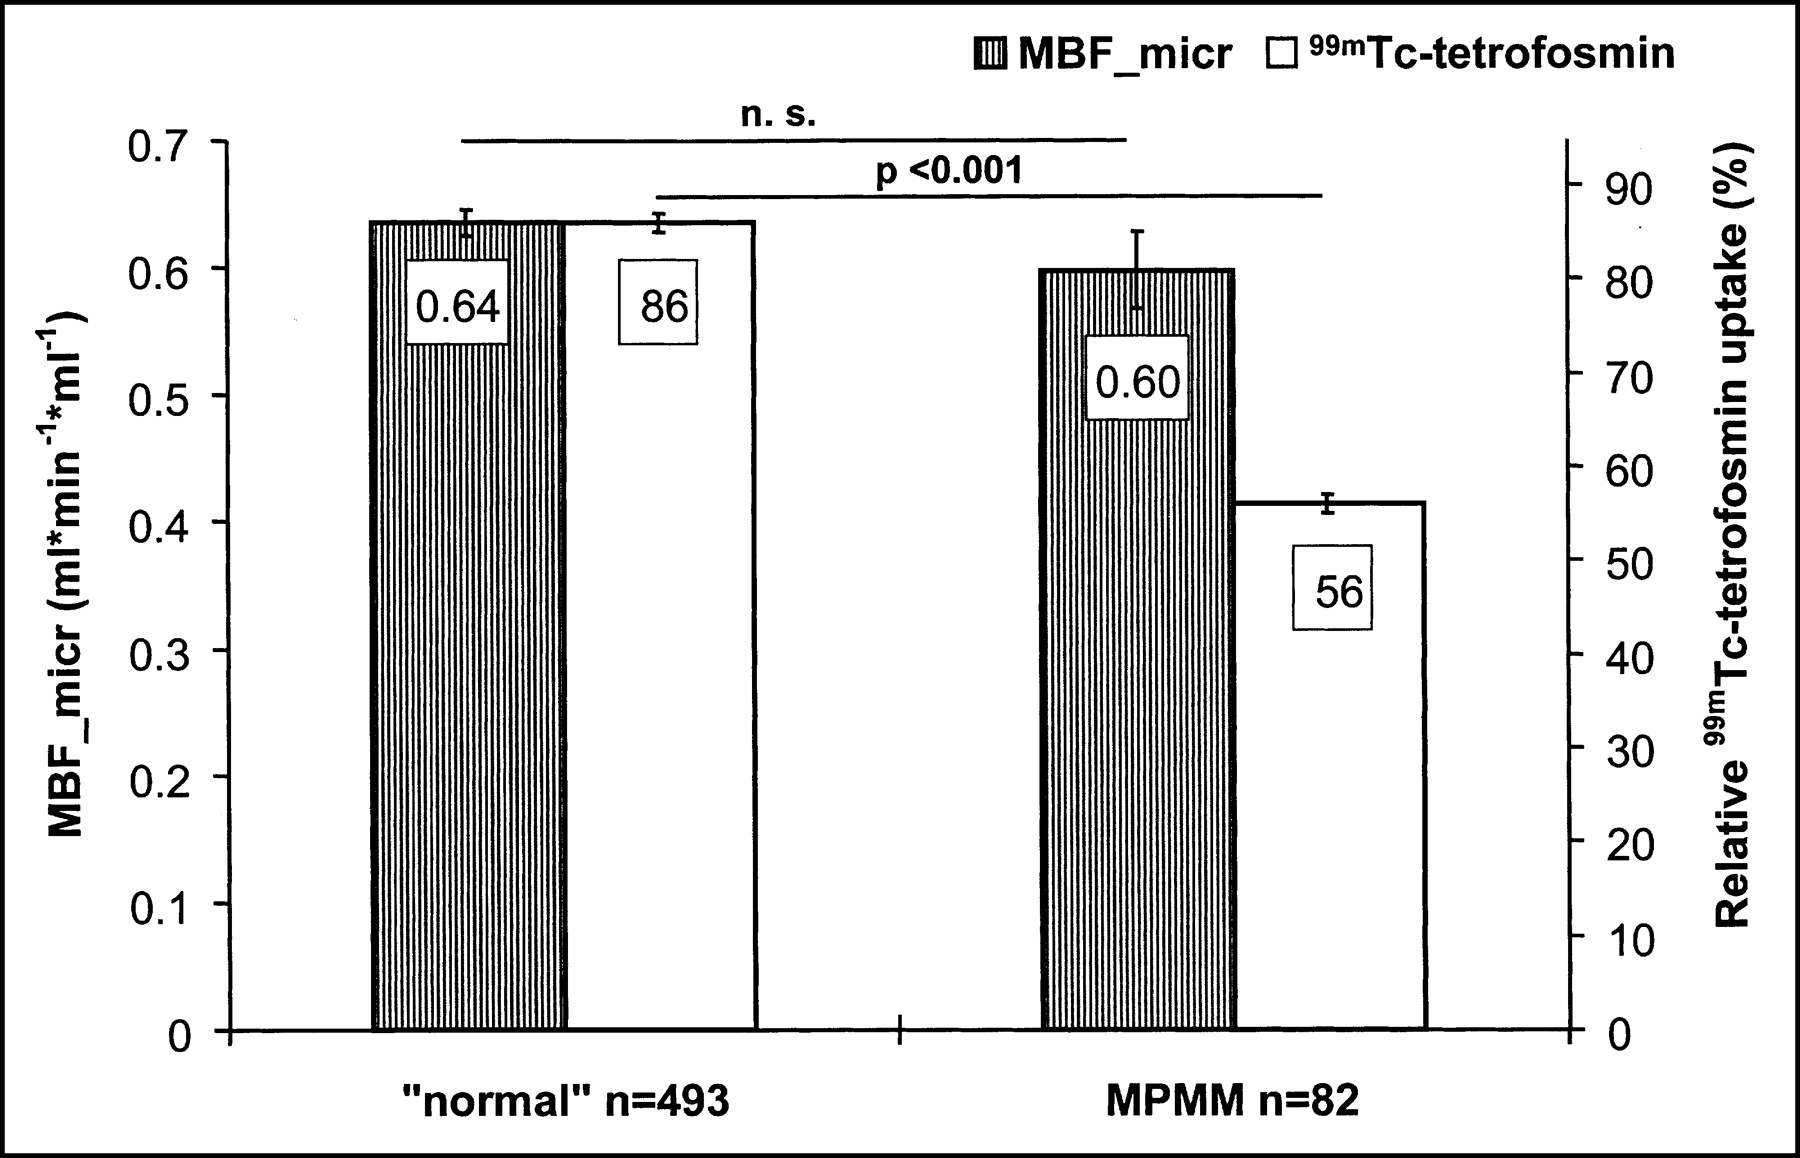
MBF_micr, at 0.60 ± 0.03 mL·min−1·mL−1 (−6%), was not significantly reduced in those segments classified as MPMM (n = 82), whereas mean relative 99mTc-tetrofosmin uptake was significantly reduced to 56% ± 1% in MPMM versus normal myocardium (−35% [relative]; P < 0.001) (Fig. 4).

Mean MBF_micr (mL·min−1·mL−1) and relative 99mTc-tetrofosmin uptake in normal myocardium and MPMM myocardium. 99mTc-tetrofosmin uptake values are normalized to respective patient’s maximum uptake region, set as 100%. n. s. = not statistically significant.
Segmentwise Comparison of MPMM-to-Normal Percentages for MBF_micr and 99mTc-Tetrofosmin Uptake
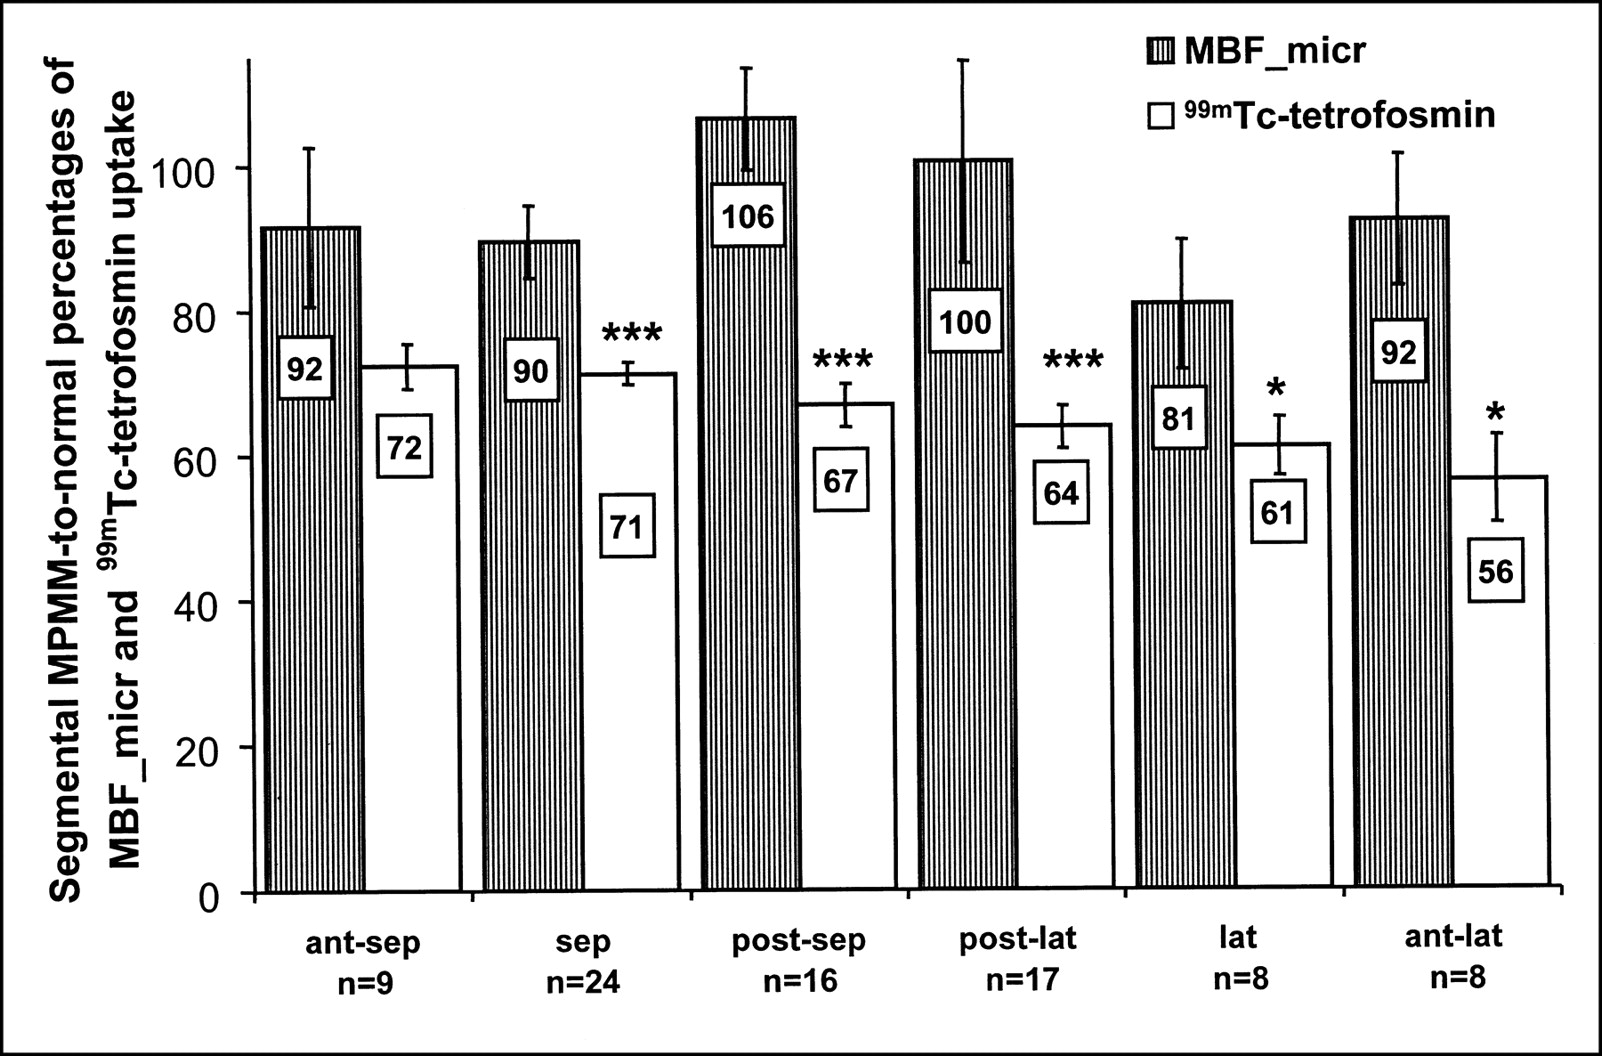
The segmental MPMM-to-normal percentage describes the relationship between MBF_micr and 99mTc-tetrofosmin uptake in MPMM compared with normal myocardium within the same segment. These calculations yielded values from 81% ± 9% (lateral regions) to 106% ± 7% (posteroseptal regions) for MBF_micr and from 56% ± 6% (anterolateral regions) to 72% ± 3% (anteroseptal regions) for 99mTc-tetrofosmin uptake (Fig. 5). In all but the anteroseptal region, 99mTc-tetrofosmin uptake was significantly more reduced than was MBF_micr. For the septal (n = 24), posteroseptal (n = 16), and posterolateral regions (n = 17), the relative differences were −22%, −37%, and −36%, respectively, and reached significance at P < 0.005. For the lateral (n = 8) and anterolateral (n = 8) regions, the relative differences were −25% and −39%, respectively, and reached significance at P < 0.05.

Segmental MPMM-to-normal percentages of mean MBF_micr and relative 99mTc-tetrofosmin uptake. Mean normal values are set as 100% for each segment for either parameter. n = number of MPMM segments. *P < 0.05. ***P < 0.005. Ant = anterior; lat = lateral; post = posterior; sep = septal.
DISCUSSION
Many studies have shown that myocardial 99mTc-tetrofosmin uptake correlates closely with blood flow (2,3), but several authors have pointed out that in animal models, 99mTc-tetrofosmin uptake is more reduced than reperfusion blood flow after acute ischemia (4,5). These findings suggest that myocardial alterations affect 99mTc-tetrofosmin uptake independently of blood flow. To overcome the limitations of a perfusion tracer whose uptake is related to energy-dependent processes (Na+/H+ ion channel activity, cellular and mitochondrial membrane potentials (6–10)), we used 15O-water PET as a reference method in assessing MBF. In this approach, relative 99mTc-tetrofosmin uptake and MBF_micr were compared in normal and MPMM myocardium, and the flow-independent influence of cellular alterations on 99mTc-tetrofosmin uptake in MPMM myocardium was quantified.
The mean MBF_micr (n = 493) in normal myocardium was 0.64 ± 0.01 mL·min−1·mL−1, which agrees with the findings of Iida et al. (15), who reported an average MBF_micr of 0.63 mL·min−1·mL−1 in 9 healthy volunteers. Estimation of MBF_micr therefore seems to work well. In addition, the unaffected MBF_micr in normal regions agrees well with the findings of Gerber et al. (27), who reported that in remote regions of dysfunctional myocardium, MBF_kin was similar to that in “normal” volunteers.
As expected from our classification, 99mTc-tetrofosmin uptake in MPMM myocardium was significantly reduced, from 86% ± 1% (normal) to 56% ± 1%. Contrary to these findings, the MBF_micr showed only a nonsignificant reduction, from 0.64 ± 0.01 mL·min−1·mL−1 to 0.60 ± 0.03 mL·min−1·mL−1. Despite the assumption of a strictly flow-proportional perfusion marker, the discrepancy between reduced 99mTc-tetrofosmin uptake and preserved MBF_micr in MPMM versus normal myocardium indicates that in MPMM myocardium, processes governing 99mTc-tetrofosmin uptake or retention seem to be impaired. Contrary to these findings, 15O-water diffusion along the sarcolemmal membranes was unaffected by these alterations, since otherwise the MBF_micr would also have to be reduced.
Arbab et al. (6) reported that amiloride, an inhibitor of the Na+/H+-antiporter, reduced 99mTc-tetrofosmin uptake in cultures of rat myocardium cells by about 35%. Arbab et al. also reported that 99mTc-tetrofosmin-incubated cells released 38% of the accumulated tracer if they were treated with carbonyl cyanide m-chlorophenylhydrazone, an uncoupler of oxidative phosphorylation that depolarizes the mitochondrial membrane potential (6). Younès et al. (9) found that 2,4-dinitrophenol, another mitochondrial uncoupler, caused a 92% release of accumulated 99mTc-tetrofosmin in incubated isolated adult rat heart mitochondria. Spadafora et al. (10) reported that the cytoprotective effects of trimetazidine, which are related to the mitochondrial function and not to coronary hemodynamic changes, increased myocardial 99mTc-tetrofosmin uptake after 1 wk of administration in CAD patients. All these results indicate that 99mTc-tetrofosmin uptake and retention are related to active ion transport systems and membrane potentials as well as to mitochondrial integrity.
Comparing the unchanged MBF_micr with reduced 99mTc-tetrofosmin uptake and retention suggests that the discrepancy between these 2 findings may be caused by alterations of active ion transport systems (e.g., Na+/H+-antiporter), decreased membrane potentials, or ultrastructural alterations of mitochondria in MPMM versus normal myocardium. These assumptions agree well with data from Schwarz et al., who showed that ultrastructural alterations of mitochondria, particularly reduction in size and reduction in number of cristae, are present in reversibly dysfunctional MPMM myocardium (22,23). These data also agree well with data from Ausma et al., who showed that ultrastructural alterations of mitochondria are present in reversibly dysfunctional myocardium (28).
Reduced 99mTc-tetrofosmin uptake and impaired retention cannot be differentiated on the basis of these data, since acquisition was performed 60 min after injection and the resulting 99mTc-tetrofosmin values are determined by uptake and retention. Studies comparing early and late 99mTc-tetrofosmin SPECT are needed to differentiate between impaired uptake and retention mechanisms in these patients.
Comparing the 6% MBF_micr flow reduction and the 35% reduction in 99mTc-tetrofosmin uptake yields an approximate landmark value of about 29% for flow-independent 99mTc-tetrofosmin uptake reduction between MPMM and normal myocardium. This 29% difference gives an idea of the effect of cellular alterations in MPMM myocardium on 99mTc-tetrofosmin uptake independent of blood flow.
Regarding limitations of the study, the following points should be mentioned. First, the comparison of 99mTc-tetrofosmin SPECT and 15O-water PET is a comparison of 2 different modeling techniques. The 15O-water model provides PVE-corrected MBF only in water-perfusable, not nonperfusable, tissue (13,15,16), whereas 99mTc-tetrofosmin uptake values represent tracer accumulation within the ROI volume. However, the PTF was introduced to correct for the PVE. This PTF reflects the aspect of an ROI volume-based quantity in the 15O-water model. Therefore, multiplying MBF_kin and tissue fraction reverses the PVE correction, and the resulting MBF_micr (13,15) and 99mTc-tetrofosmin uptake reflect both non-PVE-corrected ROI volume-based values and are therefore comparable. Evidence that these assumptions are correct lies in the dependency of the curves for MBF_kin, PTF, MBF_micr, 99mTc-tetrofosmin, and 18F-FDG uptake on the ROI volume (Fig. 2B). The nearly parallel curves of 99mTc-tetrofosmin uptake and MBF_micr validate the mathematics underlying the PVE correction inversion, as described by Iida et al. (13), and hence prove that 99mTc-tetrofosmin uptake and MBF_micr are comparable.
Second, the comparison of 99mTc-tetrofosmin SPECT and 15O-water PET is a comparison of different quantification (absolute vs. relative) methods. The difference between absolute and relative quantification could be eliminated by calculating the MPMM-to-normal percentages for both MBF_micr and 99mTc-tetrofosmin uptake. Therefore, comparability is given because both values are expressed as percentages.
Third, for the PET studies, attenuation was corrected by transmission measurements using 68Ge/68Ga rod sources, whereas the SPECT studies were reconstructed using a validated attenuation and scatter correction (25) based on a triple-energy-window acquisition without a transmission scan. That the observed effects are not related to the different attenuation correction methods can be derived from the result that the segmental MPMM-to-normal 99mTc-tetrofosmin uptake percentages are significantly more reduced than the MBF_micr percentage for all but the anteroseptal regions. Therefore, the attenuation correction applied in the SPECT studies seems to work as well as the attenuation correction by transmission scan in the PET studies for all segments.
Fourth, because the different intrinsic resolutions of the camera systems make a quantitative comparison more difficult, a flow-independent 99mTc-tetrofosmin uptake reduction of about 29% can provide a landmark but not an accurate value.
CONCLUSION
As expected from the classification, mean relative 99mTc-tetrofosmin uptake is significantly reduced in MPMM myocardium, whereas mean MBF_micr does not show a significant difference between normal and MPMM myocardium. The difference between reduced 99mTc-tetrofosmin uptake and unchanged MBF_micr can be explained by cellular alterations in MPMM myocardium, which may affect uptake and retention by impaired transport mechanisms such as active ion channel systems and membrane potentials as well as by ultrastructural mitochondrial alterations independently of blood flow. Therefore, it seems that perfusion deficits in MPMM myocardium are greatly overestimated when 99mTc-tetrofosmin is used and tend to give false-positive findings.
Acknowledgments
Thanks are due to Alejandro Rodón for general and language editing.
Footnotes
Received Nov. 26, 2001; revision accepted Apr. 26, 2002.
For correspondence or reprints contact: Wolfgang M. Schaefer, MD, PhD, Department of Nuclear Medicine, University Hospital, Aachen University of Technology, Pauwelsstrasse 30, 52074 Aachen, Germany.
E-mail: wschaefe{at}nuk-gate.nukmed.rwth-aachen.de


