


Abstract
Primary tumor organoids are a robust model of individual human cancers and present a unique platform for patient-specific drug testing. Optical imaging is uniquely suited to assess organoid function and behavior because of its subcellular resolution, penetration depth through the entire organoid, and functional endpoints. Specifically, optical metabolic imaging (OMI) is highly sensitive to drug response in organoids, and OMI in tumor organoids correlates with primary tumor drug response. Therefore, an OMI organoid drug screen could enable accurate testing of drug response for individualized cancer treatment. The objective of this perspective is to introduce OMI and tumor organoids to a general audience in order to foster the adoption of these techniques in diverse clinical and laboratory settings.
- optical
- 3D culture
- cancer drug screens
- fluorescence imaging
- multiphoton microscopy
- primary human spheroids
Hundreds of drugs are currently approved to treat cancer, and many more are in development. Although some protein or genetic profiles, such as human epidermal growth factor receptor 2 (HER2) overexpression in breast cancer, can match patients with efficacious drugs, many therapies lack predictive biomarkers. Furthermore, the efficacy of drugs is hindered by innate and acquired drug resistance, a scenario that is detected clinically on tumor progression or recurrence. Acquired drug resistance is often driven by heterogeneous fractions of malignant cells, including minority populations of treatment-resistant cells or cancer stemlike cells that evade treatment and lead to tumor regrowth and dissemination (1–4). Treatment regimens that combine nonspecific chemotherapies with targeted drugs are common strategies to combat resistance. Although combinatorial approaches increase tumor response, the patient often experiences side effects, which can be debilitating and lead to chronic conditions. Identification of the optimal drug regimen for each patient would eradicate all malignant cells and spare patients from overtreatment. Patient-derived primary tumor organoids are a robust model of individual human cancers. It is possible to use this platform for patient-specific drug testing, which may allow for a clinical transition from predictive treatment decisions followed by watchful waiting to informed treatment plans based on patient-specific organoid responses to treatments. Optical metabolic imaging (OMI) is sensitive to metabolic changes in cells and drug response in organoids. Therefore, an OMI organoid drug screen could enable accurate testing of drug response for individualized cancer treatment. These methods could have an impact on the pharmaceutical, laboratory, and clinical environments.
PRIMARY HUMAN ORGANOIDS AS A MODEL OF CANCER
Organoids grown from primary tumor tissues provide a patient-specific model of solid tumors. Organoids are generated by mechanical or enzymatic digestion of the original tumor section into small pieces, approximately 50–500 μm in diameter. These pieces of tissue are embedded in an extracellular matrix such as Matrigel (Corning) or collagen. Organoids are relatively inexpensive to generate and maintain and require only basic cell culture skills and supplies. Hundreds to thousands of organoids can be generated from a single biopsy or resected tumor section, enabling medium- to high-throughput testing of potential drugs, drug combinations, and drug doses. (Additional details on organoids can be found in reviews by Boj et al. (5) and Fatehullah et al. (6).)
Organoids retain the organ structure, morphology, stromal composition, genetic mutations, and heterogeneity of the original tumor (5,7–10). When organoids are transplanted into mice, they form carcinomas that resemble the histology of the tumor of origin (5,7,10). Organoids are amenable to genetic, biochemical, and imaging assays and have been used to study many aspects of cancer, including carcinogenesis, cancer invasion, drug response, and drug resistance mechanisms. Genetic manipulation of organoids allows study of genetic mutations that drive or suppress cancer progression (7,8,11). Furthermore, studies of organoids have revealed characteristics and mechanisms of tumor–extracellular matrix interactions and cell invasion (12–15). Organoids have also been used to test drug response and evaluate novel drugs in development. Preliminary evidence suggests that organoid drug sensitivity correlates with patient outcome (5,7,9,10,16–21).
Organoid culture overcomes many of the limitations of traditional cancer models. Traditional monolayer cultures of immortalized cancer cells lack original tumor heterogeneity (5,7,9), native histologic architectures, and cell–extracellular matrix interactions (22). Animal models of human cancers, including genetically engineered models and xenograft models, enable in vivo studies of cancer development, progression, and drug response. However, genetic and phenotypic differences, especially in drug metabolism, immune function, and telomerase activity, exist between animal and human diseases, limiting the usefulness of animal models (23–25). Patient-derived xenografts generate patient-specific xenograft tumors in immunocompromised mice. Although patient-derived xenografts retain the tissue architecture and genomic alterations of the primary tumor (21,26), limitations, including high costs, low take-rate, and multimonth experiments for drug response data, may prevent widespread adoption (27).
ORGANOIDS AS A PLATFORM FOR PERSONALIZED DRUG SCREENS
Selection of the optimal drug regimen for individual cancer patients remains a clinical challenge. Although genetic tumor analyses identify potential drug targets, genetic screening fails to inform drug response, with reported predictive values as low as 17%–38% (28). Whole-body imaging, including MRI and PET, are under intense investigation for monitoring response to cancer treatment. However, these clinical imaging techniques allow physicians only to react to a drug combination already given to the patient, provide no information on potential treatment alternatives, and are thus fundamentally different from an individualized predictive screen. Therefore, a method to predict drug response and resistance before the onset of therapy will be transformative for cancer patients.
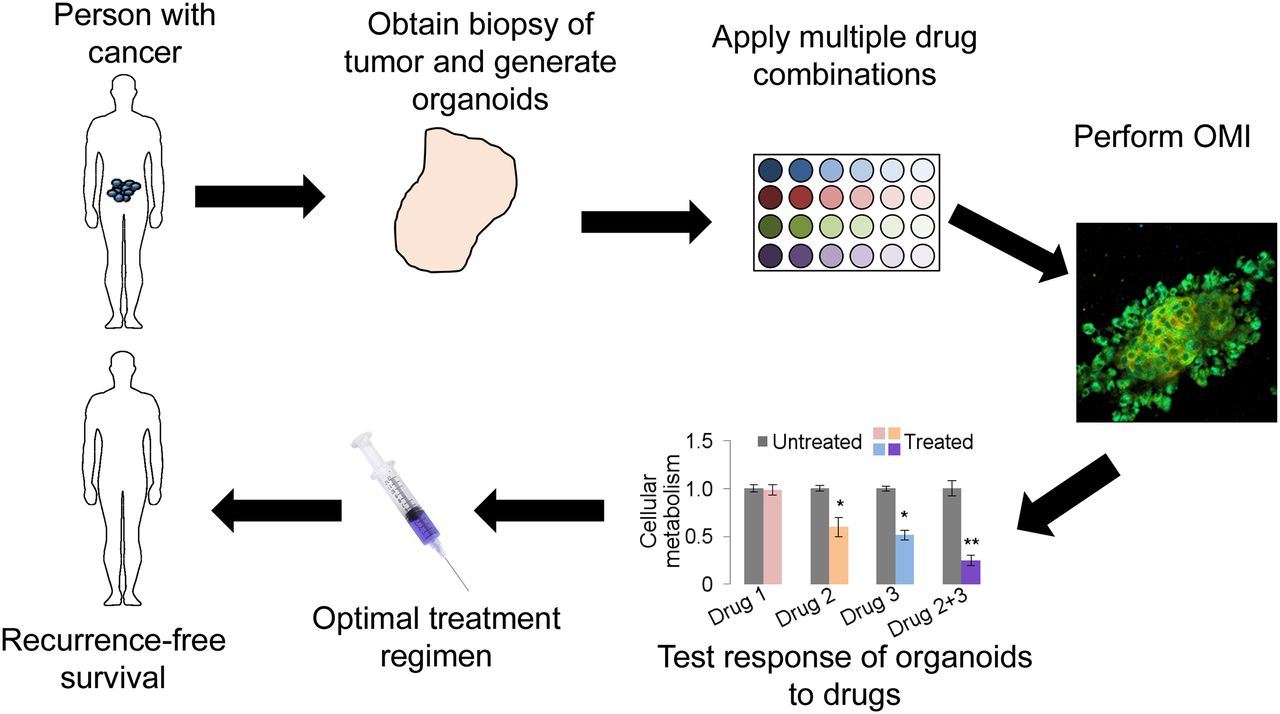
Organoid culture presents a novel platform for directly testing potential drugs on patient-specific tumor tissue. Organoids are representative of the primary tumor from which they are derived, and studies suggest that drug response in organoids corresponds to drug response in the host (18,20). Therefore, organoid-based high-throughput drug screening will enable testing of treatment options using patient-specific tissue. The workflow for a clinical organoid screen includes tumor biopsy, organoid generation and growth, drug panel treatment, response assessment, and optimal drug selection for patient treatment (Fig. 1). The entire process from biopsy to drug selection could be completed in less than 1 wk. An organoid-based anticancer drug screen could identify the optimal drugs for each patient, allowing eradication of the tumor while minimizing toxicity from overtreatment and ineffective treatment. When combined with OMI, a microscopy technique sensitive to changes in cellular metabolism, response is measured as a drug-induced change in cellular metabolism (18,20). OMI allows heterogeneity analysis of response to identify nonresponding subclones. An organoid-based screen could be implemented at hospitals and clinics with basic cell culture facilities, allowing widespread adoption. Furthermore, organoids can successfully be grown from frozen tissues (19), allowing tissue collection at remote sites and shipment of tissues to centralized assessment centers.

Clinical workflow of organoid-based anticancer drug screen.
Patient-specific organoid culture and high-throughput assays of anticancer drug response may also be used to evaluate novel drugs in development. Organoids could help bridge the gap between preclinical and clinical research by providing a relevant in vitro model of human disease. Creation and growth of organoids can be automated to improve throughput performance (16). Preclinical experiments on primary human organoids will reduce the experimental burden on preclinical animal studies and provide preclinical data to inform clinical trial design.
OPTICAL IMAGING OF ORGANOIDS
Organoids can be assessed by many biologic, molecular, genetic, and chemical assays. However, many traditional assays require tissue fixation or the pooling of substrates from many cells, limiting data analysis to a single time point and eliminating all information on spatial context, morphology, and heterogeneity. Therefore, vital imaging techniques that allow preservation of organoid viability, morphology, and heterogeneity are attractive for dynamic time-course studies of organoid behavior and drug response.
Optical imaging is well suited to study organoid morphology and behavior. Because of the small size of organoids, light can entirely penetrate the sample, allowing measurement of all cells within the organoid. Furthermore, light doses used for optical imaging are nonionizing and nondamaging, enabling time-course evaluation of individual organoids. High-resolution optical imaging allows cellular and subcellular analyses, enabling identification and quantification of cellular heterogeneity and behavioral heterogeneity (e.g., differential responses to treatment) within organoids (18,20).
Optical imaging technologies used to study organoids include bright-field microscopy, light microscopy, phase microscopy, fluorescence microscopy, confocal microscopy, time-lapse microscopy, multiphoton fluorescence imaging, fluorescence lifetime imaging, and optical coherence tomography (OCT) (8,12,18–20,29,30). In wide-field or whole-field microscopy, an entire sample or field of view is illuminated by a light source, and images are captured by a camera. Wide-field microscopy is advantageous for quickly imaging an entire organoid or dish of organoids. However, wide-field microscopy lacks depth sectioning, limiting 3-dimensional (3D) organoid visualization. Confocal microscopy allows depth-resolved imaging of organoids. In confocal microscopy, a focused laser beam illuminates the sample and a pinhole blocks scattered and out-of-plane emission light from reaching the detector, allowing depth sectioning. Because of the depth sectioning achieved by the pinhole, confocal microscopy can image depth-specific slices of organoids and 3D volumes. However, confocal microscopy is slower than wide-field microscopy. Both wide-field and confocal microscopy can use laser light sources to measure fluorescence emission.
OCT is a laser interferometry–based imaging modality that provides fast 3D images of samples. The source of contrast for OCT is the scattering properties of the sample. OCT has been used in organoids to monitor cell movement and extracellular matrix invasion (31,32). Further, functional OCT techniques such as photothermal OCT, a method that detects heat generated by laser-light absorption by gold nanoparticles or other strong absorbers, can assess protein expression or the presence of functionalized nanoparticles (33). OCT is advantageous for organoid imaging because of the 3D sectioning and fast imaging speed but is limited by spatial resolution and scattering sources of contrast.
Multiphoton microscopy is a nonlinear technique for fluorescence imaging in which fluorophores are excited by two photons with half the energy (twice the wavelength) of single-photon fluorescence. For multiphoton fluorescence events to occur, the two photons must be absorbed by the fluorophore at nearly the same time (within ∼10−18 s). Therefore, multiphoton events occur only at the focal point of the multiphoton laser, where the photon flux is highest. In this way, multiphoton microscopy achieves 3D optical sectioning with high spatial resolution. Furthermore, since all emission is attributed to the laser focal point, scattered light can be collected, improving the signal-to-noise ratio. Multiphoton microscopy light sources operate at lower energies (higher wavelengths) than single-photon techniques. Tissue absorption and scattering are low in the near-infrared wavelength range, increasing tissue penetration by light. (Additional details on multiphoton microscopy can be found in a review by Hoover and Squier (34).)
Fluorescence contrast can come from intrinsic fluorophores, including collagen and the metabolic coenzymes reduced nicotinamide adenine dinucleotide (NADH) and flavin adenine dinucleotide (FAD), or from exogenous sources, such as fluorescent dyes, fluorescent proteins, and fluorescently labeled antibodies. Some exogenous fluorescent probes can be used for live cell imaging if the probe can cross the plasma membrane or is targeted to a membrane protein. Inaccessible target proteins require cell fixation and permeabilization. Traditional fluorescence imaging measures fluorescence intensity, a property proportional to fluorophore concentration. The use of endogenous fluorophores for contrast allows live-cell imaging and repeated measurements without the complications of an added contrast agent. Exogenous fluorophores, however, allow imaging of nonautofluorescent biomolecules.
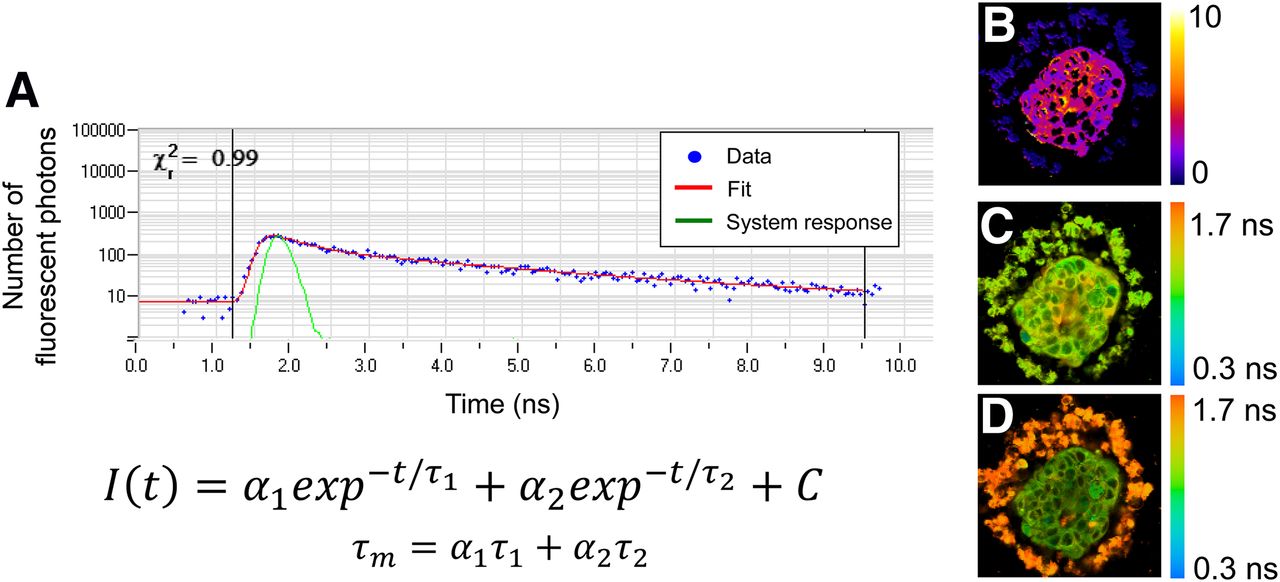
Fluorescence lifetime imaging measures the time a fluorophore remains in the excited state before returning to the ground state. The fluorescence lifetime is independent of fluorophore concentration. Fluorescent lifetime measurements can be analyzed to understand fluorophore quenching, binding states, and environmental factors (e.g., viscosity, pH). Fluorescence lifetime measurements are an accumulation of thousands of fluorescence events, which build up an exponential decay that is fit to a multicomponent exponential model. Fluorescence lifetime can be measured by fast gating of wide-field fluorescence cameras, or by time-correlated single-photon counting for laser scanning microscopes. Time-correlated single-photon-counting fluorescence lifetime imaging can be performed on multiphoton microscopes for full 3D interrogation of organoids. Fluorescence lifetime measurements by time-correlated single-photon counting provide aggregate data on the fluorescence lifetimes of thousands of singular fluorescent events. The histogram of photons by lifetime can be deconvolved from the system response and fit to an exponential decay function to resolve both short and long lifetimes, as well as the proportion of short and long lifetimes (Fig. 2A) (35). (Additional details on fluorescence lifetime imaging can be found in a book by Marcu et al. (36).)

(A) Example fluorescence lifetime data (blue dots), system response (green line), and exponential decay fit (red line). Fluorescence lifetime decays, I(t), are often fit to 2-component exponential decay model, with mean lifetime (τm) computed as weighted average of short and long lifetimes (τ1 and τ2) and proportion of short and long lifetimes (α1 and α2). χ2 provides goodness-of-fit measure. At right are representative redox ratio image (B), NADH τm image (C), and FAD τm image (D) of organoid derived from human breast cancer biopsy. (Reprinted from (20).)
OMI AS AN EARLY MEASURE OF DRUG RESPONSE IN ORGANOIDS
OMI is a powerful tool to study cellular metabolism. OMI uses multiphoton microscopy to probe the fluorescence intensities and lifetimes of NADH and FAD, coenzymes of cellular metabolism processes. OMI includes the optical redox ratio (the fluorescence intensity of NADH divided by the intensity of FAD), which provides a relative measure of the glycolytic state of the cell (35). Figures 2B–2D show representative OMI images of an organoid derived from a human breast cancer biopsy sample. On binding to enzymes, NADH and FAD exhibit conformational changes that result in short and long fluorescence lifetimes. NADH self-quenches in its natural state, thus exhibiting a short lifetime. When bound, NADH unfolds and the quenching effect is lost, increasing fluorescence lifetime. Conversely, FAD exhibits a long free lifetime and short bound lifetime (35). In this way, the fluorescence lifetime provides a measure of NADH and FAD binding activities (35). Additional methods can be used to assess cellular metabolism, including assays of metabolites and immunohistochemistry. OMI is advantageous for live cell imaging and repeated, temporal measurements.
Cancer cells often use aerobic glycolysis to support high levels of macromolecule production and proliferation. Fluorescence lifetime studies of cancers have revealed metabolic differences between transformed and premalignant tissues (35,37). OMI can also detect changes in metabolism due to treatment with anticancer drugs (20,35). (Additional details on the relationship between cancer and metabolism have been presented in a review by Zhao et al. (38).) Importantly, NADH and FAD are used differentially in distinct steps of aerobic glycolysis, oxidative phosphorylation, and other metabolic pathways. Because OMI can accurately measure NADH and FAD fluorescence lifetimes, OMI can be applied to assess how oncogenic signaling pathways affect cellular metabolism, how they are altered by cancer treatments, and how these responses correlate with treatment response. In HER2-overexpressing breast cancer cells and xenograft tumors, OMI revealed decreases in the redox ratio, mean NADH fluorescence lifetime, and mean FAD fluorescence lifetime on treatment with the HER2-targeting antibody trastuzumab (35).
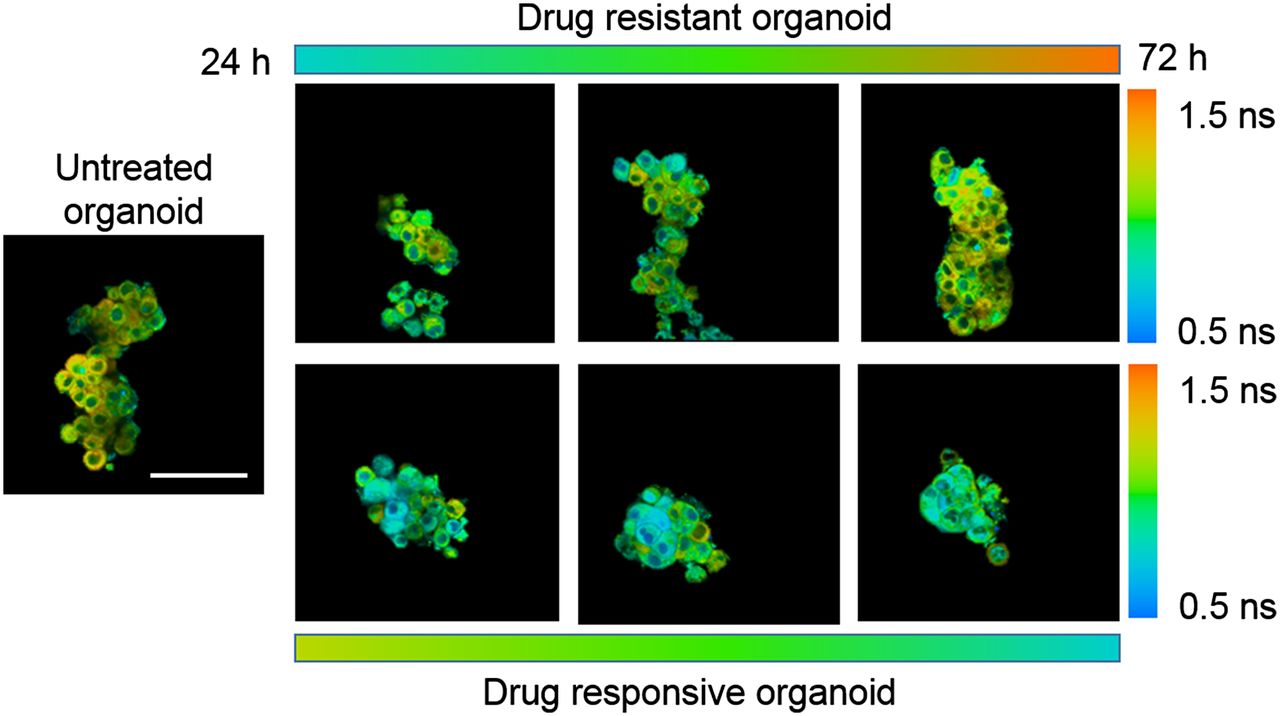
We have used OMI to study metabolic differences between nontransformed and malignant cells and tissues, the relationship between oncogenic signaling pathways and cellular metabolism, and drug-induced effects on metabolism (18,20,35,37,39). Importantly, our studies demonstrated that OMI is a sensitive and early reporter of drug efficacy in organoids (Fig. 3), detecting metabolic changes within the first 24–72 h of exposure to effective drugs (18–20,35). Parallel in vivo mouse and in vitro organoid drug response studies in pancreatic and breast cancer show a direct correlation between organoid-measured drug response at 24–72 h and in vivo tumor burden at 3–4 wk (18,20). Primary breast cancer organoids from clinical specimens confirmed that OMI measurements of drug responses agreed with the responses expected on the basis of HER2 or estrogen receptor expression in the original tumor (20). These results indicate that OMI provides a robust and accurate platform to measure drug response over time in organoids derived from multiple cancer types. In these studies, organoids were exposed to saturating doses of drugs. In large organoids, drug delivery is limited by diffusion and replicates in vivo heterogeneity with systemic drug delivery. Organoids can also be exposed to variable drug doses to evaluate the effects of heterogeneous drug delivery.

OMI of primary (HER2-positive) human tumor organoids that develop resistance to paclitaxel chemotherapy over 72 h of treatment (upper row) and that respond to experimental drug cocktail of trastuzumab (anti-HER2) plus paclitaxel plus XL147 (lower row). A longer NADH mean lifetime, as evidenced by more red and orange tones, indicates resistance, whereas a shorter NADH mean lifetime, as evidenced by blue, indicates response. Scale bar is 100 μm.
To fully exploit the information from all OMI endpoints, we developed the OMI index as a single, global biomarker of cellular metabolism (18,20). The OMI index is the linear combination of the norm-centered redox ratio, mean NADH lifetime, and mean FAD lifetime, with the coefficients (1, 1, −1), respectively, computed for each cell. The OMI index combines the information from the individual OMI endpoints into a single value to represent the metabolic state of the cell.
Because of the subcellular resolution of OMI, cellular heterogeneity within organoids can be quantified and monitored over time with anticancer drug treatment (Fig. 4) (18,20,35,39). When analyzed on a single-cell level, an entire cell population can be assessed for heterogeneity in metabolism. The metabolic distribution in populations of cells can be modeled by gaussian curves, to identify the number of modes (subpopulations) within the data (20), revealing inherent and drug-induced heterogeneity within organoids (18,20,35). These studies successfully identified an initially small subpopulation of treatment-resistant cancer cells that selectively grew with continued drug treatment (18).

(A) NADH fluorescence lifetime image of organoid derived from HER2-positive human breast cancer biopsy sample demonstrates intraorganoid heterogeneity (reprinted from (20)). (B) Population modeling of representative organoid data, where blue bars are data and red lines are gaussian fits. (C) Population-density models of human-derived breast cancer organoids treated with control, trastuzumab plus paclitaxel plus XL147 (H+P+X), and trastuzumab plus paclitaxel plus tamoxifen plus XL147 (H+P+T+X). H+P+X-treated organoids demonstrate responding and nonresponding populations, whereas H+P+T+X-treated organoids demonstrate greater proportion of responding cells.
CONCLUSION
Because of the individualized nature of cancer, it is important to treat each cancer patient with anticancer drugs specifically selected to target their tumor. Organoid culture of primary tumor tissue provides patient-specific tumor models to test and evaluate potential anticancer treatments. Because cancer cells rely on cellular metabolism pathways to sustain high rates of proliferation and survival, OMI is a sensitive screen to evaluate drug action in organoids. OMI can probe each cell within an organoid to reveal subpopulations resistant to anticancer drugs. High-throughput optical imaging of drug response in patient-derived organoids could enable patient-specific drug testing and help clinicians select the optimal drug regimen for each cancer patient.
DISCLOSURE
No potential conflict of interest relevant to this article was reported.
Footnotes
Published online Jun. 6, 2017.
- © 2017 by the Society of Nuclear Medicine and Molecular Imaging.
REFERENCES
- Received for publication March 20, 2017.
- Accepted for publication May 26, 2017.


Jump to section
Related Articles
Cited By...
- Metabolic heterogeneity of colorectal cancer as a prognostic factor: insights gained from fluorescence lifetime imaging
- Integrating Subclonal Response Heterogeneity to Define Cancer Organoid Therapeutic Sensitivity
- Kinetic Analysis of Lipid Metabolism in Live Breast Cancer Cells via Nonlinear Optical Microscopy
- Breast tumour organoids: promising models for the genomic and functional characterisation of breast cancer