


Abstract
11C-elacridar and 11C-tariquidar are new PET tracers to assess the transport activity of P-glycoprotein (adenosine triphosphate–binding cassette subfamily B, member 1 [ABCB1]) and breast cancer resistance protein (adenosine triphosphate–binding cassette subfamily G, member 2 [ABCG2]). This study investigated the whole-body distribution and radiation dosimetry of both radiotracers in humans. Methods: Twelve healthy volunteers (6 women, 6 men) underwent whole-body PET/CT imaging over the 90 min after injection of either 11C-elacridar or 11C-tariquidar. Radiation doses were calculated with OLINDA/EXM software using adult reference phantoms. Results: Biodistribution was consistent with a major elimination route of hepatobiliary excretion, which may be mediated by ABCB1 and ABCG2. High radioactivity uptake was seen in liver, followed by spleen and kidneys, whereas brain uptake was lowest. Effective doses were 3.41 ± 0.06 μSv/MBq for 11C-elacidar and 3.62 ± 0.11 μSv/MBq for 11C-tariquidar. Conclusion: Our data indicate that both 11C-elacridar and 11C-tariquidar are safe radiotracers, for which an injected activity of 400 MBq corresponds to a total effective dose of approximately 1.5 mSv.
The transporters P-glycoprotein (adenosine triphosphate–binding cassette subfamily B, member 1 [ABCB1]) and breast cancer resistance protein (adenosine triphosphate–binding cassette subfamily G, member 2 [ABCG2]) are highly expressed in excretory organs (liver, kidney, intestine) and at blood–tissue barriers (blood–brain [BBB], blood–testis, blood–placenta, and blood–retina) (1). These transporters are capable of transporting drugs and drug metabolites. They can therefore influence drug disposition, such as by mediating hepatobiliary and renal excretion and by controlling intestinal absorption of drugs. At the BBB, ABCB1 and ABCG2 work together in limiting brain distribution of dual ABCB1/ABCG2 substrate drugs, such as tyrosine kinase inhibitors (2). ABCB1/ABCG2-mediated efflux transport is an important reason why many drugs fail to achieve therapeutically effective concentrations in the brain. Alteration of ABCB1 and ABCG2 transport activity in different organs by polymorphisms in the genes encoding ABCB1 and ABCG2, by drug–drug interactions, and by disease-induced mechanisms can lead to variability in the pharmacokinetics of ABCB1/ABCG2 substrate drugs and may have important consequences for drug safety and efficacy (1).
PET with radiolabeled ABCB1 substrates, such as 11C-verapamil and 11C-N-desmethyl-loperamide, has proven useful for assessing ABCB1 function at the BBB (3). To our knowledge, no PET tracers are available yet to measure ABCG2 function at the BBB. We introduced 11C-elacridar and 11C-tariquidar as a new class of radiotracer to measure both ABCB1 and ABCG2 function at the BBB (4–7). ABCB1 and ABCG2 may influence the pharmacokinetics of 11C-elacridar and 11C-tariquidar not only in the brain but also in peripheral organs such as the liver, thus potentially enabling assessment of transport activity in these organs. This study used PET/CT to investigate the whole-body distribution and radiation dosimetry of 11C-elacridar and 11C-tariquidar in healthy volunteers.
MATERIALS AND METHODS
Subjects
The study was registered with EudraCT, the European Clinical Trials Database (number 2010-020759-30), and approved by the Ethics Committee of the Medical University of Vienna. Twelve healthy volunteers with no evidence of renal or hepatic dysfunction and no history of surgery were included. Six women (mean age ± SD, 28.6 ± 7.2 y; mean weight, 60.7 ± 4.9 kg) and 6 men (mean age, 25.6 ± 1.6 y; mean weight, 73.3 ± 5.6 kg) were randomly assigned to receive either 11C-elacridar (n = 3 per sex) or 11C-tariquidar (n = 3 per sex).
Radiotracer Synthesis
11C-elacridar and 11C-tariquidar were synthesized as previously described (6). The specific activities at the time of injection were 62.6 ± 45.1 GBq/Μmol for 11C-elacridar and 19.6 ± 1.9 GBq/Μmol for 11C-tariquidar, with radiochemical purity exceeding 97%.
PET/CT Protocol
All scanning was performed on a Biograph TruePoint 64 PET/CT scanner (Siemens Healthcare USA). The subjects were positioned on a vacuum mattress to minimize movement artifacts. After a low-dose whole-body CT scan, 11C-elacridar (400 ± 9 MBq) or 11C-tariquidar (375 ± 57 MBq) was injected intravenously and a 30-min dynamic PET scan of brain, thorax, or lower abdomen was acquired (n = 2 per radiotracer and organ group, 1 man and 1 woman each). Thereafter, 2 whole-body scans, with a 3-min acquisition time per bed position for the first scan and 5 min for the second scan, were obtained. Depending on the subject’s size, 5–6 bed positions were needed to scan from the middle of the thigh to the top of the head. At the end of the imaging study, the subjects were asked to empty their urinary bladders, and the radioactivity excreted into urine was measured using a γ-counter.
Image Analysis
PET/CT images were analyzed using the open-source software AMIDE. Volumes of interest were drawn on the fused PET/CT data around organs and tissues that had visible radioactivity uptake, including liver, gallbladder, kidneys, spleen, myocardium, urinary bladder, muscle (quadriceps femoris), small intestine, red bone marrow (L3 to L5), and brain. Dynamic PET data (the first 30 min of the scan) were available for only 2 subjects (1 man, 1 woman) per organ group (brain, thorax, or lower abdomen) and were assumed representative of the whole group. Furthermore, volumes of interest were applied to the static acquisitions recorded at 32.5 ± 1.2 min and 54.5 ± 2.5 min after radiotracer injection. For each volume of interest and each time point, the individual SUV was calculated. Time–activity curves were generated for each volume of interest, and the residence time, that is, the time-integrated activity coefficient according to the MIRD nomenclature, was calculated (8). For each subject, the organ masses were determined by scaling the organ masses of the respective reference phantoms (9) according to the subject’s weight. The resulting residence times of the 5 source organs with the highest radioactivity concentrations, together with the remainder of the body, defined as the total number of disintegrations in the body minus the disintegrations in the aforementioned source organs, were used as input for the dose calculation with OLINDA/EXM (10). The results are presented as organ-equivalent doses and effective dose according to the definitions in publication 103 of the International Commission on Radiological Protection (11).
RESULTS
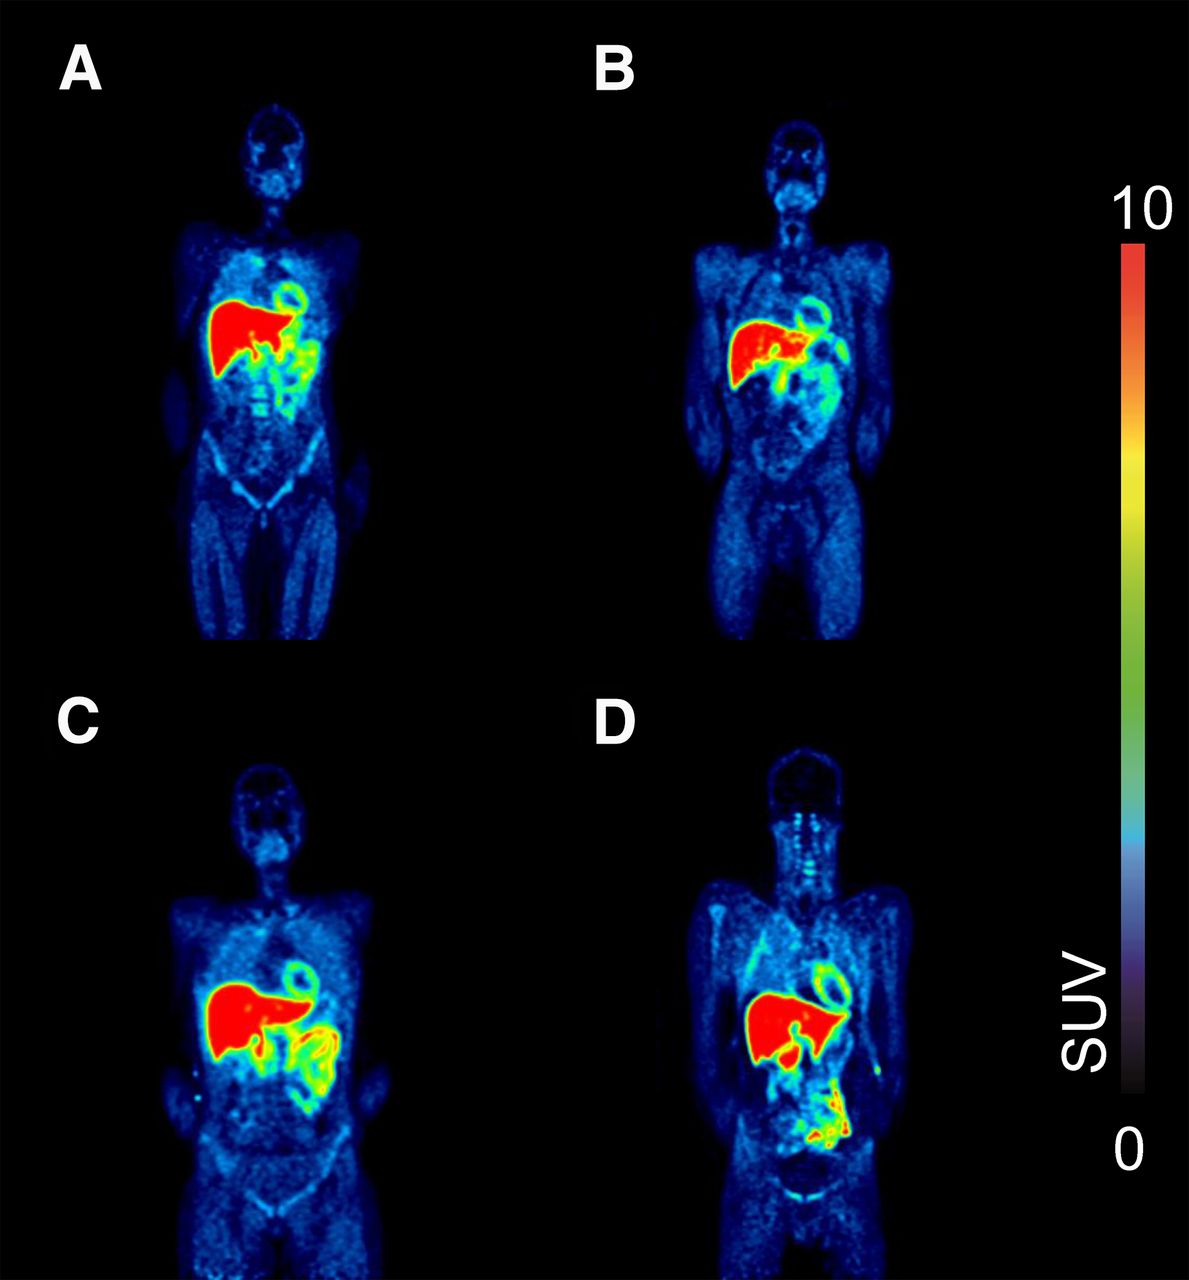
The acquisition protocol allowed for measurement of radiotracer kinetics in a range of different organs. There was no indication that any subject moved between the low-dose CT and PET scans or during the PET scan. Typical coronal whole-body images of 11C-elacridar and 11C-tariquidar are shown in Figure 1. The time–activity curves for 11C-elacridar and 11C-tariquidar in individual organs averaged over all subjects are shown in Figures 2 and 3. All investigated organs except spleen displayed slow washout of radioactivity during the PET scan. Radioactivity concentrations measured in different organs in the whole-body scans did not significantly differ between men and women (2-way ANOVA). In 1 subject who received 11C-elacridar and 5 subjects who received 11C-tariquidar, the percentage of radioactivity excreted into urine was measured. For 11C-elacridar, 0.8% of the injected dose was excreted, and for 11C-tariquidar, 1.9% ± 0.6% of the injected dose (n = 4) was excreted. The percentage of 11C-tariquidar excreted into urine was markedly higher in one of the 5 subjects (18.8% injected dose); that subject had a markedly lower gallbladder SUV in the second whole-body scan than did the other 4 subjects (12.4 vs. 41.5 ± 30.7). Organ-equivalent and total effective doses for both radiotracers are given in Table 1. The organ with the highest radiation burden was liver, followed by spleen and kidneys.

Coronal views showing biodistribution in representative subjects at 32.5 ± 1.2 min after injection: 11C-elacridar in a woman (A) and a man (B) and 11C-tariquidar in a woman (C) and a man (D). Scale is SUV from 0 to 10.

Time–activity curves (SUVmean ± SE of mean) for 11C-elacridar (A) and 11C-tariquidar (B) in different organs.

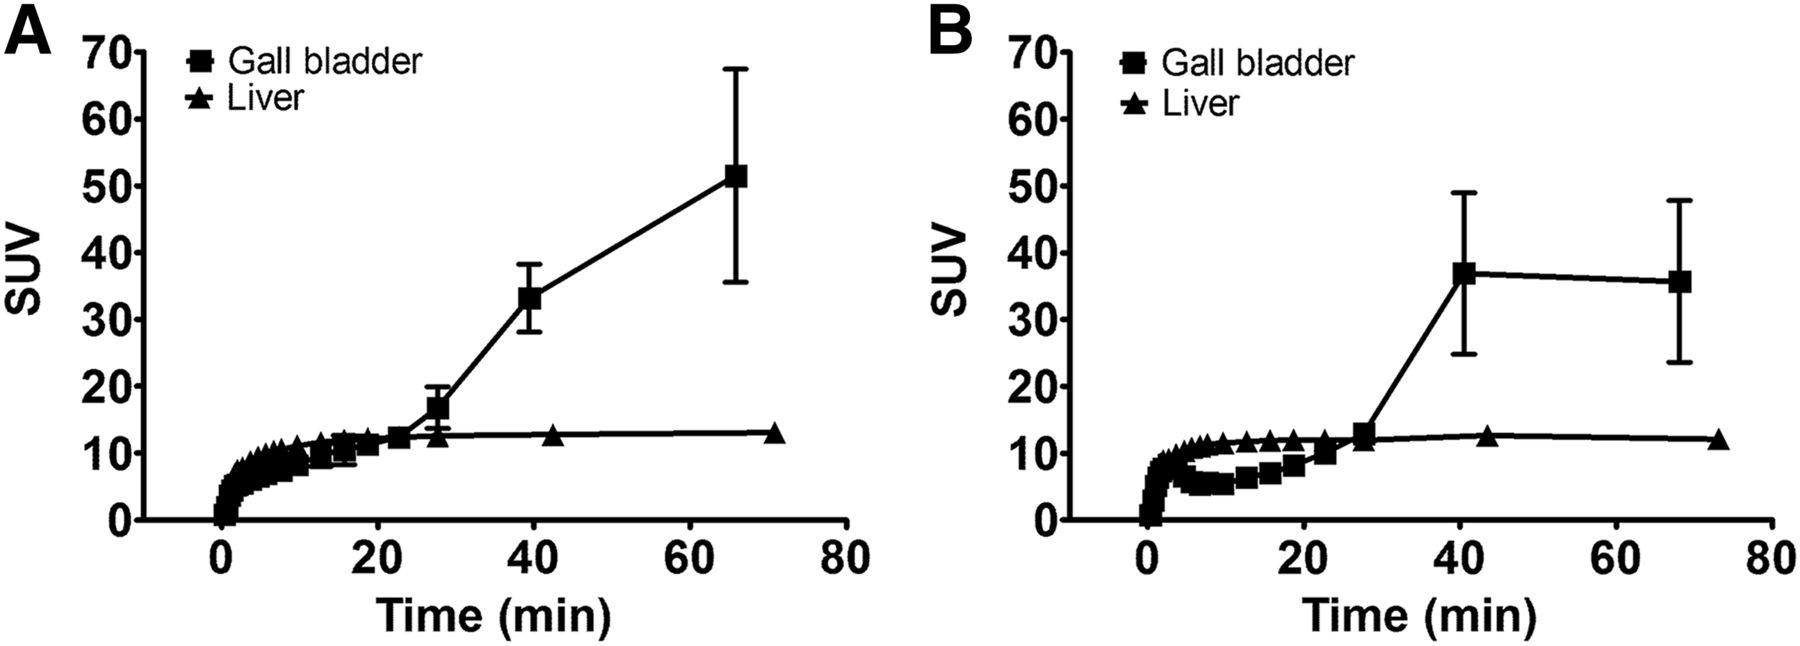
Time–activity curves (SUVmean ± SE of mean) for 11C-elacridar (A) and 11C-tariquidar (B) in liver and gallbladder.
Organ-Equivalent and Effective Doses for 11C-Elacridar and 11C-Tariquidar
DISCUSSION
We studied the whole-body distribution of 11C-elacridar and 11C-tariquidar in healthy men and women. Elacridar and tariquidar were originally developed as third-generation ABCB1 inhibitors for use in cancer patients to overcome ABCB1-mediated multidrug resistance of tumors. Later, elacridar and tariquidar were also found to inhibit ABCG2 (12,13). We and others found that elacridar and tariquidar—in microdoses as used for PET—are substrates of murine and human ABCB1 and ABCG2 and undergo only negligible metabolism (4–7,14,15). 11C-elacridar and 11C-tariquidar can be used to assess ABCB1 and ABCG2 function at the rodent and human BBB (4–7). Because ABCB1 and ABCG2 are also expressed in clearance organs (liver, kidney, intestine), they can influence the pharmacokinetics of drugs. A PET method to assess ABCB1 and ABCG2 function in different organs would therefore be of great interest in drug development.
The whole-body distribution of 11C-elacridar and 11C-tariquidar was characterized by a high radioactivity concentration in liver, gallbladder, and intestine and a negligible radioactivity concentration in urinary bladder, suggesting that biliary excretion and possibly intestinal secretion are major routes of elimination of these radiotracers (Fig. 1). The rise in gallbladder radioactivity over the course of the PET experiment (Fig. 3) supports the possibility that both of the radiotracers or their radiolabeled metabolites are excreted into bile. A previous study assessed the effect of increasing doses of unlabeled tariquidar on whole-body distribution of 11C-tariquidar in mice and found a dose-dependent decrease in the radioactivity recovered from the small intestine (14). This result suggests a saturable, transporter-mediated mechanism of biliary excretion or intestinal secretion. ABCB1 and ABCG2 may be involved in these processes because these transporters are expressed both in the canalicular membrane of hepatocytes and in the luminal membrane of intestinal epithelial cells, where they transport drugs and drug metabolites from hepatocytes into bile canaliculi or from blood directly into the intestine (1). Consistent with previous studies, the lowest distribution of radioactivity was to the brain, as can be explained by ABCB1- and ABCG2-mediated efflux transport at the BBB (6,7). The time–activity curves for 11C-elacridar and 11C-tariquidar in all studied organs except spleen were characterized by a slow washout, which may be due to intracellular acidic trapping of the weak bases elacridar and tariquidar in lysosomes (16).
The highest dose was received by liver, followed by spleen and kidneys, and these doses were considerably higher than those to blood-forming organs, gonads, or whole body (Table 1). Observed sex differences can most likely be attributed to the differing S values, reflecting differing anatomy, in the female and male reference phantoms used in OLINDA/EXM. The measured average effective doses for 11C-elacidar and 11C-tariquidar were within the same range as observed for other 11C-tracers (17).
CONCLUSION
We determined an average whole-body exposure of 3.41 ± 0.06 μSv/MBq for 11C-elacidar and 3.62 ± 0.11 μSv/MBq for 11C-tariquidar, corresponding to a total effective dose of approximately 1.5 mSv for an injected activity of 400 MBq.
DISCLOSURE
The costs of publication of this article were defrayed in part by the payment of page charges. Therefore, and solely to indicate this fact, this article is hereby marked “advertisement” in accordance with 18 USC section 1734. This study was supported by grants KLI 139-B00, KLI 480-B30, and F 3513-B20 from the Austrian Science Fund (FWF) and grant 201380 from the European Community’s Seventh Framework program. No other potential conflict of interest relevant to this article was reported.
Acknowledgments
We thank the staff of the PET/CT unit in the Division of Nuclear Medicine (Georg Dobrozemsky, Bettina Reiterits, Benedikt Schmiedinger, Barbara Straubinger, Katja Salzmann, Gabriele Wagner, and Georgios Karanikas) and the study nurse, Maria Weber, for their support.
Footnotes
Published online Apr. 14, 2016.
- © 2016 by the Society of Nuclear Medicine and Molecular Imaging, Inc.
REFERENCES
- Received for publication March 2, 2016.
- Accepted for publication March 11, 2016.


Jump to section
Related Articles
Cited By...
- No citing articles found.