


Abstract
The experimental autoimmune encephalomyelitis model is a model of multiple sclerosis that closely mimics the disease characteristics in humans. The main hallmarks of multiple sclerosis are neuroinflammation (microglia activation, monocyte invasion, and T-cell infiltration) and demyelination. PET imaging may be a useful noninvasive technique for monitoring disease progression and drug treatment efficacy in vivo. Methods: Experimental autoimmune encephalomyelitis was induced by myelin-oligodendrocyte glycoprotein immunization in female Dark Agouti rats. Experimental autoimmune encephalomyelitis rats were imaged at baseline and at days 6, 11, 15, and 19 after immunization to monitor monocyte and microglia activation (11C-PK11195) and demyelination (11C-MeDAS) during normal disease progression and during treatment with dexamethasone. Results: 11C-PK11195 PET detected activation of microglia and monocytes in the brain stem and spinal cord during disease progression. The uptake of 11C-PK11195 was elevated in dexamethasone-treated animals that had shown mild clinical symptoms that had resolved at the time of imaging. Demyelination was not detected by 11C-MeDAS PET, probably because of the small size of the lesions (average, 0.13 mm). Conclusion: PET imaging of neuroinflammation can be used to monitor disease progression and the consequences of treatment in the experimental autoimmune encephalomyelitis rat model. PET imaging was more sensitive than clinical symptoms for detecting inflammatory changes in the central nervous system.
Multiple sclerosis (MS) is a neurodegenerative disease characterized by neuroinflammation and demyelination in the central nervous system (CNS). The most common treatment of MS is immunomodulatory therapy, which focuses on preventing or reducing the infiltration of immune cells into the CNS (1). Glucocorticoids modulate the survival of inflammatory cells and their migration to the CNS, resulting in a shorter duration, reduced severity of relapse, and acceleration of recovery. The administration of dexamethasone strongly decreased the clinical symptoms and the disease duration of experimental autoimmune encephalomyelitis (EAE) (2).
MS patients are basically monitored by changes in clinical symptoms and by MR imaging, which detects lesions in the CNS but does not differentiate these lesions as inflammation, demyelination, or axonal damage (3). A noninvasive imaging technique such as PET could differentiate and quantify MS hallmarks and thus could be an important tool to monitor therapeutic response and help to better understand drug mechanisms. The potential of PET for imaging several hallmarks of MS was shown in animal models (4–13) and in patients (14–22), but different hallmarks were not longitudinally measured at the same time in these studies. Despite the fact that MS comprises multiple aspects that are important for therapy monitoring and drug development, PET is not yet regularly applied in a clinical setting.
The aim of our study is to show the potential of PET imaging as a tool for simultaneous monitoring of monocyte and microglia activation and demyelination during normal disease progression and during treatment with the antiinflammatory drug dexamethasone in the EAE rat model. To this end, we used 11C-PK11195 for neuroinflammation and 11C-MeDAS for demyelination. 11C-PK11195 binds to the translocator protein, which is increased in activated microglia and infiltrating monocytes (23). 11C-MeDAS is a novel ligand for in vivo PET imaging of myelin content and has recently shown the ability to detect demyelination in MS animal models (11,13).
MATERIALS AND METHODS
Animal Model and Treatment
Animal experiments were performed according to the Dutch Regulations for Animal Welfare. All procedures were approved by the Institutional Animal Care and Use Committee of the University of Groningen (protocol DEC6480A).
EAE induction was adapted from the protocol described by Ledeboer et al. (24) with minor modifications. Female 9- to 12-wk-old Dark Agouti rats (Janvier Laboratories) weighing 150–170 g were anesthetized with isoflurane and immunized intradermally at the dorsal tail base with 25 μg of endotoxin-free rat recombinant myelin oligodendrocyte glycoprotein1–125 (Tebu-bio) dissolved in 100 μL of 25 mM sodium acetate pH 4.0 and emulsified in 100 μL of incomplete Freund adjuvant (IFA; Difco Laboratories). A total volume of 200 μL (1:1) was divided into two batches of 100 μL each and injected at two different locations. At day 8 after immunization (onset of symptoms), treatment was started with daily intraperitoneal injections of either 1 mg/kg of dexamethasone acetate (Sigma-Aldrich) in saline (treatment group) or saline alone (control group).
Rats were weighed and examined for neurologic symptoms daily. Symptoms were scored on a scale of 0–5: 0, no clinical symptoms; 0.5, distal limp tail; 1, complete limp tail; 2, ataxia; 3, moderate paraparesis; 3.5, one-hind-limb paralysis; 4, complete hind-limb paralysis; 5, moribund or dead. Food and water were given ad libitum, but paralyzed animals were provided water and food by hand 3–4 times a day. In animals with paralysis, daily injections (1–2 times) of saline were also given subcutaneously. Animals reaching score 5 were euthanized.
PET Imaging
Animals were longitudinally imaged in a small-animal PET scanner (Focus 220, Siemens) at baseline (2 d before immunization) and at days 6, 11, 15, and 19 after immunization. Six animals per group were scanned longitudinally, whereas one additional animal per group was scanned at only one time point and subsequently euthanized for immunohistochemical analysis.
In each animal, 11C-PK11195 PET was performed in the morning, followed by 11C-MeDAS PET in the afternoon. For each PET scan, animals were anesthetized with isoflurane in medical air (5% for induction, 1.0%–2.0% for maintenance). For imaging of microglia activation or monocyte invasion, 30–60 MBq of 11C-PK11195 (25) were injected into the tail vein. After 40 min, the animals were positioned in the PET camera with the head and upper part of the spinal cord (cervical plus half of the thoracic portion) in the field of view. Forty-five minutes after tracer injection, a 30-min static emission scan was acquired. PET imaging of demyelination was performed in a similar manner, except that the emission scan was started 30 min after the injection of 40–60 MBq of 11C-MeDAS (13).
After each emission scan, a transmission scan was performed for attenuation and scatter correction. Immediately after the last PET scan in the study, animals were euthanized and perfused with saline, and the brain and spinal cord were dissected for immunohistochemical analysis.
PET Image Reconstruction and Analysis
Emission sinograms were iteratively reconstructed (ordered-subsets expectation maximization, 2-dimensional; 4 iterations) after being normalized and corrected for attenuation, scatter, and decay of radioactivity. PET image analysis was performed with Inveon research workstation software (Siemens). Only images used for illustration were smoothed using a 1.5-mm gaussian filter. Regions of interest were drawn in different parts of the CNS (cerebellum, brain stem, striatum, whole brain, and spinal cord) using a rat MR image as the brain template and the 11C-MeDAS image of the same animal at the same time as the spinal cord template (Fig. 1B). Salivary glands and harderian glands were used as landmarks to check coregistration. Radioactivity concentration, obtained from the regions of interest, was corrected for injected dose and presented as percentage injected dose per gram of tissue (%ID/g) for 11C-PK11195 and 11C-MeDAS PET.
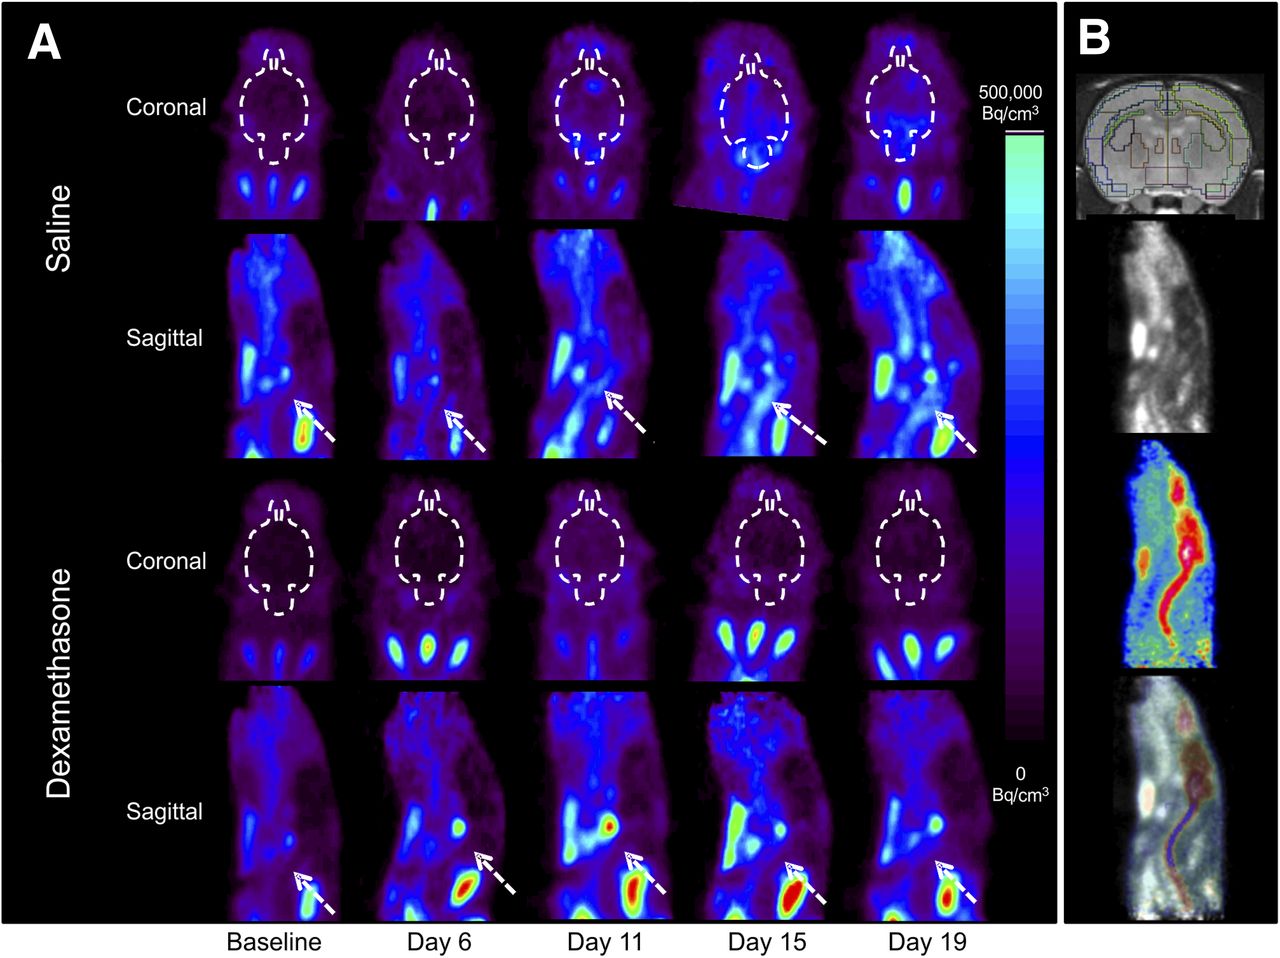
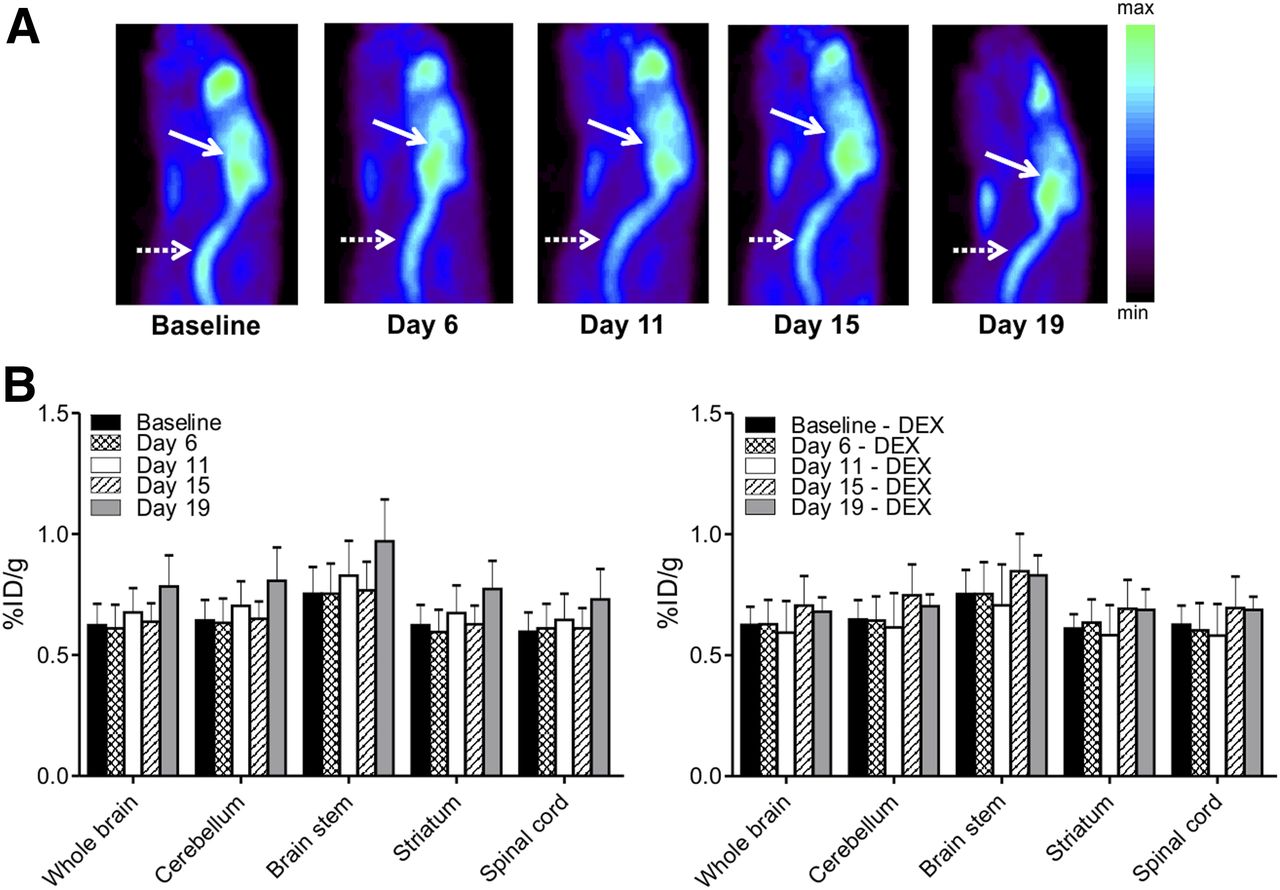
11C-PK11195 PET images in different illustrative animals. (A) Images at baseline and at different time points after immunization. Top: animals treated with saline; bottom: animals treated with dexamethasone. White dashed lines delineate brain in coronal views; arrows depict spinal cord in sagittal views. (B) Illustrative regions of interest. From top to bottom: brain regions of interest over MR imaging template, 11C-PK11195 PET image, 11C-MeDAS PET image, and fusion of 11C-PK11195 and 11C-MeDAS PET images in same animal illustrate region of interest in spinal cord.
Immunohistochemistry
Luxol fast blue (Sigma-Aldrich) histochemistry (myelin staining) and ionized calcium-binding adapter molecule 1 (Iba1) immunohistochemistry (microglia and monocyte staining) were performed as previously described (13,26). Iba1 staining of activated microglia and monocytes was scored semiquantitatively: 0, no inflammation; 1, sporadic inflammation in 1–5 small areas; 2, multifocal inflammation in 5–10 small areas; 3, multifocal inflammation in 5–10 large areas; and 4, multifocal inflammation in large parts of the tissue.
Statistical Analysis
The results are presented as mean ± SD. Differences between groups for disease score and weight loss were analyzed using the t test. Differences in PET imaging data were analyzed using two-way ANOVA with either time or disease score as the factor (GraphPad Prism software). Saline and dexamethasone groups were analyzed separately for each region of interest. The Bonferroni post hoc test was used to correct for multiple comparisons. Differences were considered statistically significant at a P value of less than 0.05.
RESULTS
EAE Disease Progression
The EAE incidence was 100% in saline-treated animals, of which 92% became paralyzed (disease score ≥ 3.5). In dexamethasone-treated animals, only 50% showed minor disease symptoms but never became paralyzed. Weight loss and disease score during the disease progression are shown in Figure 2. The disease onset occurred between 7 and 13 d after immunization. Peaks of symptoms were observed at 14–15 d and at day 19 after immunization (relapse). The condition of the animals improved in the recovery phase (days 16–18), when some paralyzed animals recovered movement, but regression was incomplete (animals showed a score of at least 0.5). Weight loss in dexamethasone-treated rats (maximum, 20%) was significantly higher than in saline-treated animals (maximum, 12%) except during exacerbations of symptoms, when paralyzed animals in the saline group ate less.

EAE disease progression in saline-treated rats and rats treated with dexamethasone (1 mg/kg daily, starting at day 8). All animals were included, regardless of whether imaging was performed at that specific time. Because of premature death and sacrifice for immunohistochemistry, groups’ sizes changed during experiment (for each group: days 1–6, n = 10; days 7–11, n = 8; days 12–14, n = 6; days 15–19, n = 4). Bar graph shows disease scores, and line graph shows percentage of weight loss relative to day of immunization procedure (day 0). Black line with black squares represents saline-treated EAE group, and black line with white squares represents dexamethasone-treated EAE group. Statistical differences (t test) in weight loss between control and dexamethasone groups are *P < 0.05, **P < 0.01, and ***P < 0.001. Disease scores are significantly different between groups from day 11 onward (t test).
Microglia Activation and Monocyte Invasion
The factor time point had a significant main effect on 11C-PK11195 uptake (F4,25 = 10.68, P < 0.0001) in the brain stem of the saline group, with significant differences between baseline and day 15 (+74%, P < 0.001) and day 19 (+55%, P < 0.01) after immunization (Figs. 1 and 3). In the spinal cord of the saline group, the factor time also had a significant effect on 11C-PK11195 uptake (F4,25 = 6.41, P = 0.0004), which was increased as compared with baseline at day 11 (+41%, P < 0.05), day 15 (+49%, P < 0.01), and day 19 (+41%, P < 0.05) after immunization. Other regions of the brain did not show a significant increase in tracer uptake. In the dexamethasone-treated group, no statistically significant differences in 11C-PK11195 uptake over time were found for any of the brain regions.

Quantification of 11C-PK11195 uptake at different time points shows progression of neuroinflammation in saline-treated EAE group (A) and in dexamethasone-treated (DEX) EAE group (B). Significant differences as compared with baseline are illustrated by *(P < 0.05) and ***(P < 0.001) (n = 6 for first 3 time points and n = 4 for last 2 time points). (C) 11C-PK11195 uptake related to disease score, presented as percentage of injected dose (%ID) per gram of tissue, classified according to disease score on day of imaging. Scans were grouped by disease score, independent of time point at which image was acquired. Statistically significant differences, as compared with score of 0 for respective group, are *P < 0.05, **P < 0.01, and ***P < 0.001.
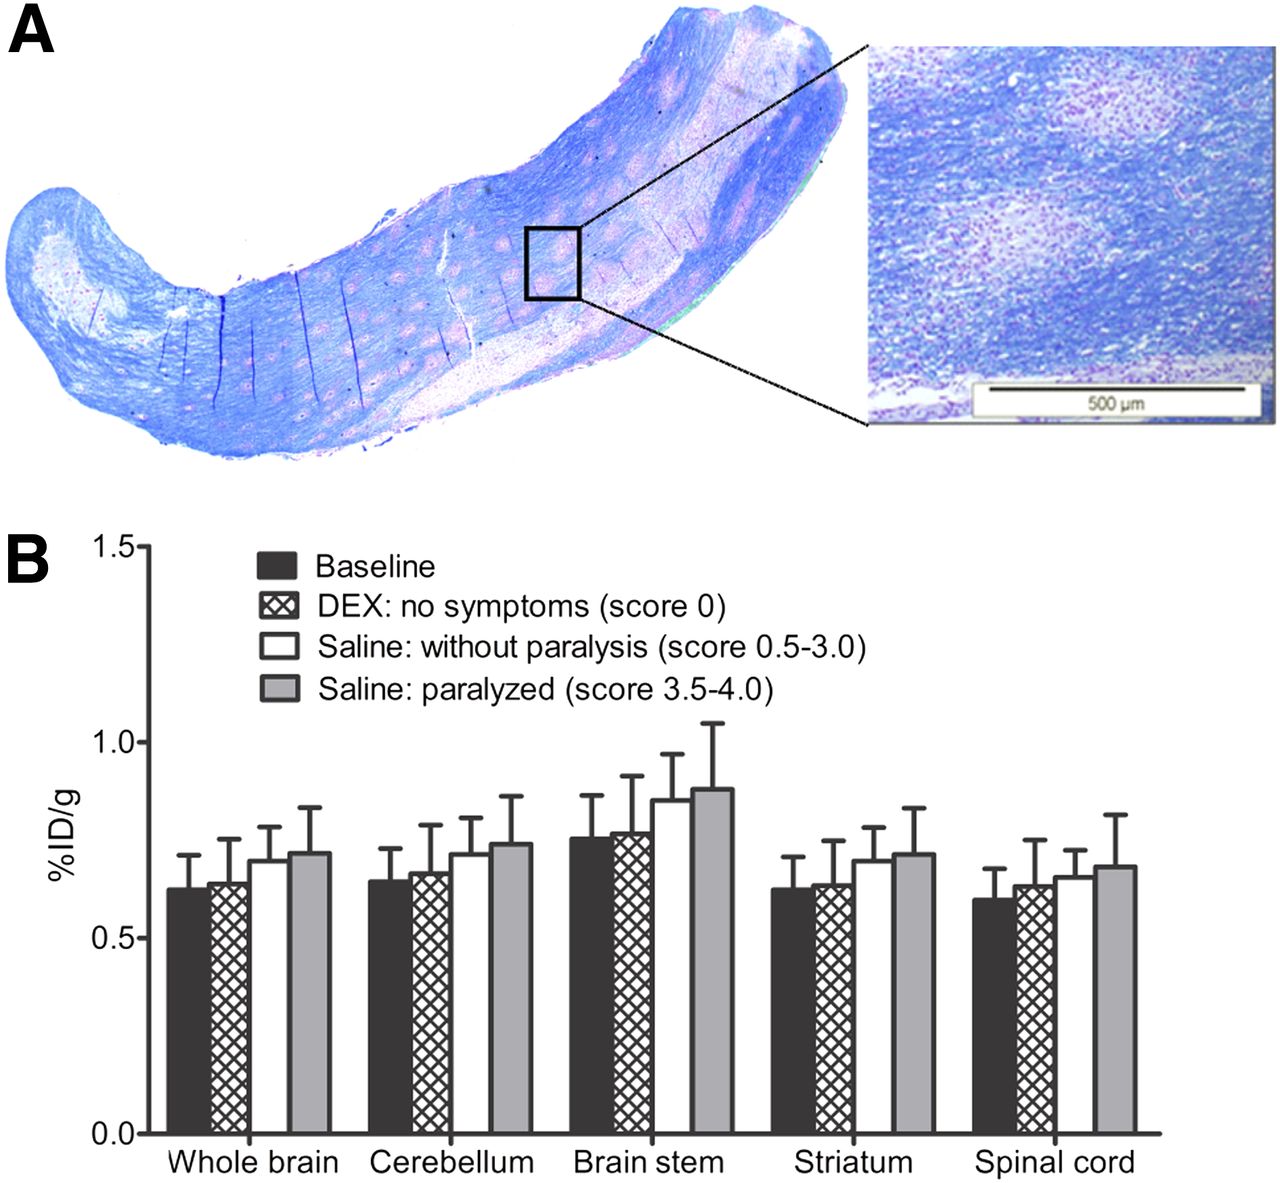
When saline-treated EAE rats were categorized according to disease score, the factor disease score had a significant effect on 11C-PK11195 uptake (F2,18 = 27.93, P < 0.001) in the brain stem and spinal cord of animals without paralysis (score, 0.5–3.0) (+26% and +24%, respectively) and paralyzed animals (score, 3.5–4.0) (+70% and +66%, respectively), as compared with animals without symptoms (score, 0). In the dexamethasone-treated group, the effect of the factor disease score on 11C-PK1195 uptake was also statistically significant (F1,14 = 28.57, P < 0.001). Comparing dexamethasone-treated animals that had never presented any symptoms with animals that presented symptoms at an earlier time during the study (symptoms had resolved at the time of the scan), significantly increased 11C-PK11195 uptake was observed in the brain stem (+26%, P < 0.01) and spinal cord (+22%, P < 0.001). These results suggest that 11C-PK11195 can be used to detect neuroinflammation even when clinical symptoms of the disease are no longer present.
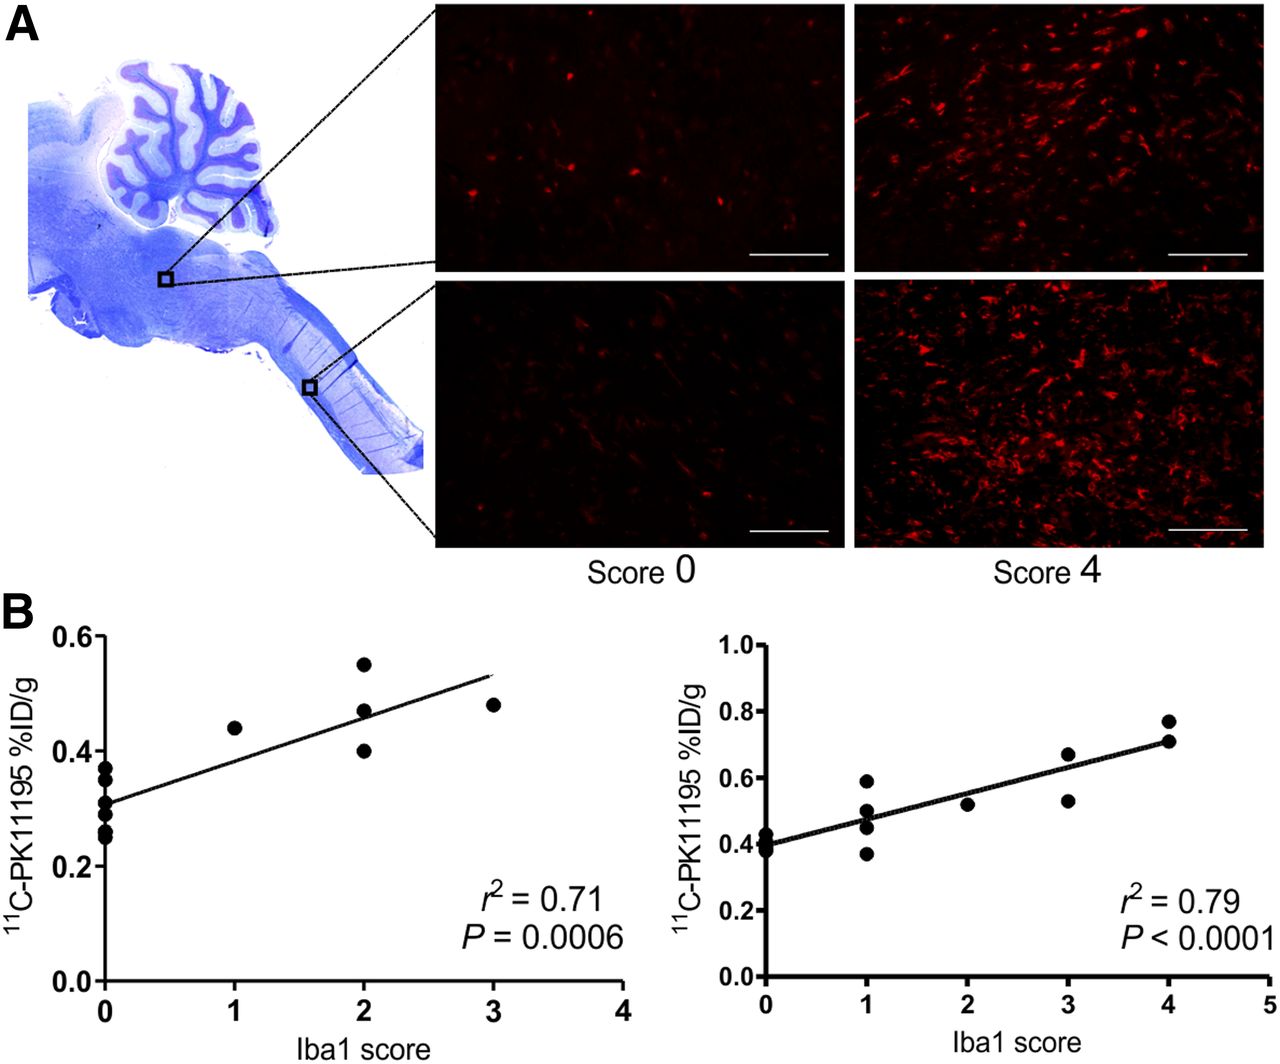
PET data were confirmed using Iba1 immunohistochemistry (Fig. 4). Strong correlations were observed between 11C-PK11195 uptake in the spinal cord (r2 = 0.79) and brain stem (r2 = 0.71) and semiquantitative Iba1 staining scores for the extent of microglia activation and monocyte invasion.

(A) Section of brain stem and spinal cord stained with Luxol fast blue (top left) illustrates origin of Iba1 immunohistochemistry images of microglia activation (high magnification) in saline-treated EAE rats without symptoms (left) or presenting paralysis (right). Scale bar = 100 μm. (B) Correlation of Iba1 staining with 11C-PK11195 uptake in brain stem (left) and spinal cord (right) on day of euthanization.
Demyelination
11C-MeDAS PET did not detect any significant demyelination during disease progression in EAE rats (Fig. 5). Nor were significant differences found in 11C-MeDAS uptake when animals were grouped according to disease score (Fig. 6). In contrast, Luxol fast blue histochemistry did show small lesions (diameter, 0.13 ± 0.06 mm) in the spinal cord and brain stem of saline-treated EAE rats (Fig. 6).

(A) Illustration of 11C-MeDAS PET images at different stages of EAE progression in saline-treated EAE group. Solid arrows indicate brain; dashed arrows indicate spinal cord in sagittal view. (B) 11C-MeDAS uptake at different time points after immunization in saline group (left) and in dexamethasone (DEX) group (right). No significant differences compared with baseline were found at any time point (n = 6 for first 3 time points and n = 4 for last 2 time points).
(A) Illustration of small size of demyelinated lesions in spinal cord using Luxol fast blue stain. (B) 11C-MeDAS uptake classified according to disease score on day of imaging. No significant differences were found. DEX = dexamethasone.
DISCUSSION
The EAE rat is an adequate model for relapsing and remitting MS because that model is characterized by periods of relapse and remission of the clinical symptoms in response to waves of infiltrating inflammatory cells. Literature data (24) and yet unpublished studies from our groups have shown that the first neurologic symptoms are usually observed at day 8 or 9 after immunization, with the first peak of symptoms at day 11 or 12, remission at day 15 or 17, and the beginning of the relapse at day 18 after immunization. In our study, a longer period of clinical symptoms and a shorter period of remission were observed; the first peak of symptoms occurred at day 15 and the remission phase at day 16 or 17 after immunization. As a result, maximum disease scores (3.5 ± 1.3) were higher than those previously published (2.4 ± 0.1) (24). Also, the incidence of death was relatively high, which led to a decrease in group size from 6 to 4 animals for the last two time points (days 15 and 19 after immunization). The use of repetitive anesthesia may possibly have affected the disease progression. The premature death of very sick animals after the first peak in disease symptoms could have contributed to the observed reduction in the average disease score during the remission phase. However, objective remission in individual animals was observed as well; some paralyzed animals significantly recovered in the remission phase, showing almost normal motor function. Unfortunately, the intent to image animals during the remission phase was compromised by the altered disease progression. Furthermore, dexamethasone treatment of EAE rats caused an additional loss in body weight (∼10% more), as was also observed in other studies (2,27).
In this study, we showed that 11C-PK11195 uptake corresponded well with the disease scores in saline-treated EAE rats. In particular, 11C-PK11195 uptake in the brain stem and spinal cord was increased during EAE disease progression. The presence of activated microglia in these regions was confirmed by immunohistochemistry and is in agreement with previous findings by Storch et al. (28).
Dexamethasone treatment was started at disease onset (day 8) and prevented clinical symptoms in 50% of the animals. Animals that did not show any clinical symptoms also did not show any increase in 11C-PK11195 uptake, which suggests that the dexamethasone treatment could prevent the autoinflammatory response in some of the animals. Glucocorticoids were shown to moderate the initial inflammatory response and decrease leukocyte infiltration at the inflammation site (29). Glucocorticoids induce apoptosis of peripheral lymphocytes (30) and thus prevent the infiltration of T cells into the CNS and subsequent neuroinflammation.
The other 50% of the dexamethasone-treated animals presented only mild symptoms that had resolved at the time of imaging. These animals never became paralyzed. Interestingly, 11C-PK11195 uptake in these animals was similar to that in the saline-treated EAE rats, with a score of 0.5–3.0 (no paralysis). In both groups, the same CNS regions (brain stem and spinal cord) were affected. Apparently, dexamethasone treatment was started too late to inhibit T-cell infiltration in half of the animals, but treatment was still able to reduce the inflammatory response in this group.
Our results show the ability of 11C-PK11195 PET to reveal temporal inflammatory changes during disease progression and treatment. PET is clearly more sensitive than clinical evaluation for detecting changes in disease status because PET detected neuroinflammation even in animals undergoing dexamethasone treatment that no longer presented symptoms at the time of imaging. Therefore, 11C-PK11195 PET may be an important imaging tool not only for monitoring disease progression and drug efficacy in a clinical setting but also for facilitating drug development.
Demyelination is another important hallmark of MS that we evaluated using 11C-MeDAS PET. No changes in myelin content were observed during disease progression in this study. Our results differ from the recently published study by Wu et al. (11), who detected loss of myelin in the spinal cord of EAE rats. However, Wu et al. found significant demyelination in the bottom portion of the thoracic spinal cord, which was not included in the PET images in our study because of the dimensions of the field of view of our PET camera. Luxol fast blue histochemistry detected demyelinated lesions in the brain stem and upper spinal cord of saline-treated EAE rats in our study, but the lesions were too small (average diameter, 0.13 mm) to be detected by our PET camera, which has a resolution of approximately 1.4 mm. Therefore, we cannot conclude that 11C-MeDAS PET is unable to detect demyelinated lesions. We can only speculate that technical limitations were the reason for our inability to detect the lesions. In our study, it was not possible to wait until the lesions had grown large enough for detection by 11C-MeDAS PET because in this EAE model the animals died on approximately day 20 after immunization due to disease progression. To overcome this limitation, the study should be repeated in an animal model with larger lesions, such as a nonhuman primate model or the rat model reported by Wu et al.
CONCLUSION
Disease progression and the therapeutic effects of dexamethasone on microglia activation and monocyte invasion in the EAE rat model for MS could be longitudinally monitored with 11C-PK11195 PET. Using this tool, we could still detect activated microglia and monocytes in the brain stem and spinal cord of dexamethasone-treated EAE rats even when clinical symptoms were no longer present. These findings suggest that PET can detect even subtle changes in disease status. Changes in myelin content during disease progression could not be detected using 11C-MeDAS PET, probably because the resolution of the PET camera was insufficient to detect the small lesions.
DISCLOSURE
The costs of publication of this article were defrayed in part by the payment of page charges. Therefore, and solely to indicate this fact, this article is hereby marked “advertisement” in accordance with 18 USC section 1734. This work was partially funded by a grant from the Dutch Ministry of Economic Affairs and a CAPES special visiting researcher fellowship. No potential conflict of interest relevant to this article was reported.
Acknowledgments
We thank Lex Nagelkerken for the scientific discussions.
Footnotes
Published online Jun. 9, 2014.
- © 2014 by the Society of Nuclear Medicine and Molecular Imaging, Inc.
REFERENCES
- Received for publication January 24, 2014.
- Accepted for publication April 17, 2014.


