


Abstract
We present a preliminary cost analysis of a combination intervention using PET and comprehensive lifestyle modification to reverse atherosclerosis. With a sensitivity of 92%–95% and specificity of 85%–95%, PET is an essential tool for high-precision diagnosis of coronary artery disease, accurately guiding optimal treatment for both symptomatic and asymptomatic patients. PET imaging provides a powerful visual and educational aid for helping patients identify and adopt appropriate treatments. However, little is known about the operational cost of using the technology for this purpose. Methods: The analysis was done in the context of the Century Health Study for Cardiovascular Medicine (Century Trial), a 1,300-patient, randomized study combining PET imaging with lifestyle changes. Our methodology included a microcosting and time study focusing on estimating average direct and indirect costs. Results: The total cost of the Century Trial in present-value terms is $9.2 million, which is equal to $7,058 per patient. Sensitivity analysis indicates that the present value of total costs is likely to range between $8.8 and $9.7 million, which is equivalent to $6,655–$7,606 per patient. Conclusion: The clinical relevance of the Century Trial is significant since it is, to our knowledge, the first randomized controlled trial to combine high-precision imaging with lifestyle strategies. The Century Trial is in its second year of a 5-y protocol, and we present preliminary findings. The results of this cost study, however, provide policy makers with an early estimate of the costs of implementing, at large scale, a combined intervention such as the Century Trial. Further, we believe that imaging-guided lifestyle management may have considerable potential for improving outcomes and reducing health-care costs by eliminating unnecessary invasive procedures.
- costs of cardiovascular disease management
- lifestyle modification strategy
- reversal of atherosclerosis
Coronary artery disease (CAD) remains a leading cause of death in the United States and is one of the most expensive conditions to treat. In 2008 the age-adjusted CAD death rate was 149 (per 100,000 population), accounting for 1 in every 6 deaths in the United States (1). In 2010, CAD-related direct medical costs were almost $36 billion, and these costs are expected to nearly triple by 2030 to $106 billion (2). An alternative to the current standard of care is considered in the Century Health Study for Cardiovascular Medicine (Century Trial), a patient-directed lifestyle modification strategy for control and reversal of atherosclerosis. Different from other behavioral interventions, the Century Trial uses PET imaging to guide treatment and motivate patients with preclinical or established CAD.
The Century Trial includes patients of both sexes over the age of 40 y recruited from the Houston, Texas, metropolitan area. Patients are selected according to specific clinical criteria such as having risk factors for CAD (e.g., diabetes, history of cigarette smoking, or hypertension), a family history of premature CAD, an indication of atherosclerotic carotid artery disease, or documented known CAD. Once enrolled, patients are randomized to either the intervention or the control group. In the intervention group, patients follow their primary provider’s program of care and receive additional treatment aimed at modifying atherosclerotic risk factors. This complementary treatment includes diet modification, smoking cessation, prescription of commercially available lipid-lowering drugs, and a program of aerobic exercise. In comparison, patients in the control group follow their primary provider’s program of care, which is assumed to represent standard medical care for CAD, and receive no additional treatment. The primary endpoint of the Century Trial is the modification of average cardiovascular risk scores for a 5-y follow-up period, and the secondary endpoints are major cardiovascular clinical events of death, nonfatal myocardial infarction, and revascularization procedures. Another outcome measure is the economic evaluation of medical resource use and quality of life for the estimation of a comparative effectiveness analysis.
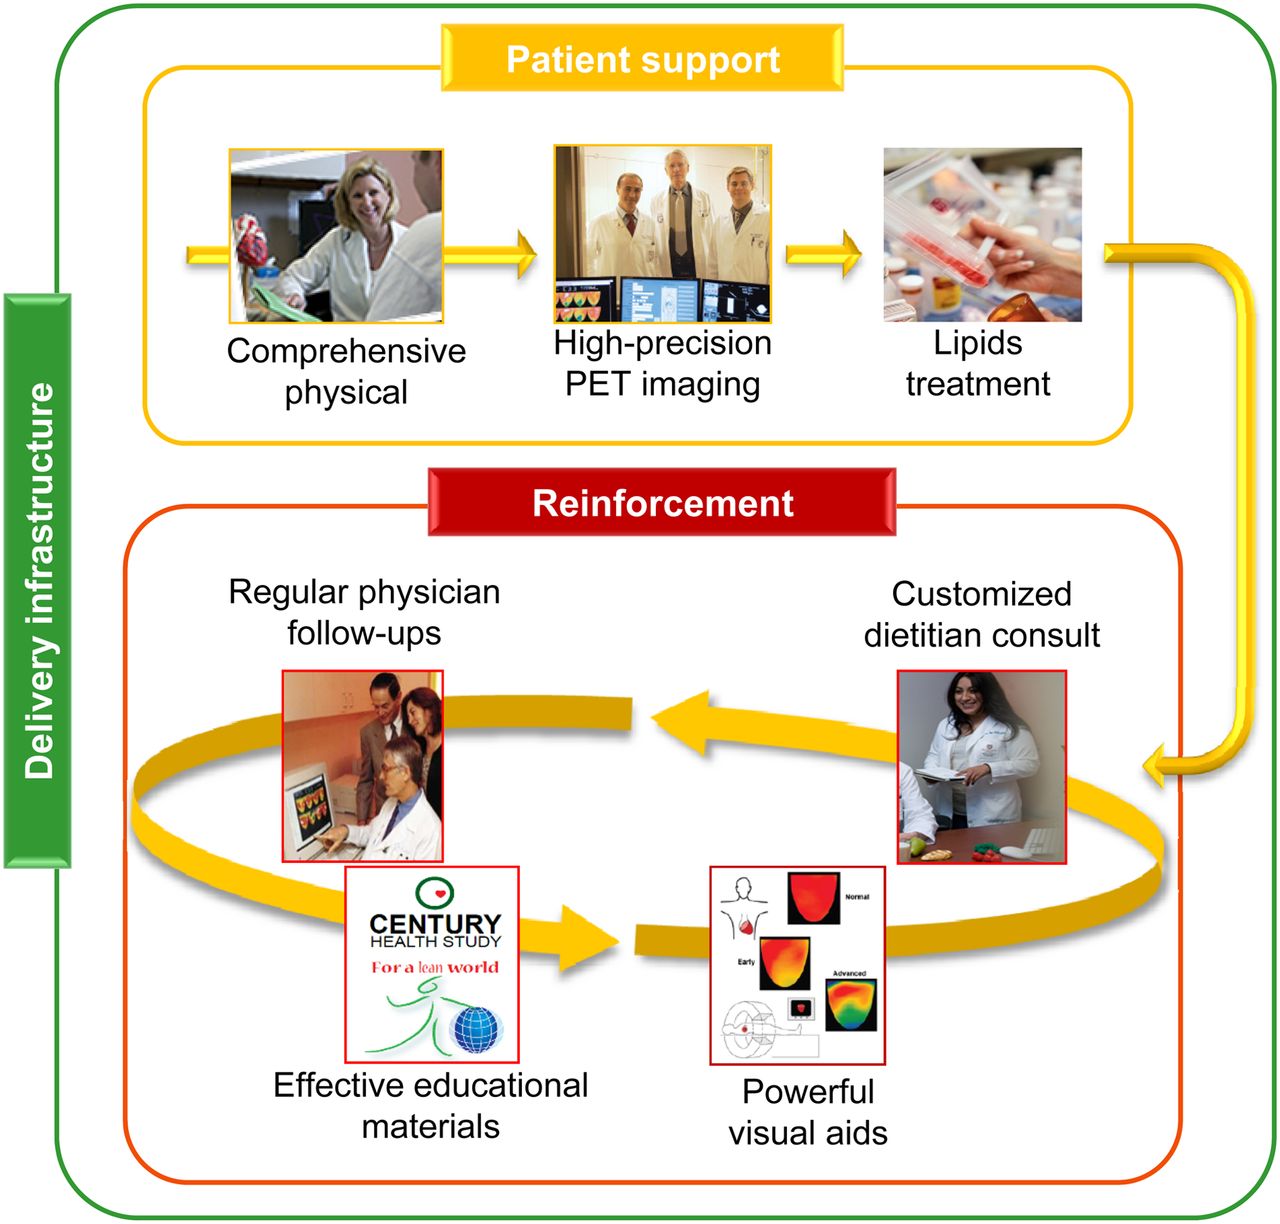
The pathway followed by patients enrolled in the intervention group of the Century Trial is illustrated in Figure 1, and the general treatment approaches in the intervention are summarized in Figure 2. There are 3 broad components in this intervention. The first, delivery infrastructure, represents the clinical, technical, and facility resources designed for providing the patient easy access, a comfortable environment, and a medical care team specialized in cardiology and trained in motivational approaches. The second component, patient support, includes strategies for patient treatment and engagement characterized by detailed patient examinations, precision imaging, and selection and adjustment of lipid-lowering medication. The last component, reinforcement, encompasses activities aimed at securing protocol adherence through a regular program of physician visits and diet consults and the use of educational materials and visual aids that allow patients to monitor progress.

Care pathway in Century Trial intervention.
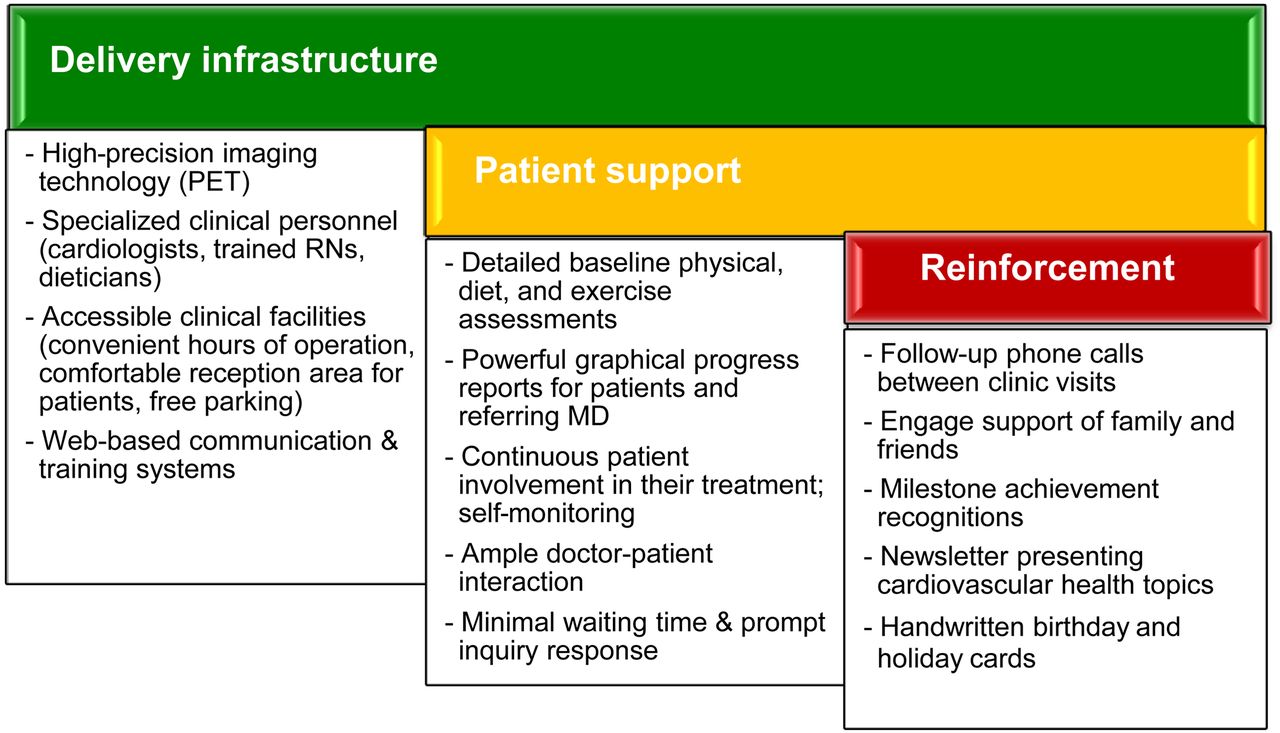
General approaches followed in Century Trial.
After undergoing randomization and a comprehensive physical, patients in both study groups receive a PET scan. The use of PET in the trial is critical, not only to determine baseline clinical conditions for both study groups but to provide precise treatment guidance and monitoring of progress for those patients assigned to the intervention arm. PET provides the diagnostic power that gives the Century Trial its value as a potential tool for reducing health-care costs. In a study by Demer et al. (3), PET showed a sensitivity of 95% and specificity of 95% for identifying significant coronary artery stenosis. Likewise, in a meta-analysis, sensitivity was 92% and specificity 85% (4). The resulting detailed risk stratification and optimal selection of mechanical revascularization serves as a foundation for subsequent customized lipid-lowering treatments, as well as diet, exercise, and educational programs. Consequently, the precision in examinations not only allows patients the possibility of eliminating unnecessary and expensive invasive procedures but gives them an opportunity to monitor progress through powerful imaging and a wide range of health progress metrics. For example, the risk factors targeted by the Century Trial include smoking, total dietary fat, cholesterol, triglycerides, physical activity, body mass index, blood pressure, and diabetes.
Studies have shown the potential of using various imaging technologies to monitor stabilization or regression of treated coronary atherosclerosis (5–8). Also, experimental strategies based on diet changes (9–11), exercise (12–15), or a combination of a very low fat diet and exercise (16) have demonstrated significant reductions in morbidity and mortality. Further, Sdringola et al. have shown how therapies combining drugs to target lipid levels, regular aerobic exercise, and a diet having a very low fat content can reduce relative risk by up to 67% for cardiovascular events in a nonrandomized observational study (17).
In this paper we present the preliminary results of a cost analysis of the Century Trial to document the resources invested in this intervention and provide health-care managers a detailed benchmark for similar interventions. We present data related to the intervention and the control groups. This latter is considered to represent current standard of care. The literature presents several cost analyses of lifestyle modification interventions (Raynor et al. (18)), but most involved obesity treatments. There are fewer cost studies involving PET, and their focus is on the diagnostic function. Gould et al. (19), for example, reported cost and breakeven points for PET with respect to thallium-based diagnostics and concluded that PET imaging is more effective given its higher degree of sensitivity and specificity. Berger et al. completed a survey-based study on the cost of PET with 18F-FDG at various academic and U.S. Veterans Affairs hospitals concluding that the mean cost per scan ranged from $1,885 to $1,898 depending on whether the 18F-FDG was manufactured on-site or purchased (20). Similarly, Merhige et al. used a global charge of $1,850 to estimate the economic benefits of PET myocardial perfusion imaging over SPECT myocardial perfusion imaging (21). To our knowledge, no studies have presented a cost analysis of a lifestyle modification strategy involving PET.
MATERIALS AND METHODS
Our goal was to estimate the cost of the Century Trial, a 1,300-patient randomized intervention for treating heart disease. The cost analysis was done from the provider perspective and used microcosting methods. The study was based at the Weatherhead PET Imaging Center of the University of Texas Medical School at Houston, Texas. An internal review board approved the trial, and all subjects gave written consent. Personnel cost was based on a time study of selected patients who were “shadowed” during baseline and annual follow-up visits. The patient sample was of convenience since observation sessions were arranged around scheduled visits. The analysis took place over a 10-mo period in order to analyze participants at different stages of progression in the Century Trial treatment program. During informal meetings, doctors, nurses, technicians, and dietitians were queried about time spent before and after each patient visit. We created groups of related procedures sequenced according to the normal care pathway followed by patients during each visit. In Table 1, the first column indicates the procedure groups, and the resource column lists corresponding clinical personnel involved. The third column presents specific procedure definitions. A typical patient visit begins with nurse’s assessment, followed by PET scan, treadmill, and diet consult, and concludes with a physician consult. The cost model accounted for annual variations in procedures. For example, during the 5-y plan, patients receive a PET stress evaluation only at baseline and follow-up visits at the second and fifth year after enrollment in the trial.
Resources and Procedures Involved in Representative Patient Visit
We classified costs as variable or fixed depending on whether they changed with varying levels of the cost driver: number of patients in the trial. Following the common definitions recommended in cost accounting approaches (22), we considered the assumptions of linear costs, a time span of 5 y, and number of patient visits with a relevant range of 0–1,300 patients. Also, in estimating total costs of the intervention we assumed all patients were enrolled at the same time and a drop-out rate with replacement of 10% for the duration of the 5-y intervention. This assumption was not confirmed by the data. Projections of future cost were discounted to present value using a 3.5% per year discount rate, which is a rate commonly used in health economic studies (23). However, this discount rate can be adjusted to represent an organization’s opportunity cost of capital. No estimates of inflation were included in modeling future costs under the assumption that the 3.5% discount rate was equivalent to a real rate of return (i.e., real opportunity cost of capital). This premise is appropriate since the literature indicates the rate is made up of 2 components, 1.5% that considers risk-adjusted time preference plus 2% that accounts for future income increase (24). A nominal rate of return, compared with a real rate of return, factors a component for inflation. In accepted financial economic approaches, present-value estimation must involve real future cash outlays—which do not include estimates of inflation—discounted at a real rate (25). Projecting future changes in price levels, particularly in the health-care sector, is complicated, and many multiyear clinical trials apply several approaches to avoid estimates of inflation (24). Consequently, future cost projections were based on 2012 dollars.
Variable-Cost Estimation
To obtain estimates of variable costs per patient, a productivity factor of 85% was used in obtaining hourly salary rates following the method of Lairson et al. (26). Personnel costs included salaries and benefits per full-time equivalent for clinicians, dietitians, and nuclear technicians. Supplies included all reagents, drugs, and nuclear tracers and represent prices paid by the Century Trial. These estimates assumed the use of 82Rb tracer for PET. Given that the cost analysis was done from the provider perspective, the cost of lipid-lowering drugs prescribed by the Century Trial team was not included assuming that these costs were the responsibility of participating patients or their health insurance provider.
Fixed-Cost Estimation
Fixed costs covered 6 broad categories: salaries for administrative and support personnel such as finance, information technology, and patient recruitment; operations and maintenance of imaging equipment; promotional materials used in the recruitment and enrollment of patients; office supplies including specialized software used to track patient diet patterns; educational materials such as brochures and food models used during patient consults; utilities and floor space such as examination rooms, reception areas, and office space; and amortization. Salaries and benefits were calculated using secondary data on compensation and estimates of time involvement in the Century Trial for related positions. Data on maintenance and operations costs, as well as office supplies, were obtained from historical financial records. Because we lacked specific data on costs related to floor space and utilities, this line item was estimated assuming 20% of all fixed costs excluding amortization. Lastly, amortization involved only the PET equipment and was calculated assuming a 10-y useful life, a residual value of $200,000, and annual interest of 3%, which is representative of current financial rates. Because the Weatherhead PET Center also treats patients not involved in the Century Trial, a rate of 65% was used to allocate costs of maintenance and amortization of the imaging equipment to the intervention. This rate represents the proportion of Weatherhead patients participating in the Century Trial.
Uncertainty Modeling
An initial point estimate of total costs for the entire intervention was obtained assuming a 3.5% discount rate for future costs and a level of 1,300 patients per year. This patient level approximates 6 patients per day assuming 48 wk per year and 85% efficiency. A 2-way sensitivity analysis was completed that varied annual discount rate between 2.5% and 4.5% and daily patient-throughput levels between 1,200 and 1,400 patients per year, which is the equivalent of 6–7 patients per day. These patient-throughput levels are similar to the 8 visits per day reported by Gould et al. (19). Given that this is a preliminary study, we opted to limit our sensitivity analysis to include only a relevant cost driver (patient throughput) and a significant factor in present-value estimation (the discount rate).
RESULTS
The Century Trial team includes cardiologists, registered nurses, nuclear technicians, research assistants, and program management personnel. In terms of full-time-equivalent personnel, 7 full-time equivalents are involved directly in patient care, 3 are involved in patient recruitment and coordination, and 2 participate in operational functions such as finance, information technology, and program management. The facilities include a patient reception area, 2 patient rooms, 2 PET machines, and office space.
Costs of Direct Patient Support
Table 2 shows results from the time study and illustrates average direct, or face-to-face, time invested by each clinical resource in each procedure group and by patient visit type for the intervention and control arms. The column “all visits” for the intervention group in the table shows accumulated total time for the 14 visits (1 baseline visit, 3 follow-up visits at the second, fourth, and eighth months after enrollment in the study, 5 semiannual visits, and 5 annual follow-up visits). As expected, baseline visits are the longest, covering almost 5 h. Follow-up visits for years 2 and 5 average 3.82 h, whereas follow-up visits for years 1, 3, and 4 average 2.33 h. The other types of visits take an average of 1 h. The difference in time is partly due to the absence of a PET scan and variances in time allocated for the physician and diet consults. On average, patients spent about 33% more time in physician consults in years 2 and 5 than in years 1, 3, and 4. The numbers for the diet consult (Table 2) include a 9% increment from the original time readings to account for average time spent by dietitians answering patient questions via phone or email, producing educational materials, or updating patient diet records. This percentage was calculated from interviews with dietitians.
Average Hours of Resource Time Spent per Patient Visit Type (n = 12 Patient Visits)
In aggregate terms, the time each resource devoted to face-to-face patient interaction was considerable. Each patient in the intervention group received 10.2 h of registered nurse time, 3.7 h of nuclear technician time, 6.5 h of physician consult time, and 7.7 h of dietitian consult time. Overall, each patient received more than 28 h of direct support. In comparison, patients in the control group received 15 h of face-to-face interaction mostly involving assessment procedures. The times shown for the “diet consult” and “physician consult” categories in Table 2 involved mostly assessment of a patient’s progress.
The time estimates from Table 2 were used to calculate the variable cost of clinical personnel time for both patient groups as presented in Table 3. Cost per hour for each position was based on average loaded salaries, which include benefits, at the Texas Medical Center in Houston. This approach was considered appropriate since it was likely to result in robust estimates of compensation. The direct cost per visit type ranged from $84 for the monthly and semiannual follow-up visits to $385 for the baseline visit. The total direct cost per patient in the intervention group amounted to $2,190.
Estimates of Direct Resource Time and Personnel Time Cost per Patient Visit Type and for All Visits
Patients randomized to the control group received considerably fewer direct resources. Including baseline assessment resources, this group had about a $1,100 direct-time cost per patient for the entire duration of the trial. Diet and physician consult time account for the main difference between the 2 patient groups, and the nurse assessment and PET scan procedures act as fixed components of resource time found in both trial arms.
Total Costs
Table 4 provides the summary cost line items projected over the 5 y a patient is expected to be enrolled in the Century Trial. These total cost estimates assume 1,300 enrolled patients with random assignment of 650 to the intervention group and 650 to the control group.
Five-Year Total Cost Estimates, Assuming 1,300 Patients per Year Divided into 2 Study Groups
The variable-cost line item “operation expenses” represents materials related to the PET scanner. The estimate was based on costs per patient derived indirectly from annual accounting records. This approach proved to be more reliable than trying to quantify medical and tracer material use for each patient visit. These estimates reflect the costs of obtaining the PET tracer from a provider and the use of an automated infusion system. Unless noted in Table 4, fixed costs were estimated indirectly.
As seen in Table 4, variable costs at baseline represent 52% of total costs, with direct clinical personnel time amounting to 24% of total costs. Fixed costs represent 48% of total costs, with equipment amortization being 12% of total costs. Fixed salary costs were 19% of the total, with a considerable proportion of these resources devoted to patient recruitment. Variable costs were partitioned between the intervention and control groups for 2 reasons: first, to illustrate differences between the 2 patient groups in overall terms and, second, to model outlays related to monthly and biannual visits in the intervention group.
Total annual costs at baseline are $2.1 million and vary between $1.4 and $2.0 million during the subsequent 5 y. It is clear that total cost differences result from changes in the annual number of PET assessments. The aggregate discounted value of future costs is $9.2 million dollars, or approximately $7,058 per patient.
Assuming a scenario in which all Century Trial resources were devoted to providing care to the 1,300 patients following the protocol in the intervention group, the discounted total cost would amount to $9.9 million and the discounted cost per patient would amount to $7,595. The literature does not provide cost estimates on the current standard of care for established or preclinical CAD, but our estimates indicate a total cost of $4,600 per patient, or the equivalent of 60% of the cost per patient in the Century Trial. This estimate was obtained considering the discounted cost of hypothetical office visits to a cardiologist every 6 mo for a period of 5 y, including 3 SPECT scans (at baseline and for years 2 and 5). The assumptions included costs of $774 per SPECT scan as reported by Min et al. (27) and a $502.51 physician fee for those sessions involving a SPECT scan and $140 for other follow-up visits as listed on the 2012 Medicare physician fee schedules (28).
Sensitivity Analysis
Table 5 shows the results of the sensitivity analysis in terms of present-value costs. Varying both the number of patients in the intervention and the discount rate, the total cost of the intervention ranged between $8.8 and $9.7 million. As the total number of patients increases, total costs for the intervention increase; however, total costs per patient are expected to decrease as average fixed costs per patient decline. In addition, as seen in Table 5 the present value of costs increases as the discount rate declines (and vice versa).
Discounted Total and Per-Patient Costs for Varying Patient Numbers and Discount Rates
DISCUSSION
Currently, there are nearly 600 patients enrolled in the Century Trial, and the results of the cost analysis presented here should be considered preliminary. Cost data collection will continue, and final results will be provided after the completion of the protocol with the planned 1,300 participating patients. Also, these cost data are from an academic research environment and may be different from those in a for-profit organization. Unfortunately, estimates of the cost of a full-fledged program modeled after the Century Trial were not available for comparison with the academic scenario. Because our patient sample was a sample of convenience, there are potential issues of external validity. Decision makers need to consider this when extrapolating our findings to local situations. The literature provides limited evidence on the level of resource investments needed to operate lifestyle modification strategies, and our findings provide detail on the cost structure of this promising intervention. The Century Trial is of considerable clinical relevance because it is the first randomized trial to focus on precise risk stratification through the use of noninvasive cardiac imaging with subsequent comprehensive patient-specific reinforcement to maximize adherence. The findings presented here, however, are one dimension of a cost-effectiveness analysis of the Century Trial, as discussed in previous publications (29). An objective assessment of outcome, or measure of patient benefit, remains to be completed. Such an assessment, combined with final cost estimates, provides the basis for a cost-effectiveness analysis. This approach should also help identify any possible negative effects of the intervention, which are not considered in an operational cost study.
A major determinant of total unit cost in the Century Trial is of course the number of patients involved in the treatment. However, as fixed costs are spread among an increasing number of patients, cost per patient in the intervention will continue to decrease to the point at which the infrastructure’s capacity becomes a significant restrictive factor. After this threshold, costs per patient could start increasing. Another important factor for estimating the present value of costs is the discount rate. Low rates—close to zero or even negative—translate into higher present costs, whereas the use of higher discount rates results in lower present costs. Deciding which rate is best is always a challenging and controversial exercise for health-care planners. Several assumptions were made regarding overhead for which the use of direct measurement methods was inapplicable. One example is floor space cost, which is normally considered at the institutional level and for which detail at the departmental level can only be estimated by extrapolation.
There are several opportunities for further research based on our early intervention cost estimates. First, estimates on long-term costs and health outcomes should provide an objective quantification of the economic contributions of the Century Trial with respect to current optimal standard of care. Second, given the power that PET provides for selecting medical versus invasive management, it is possible to obtain economic projections on the feasibility of a regional Century-type intervention measuring potential cost savings from unnecessary surgeries. This implies a societal perspective that includes costs to patients, providers, and governmental institutions.
CONCLUSION
This study provides preliminary cost estimates for the Century Trial, a randomized controlled trial to combine high-precision imaging with lifestyle modification strategies. The results of this cost study offer policy makers early estimates of the costs of implementing a large-scale combined intervention such as the Century Trial. We believe that imaging-guided lifestyle management may have considerable potential for improving outcomes and reducing health-care costs by minimizing the number of invasive procedures.
DISCLOSURE
The costs of publication of this article were defrayed in part by the payment of page charges. Therefore, and solely to indicate this fact, this article is hereby marked “advertisement” in accordance with 18 USC section 1734. No potential conflict of interest relevant to this article was reported.
Footnotes
Published online Dec. 12, 2013.
- © 2014 by the Society of Nuclear Medicine and Molecular Imaging, Inc.
REFERENCES
- Received for publication January 11, 2013.
- Accepted for publication August 8, 2013.


Jump to section
Related Articles
Cited By...
- No citing articles found.