


Abstract
Assessing the skeletal response to enzyme replacement therapy (ERT) in Gaucher disease (GD) is problematic. We investigated the reliability of 99mTc-sestamibi scintigraphy in monitoring changes in bone marrow involvement induced by ERT. Methods: In 52 GD patients, the efficacy of ERT on bone marrow disease was monitored using at least 2 sequential 99mTc-sestamibi scans; 17 patients were receiving ERT at enrollment, and 35 were ERT-naïve. We elaborated a dose–response model by statistical analysis based on linear mixed models. Results: Patients whose marrow disease improved had received a significantly higher ERT dose per month than patients who did not improve. Significantly more patients reached near-disappearance of marrow disease if their disease burden at enrollment had been lower and the duration of clinical signs shorter. The response of the marrow scintigraphic score was more pronounced in ERT-naïve patients. No relevant effect of ERT on marrow disease was observed until platelet count and splenomegaly had improved. Conclusion: Although based on localized evaluation, changes in the 99mTc-sestamibi score closely correlated with the main determinants of ERT, with a definite dose–response relationship. The threshold at which ERT induced any improvement in bone marrow disease was 35–36 U/kg/mo; in ERT-naïve patients, the scintigraphic score declined by 1 unit after ERT at 28 U/kg/mo.
More than 50 genetic diseases caused by absence or impaired function of specific lysosomal hydrolytic enzymes have been described (lysosomal storage disorders). These chronic progressive conditions have a cumulative incidence of about 1:2,315–1:7,700 births (1) and require significant health care resources. Established treatments for lysosomal storage disorders include bone marrow transplantation, enzyme replacement therapy (ERT), and small molecules for substrate deprivation (2). Although ERT is available for Gaucher disease (GD); Fabry disease; mucopolysaccaridosis types I, II, and VI; and Pompe disease (2), debate is ongoing on how to tailor to individual patients the quantity of exogenous enzyme to be administered (3), especially in view of the recent worldwide shortage of exogenous enzyme for ERT in GD patients (4).
GD, the most prevalent lysosomal storage disorder, is due to a deficiency in glucocerebrosidase, an enzyme that hydrolyzes glucosylceramide to glucose and ceramide (5). The availability of ERT (6,7) has dramatically changed the natural history of GD, whose main manifestations are caused by an accumulation of glucosylceramide in reticuloendothelial cells of the liver, spleen, and bone marrow; skeletal disease is consequent to bone marrow disease. Development and progression of clinical manifestations of GD are multifactorial, with wide variability in patients with similar reductions in glucocerebrosidase activity (8).
Because the response to ERT in GD patients varies among the different organs and sites involved, monitoring the efficacy of ERT is still an elusive problem (9). Although ERT rapidly reverses anemia, thrombocytopenia, and hepatosplenomegaly (10), skeletal responses occur more slowly (11) and can be limited when ERT is delayed beyond a point of irreversible changes (12).
Although the efficacy of ERT on anemia and thrombocytopenia is easily monitored, and changes in liver and spleen size can be assessed with MR imaging or ultrasound, monitoring the efficacy of ERT on bone marrow disease and the consequent skeletal manifestations of GD is more problematic (13). Data from the International Collaborative Gaucher Group Gaucher Registry indicate that improvement in bone mineral density may take as long as 8 y to reach near-normal values after high-dose ERT (14).
Skeletal changes caused by infiltration of the bone marrow by Gaucher cells can be detected on plain radiographs when they produce characteristic abnormalities (15). Assessment and monitoring of milder bone marrow involvement require more sophisticated imaging techniques, such as MR imaging (15–21), bone marrow scintigraphy with radiocolloids (22), and scintigraphy with 133Xe (23,24) or 99mTc-sestamibi (25,26). Although the mechanism of accumulation of 133Xe and 99mTc-sestamibi in bone marrow infiltrated by Gaucher cells has not been elucidated (as it might reflect either accumulation of glucosylceramide per se or bone marrow expansion due to the disease), distribution of 99mTc-sestamibi in the marrow, liver, and spleen of GD patients closely mimics the pattern observed with radioiodinated alglucerase (27), the recombinant glucocerebrosidase form that targets Gaucher cells. Although radioiodinated alglucerase (the only potential imaging agent specific for Gaucher cells) is not commercially available, 99mTc-sestamibi is readily available worldwide. Because of nonspecific accumulation and excretion in the abdominal area, only peripheral bone marrow involvement can be evaluated with 99mTc-sestamibi. A semiquantitative 99mTc-sestamibi scintigraphic score developed to assess bone marrow disease in GD patients closely reflects the severity of secondary skeletal involvement and the overall involvement of organs and tissues as estimated by a combined severity score index (SSI) (28) and by biochemical markers (25). In this study, we evaluated the potential of 99mTc-sestamibi scintigraphy in monitoring the efficacy of ERT on bone marrow disease in GD patients.
MATERIALS AND METHODS
Patients
Fifty-two GD patients were enrolled for this longitudinal, observational, retrospective study approved by Ethics Committees of the Universities of Genoa (for patients enrolled between 1995 and 2001) and Pisa (for patients enrolled between 2001 and 2007). All subjects or their guardians signed an informed consent form.
The diagnosis of GD was based on reduced glucocerebrosidase activity in peripheral white blood cells or in cultured fibroblasts or lymphoblasts (29). Fifty patients were type 1, and 2 patients were type 3.
At the time of enrollment (baseline), all 52 patients underwent a complete clinical, biochemical, and imaging evaluation (radiography and ultrasound, with additional MR imaging in some patients, to enable staging by the combined Zimran SSI (28).
The principal clinical characteristics of the patients are summarized in Table 1. Patients were subdivided into 3 groups according to their treatment status at enrollment. Six patients were ERT-naïve at baseline and were not treated until at least the first follow-up evaluation (group I); 17 patients were on ERT at enrollment and continued to be treated throughout follow-up (group II), 29 patients were ERT-naïve at enrollment and began ERT immediately thereafter (group III). ANOVA showed significant baseline differences among the 3 groups concerning age at diagnosis, splenomegaly, hemoglobin, baseline 99mTc-sestamibi score, and serum chitotriosidase. Differences were of borderline statistical significance (P = 0.06) for hepatomegaly, bone pain, and x-ray score (30). No significant differences were observed concerning age at enrollment, sex distribution, platelet count, Zimran SSI, or proportion of patients with prior splenectomy.
Comparison of Baseline Factors for the 3 Treatment Groups
After baseline 99mTc-sestamibi scintigraphy, all 52 patients underwent at least 1 follow-up scan 56.5 ± 34.9 mo later (median, 52.5 mo; range, 10–127 mo). Within this period, several patients underwent additional 99mTc-sestamibi scanning (overall 3 scans in 19 patients, 4 in 15 patients, and 5 in 10 patients) at irregularly spaced intervals; the patients were referred from clinical centers distributed throughout Italy and underwent scintigraphy according to personal needs. All scans were reviewed independently and scored by 3 experienced nuclear physicians, who reached a final consensus for discordant readings. The statistical analysis used here is based on a total of 174 scans; 122 follow-up scans versus baseline were therefore available for analysis.
99mTc-Sestamibi Score
Scintigraphy with 99mTc-sestamibi (Cardiolite; Bristol-Meyers-Squibb) was performed as previously described (25); in patients undergoing ERT, the scan was performed 2 wk after the last ERT dose.
No bone marrow uptake is normally observed with 99mTc-sestamibi, except for possible mild, diffuse uptake in secondary hyperparathyroidism (31), which did not occur in any of our patients. The degree of disease is therefore scored on the basis of focal uptake in the bone marrow. The scintigraphic score (sum of assessments of both extent and intensity of uptake) is 0 when no uptake can be detected in the marrow; the lowest degree of detectable uptake is scored 2, the maximum, 8.
Statistical Analysis
Baseline clinical and demographic continuous factors in the 3 groups were compared by 1-way ANOVA, whereas F statistics and Fischer-Freedman-Halton χ2 analysis were used for categoric factors. Standard statistics were used for parametric and nonparametric data (nonparametric Mann–Whitney U test for 2 independent populations, Pearson χ2 test, and Fisher exact test).
Multistep statistical analysis based on linear mixed models (repeated-measures ANOVA, multiple regression analyses, stepwise forward analysis, and generalized estimating equations [GEEs; cross-sectional time-series multiple regression analyses with fixed effects (32)]) was applied for assessing response to ERT of the 99mTc-sestamibi score and the Zimran SSI. By assessing longitudinal data in which follow-up evaluations are not available at well-defined time points, these models are particularly suited to analyzing our data and take into account multiple measurements per patient.
In the first step, repeated-measures ANOVA models were used. For statistical analysis, patients were partitioned into 3 groups as defined above. Two patients of group I who started ERT after their first follow-up evaluation were evaluated separately on subsequent occasions. The same types of repeated-measures ANOVA models were applied to additional visits, with reformulated comparison groups depending on treatment and with diminishing numbers of patients.
In the subsequent step, multiple regression analyses were performed to assess associations between the bone marrow scintigraphic score and the Zimran SSI in each pair of sequential controls as a function of ERT. To correct the SE for the bias of sequential observations in the same patient, each parameter was evaluated using the difference between the values observed in subsequent controls. Four parameters characterizing ERT were independently considered in the analysis: ERT dose per month, ERT duration, cumulative ERT dose over follow-up, and total ERT dose (sum of cumulative ERT and possible ERT administered before enrollment in the study). The following additional parameters were considered as independent variables: age, age at diagnosis, prior splenectomy, splenomegaly, hepatomegaly, bone pain, x-ray score, platelet count, leukocyte count, and hemoglobin concentration. To simplify statistical analysis, continuous variables, such as platelet and leukocyte counts and hemoglobin concentration, were transformed into semiquantitative scores as either normal (0) or abnormal (1). Stepwise forward analysis was used to select or identify the independent variables that significantly affect the dependent variables (bone marrow scintigraphic score and Zimran SSI).
Because it is not possible to evaluate the time course of each variable in the single patient with this analysis, the subsequent step was multiple regression analysis for repeated measures using the method of GEEs (31). At variance with ANOVA, GEE yields—for each parameter characterizing ERT—the β-regression coefficient and the related P value. By repeatedly measuring a set of observations over time, this model is useful to pool cross-sections and increases the study’s power because of the increased number of observations per subject. In this model, scores of the same patient measured at different time points are considered dependent on each other, thus retrieving useful information on the trend of changes observed in each patient over follow-up. By defining the profile of individual patients, this analysis evaluates the effect of the various parameters of ERT on the scintigraphic score and SSI corrected for contribution from other parameters (such as platelet count, hemoglobin concentration, and splenomegaly). The results of GEE analysis are concordant and not alternative with respect to the ANOVA results.
Statistical evaluations were performed using the STATA Statistical Software package, release 10-2010 (STATA Corp.). GEEs were analyzed using the XTGEE procedure. Unless otherwise specified, mean values ± SDs are reported.
RESULTS
Although the 99mTc-sestamibi score at the follow-up examination worsened in patients who were not treated or received only low-dose ERT, the score generally improved after higher-dose ERT, particularly in ERT-naïve patients (Fig. 1).

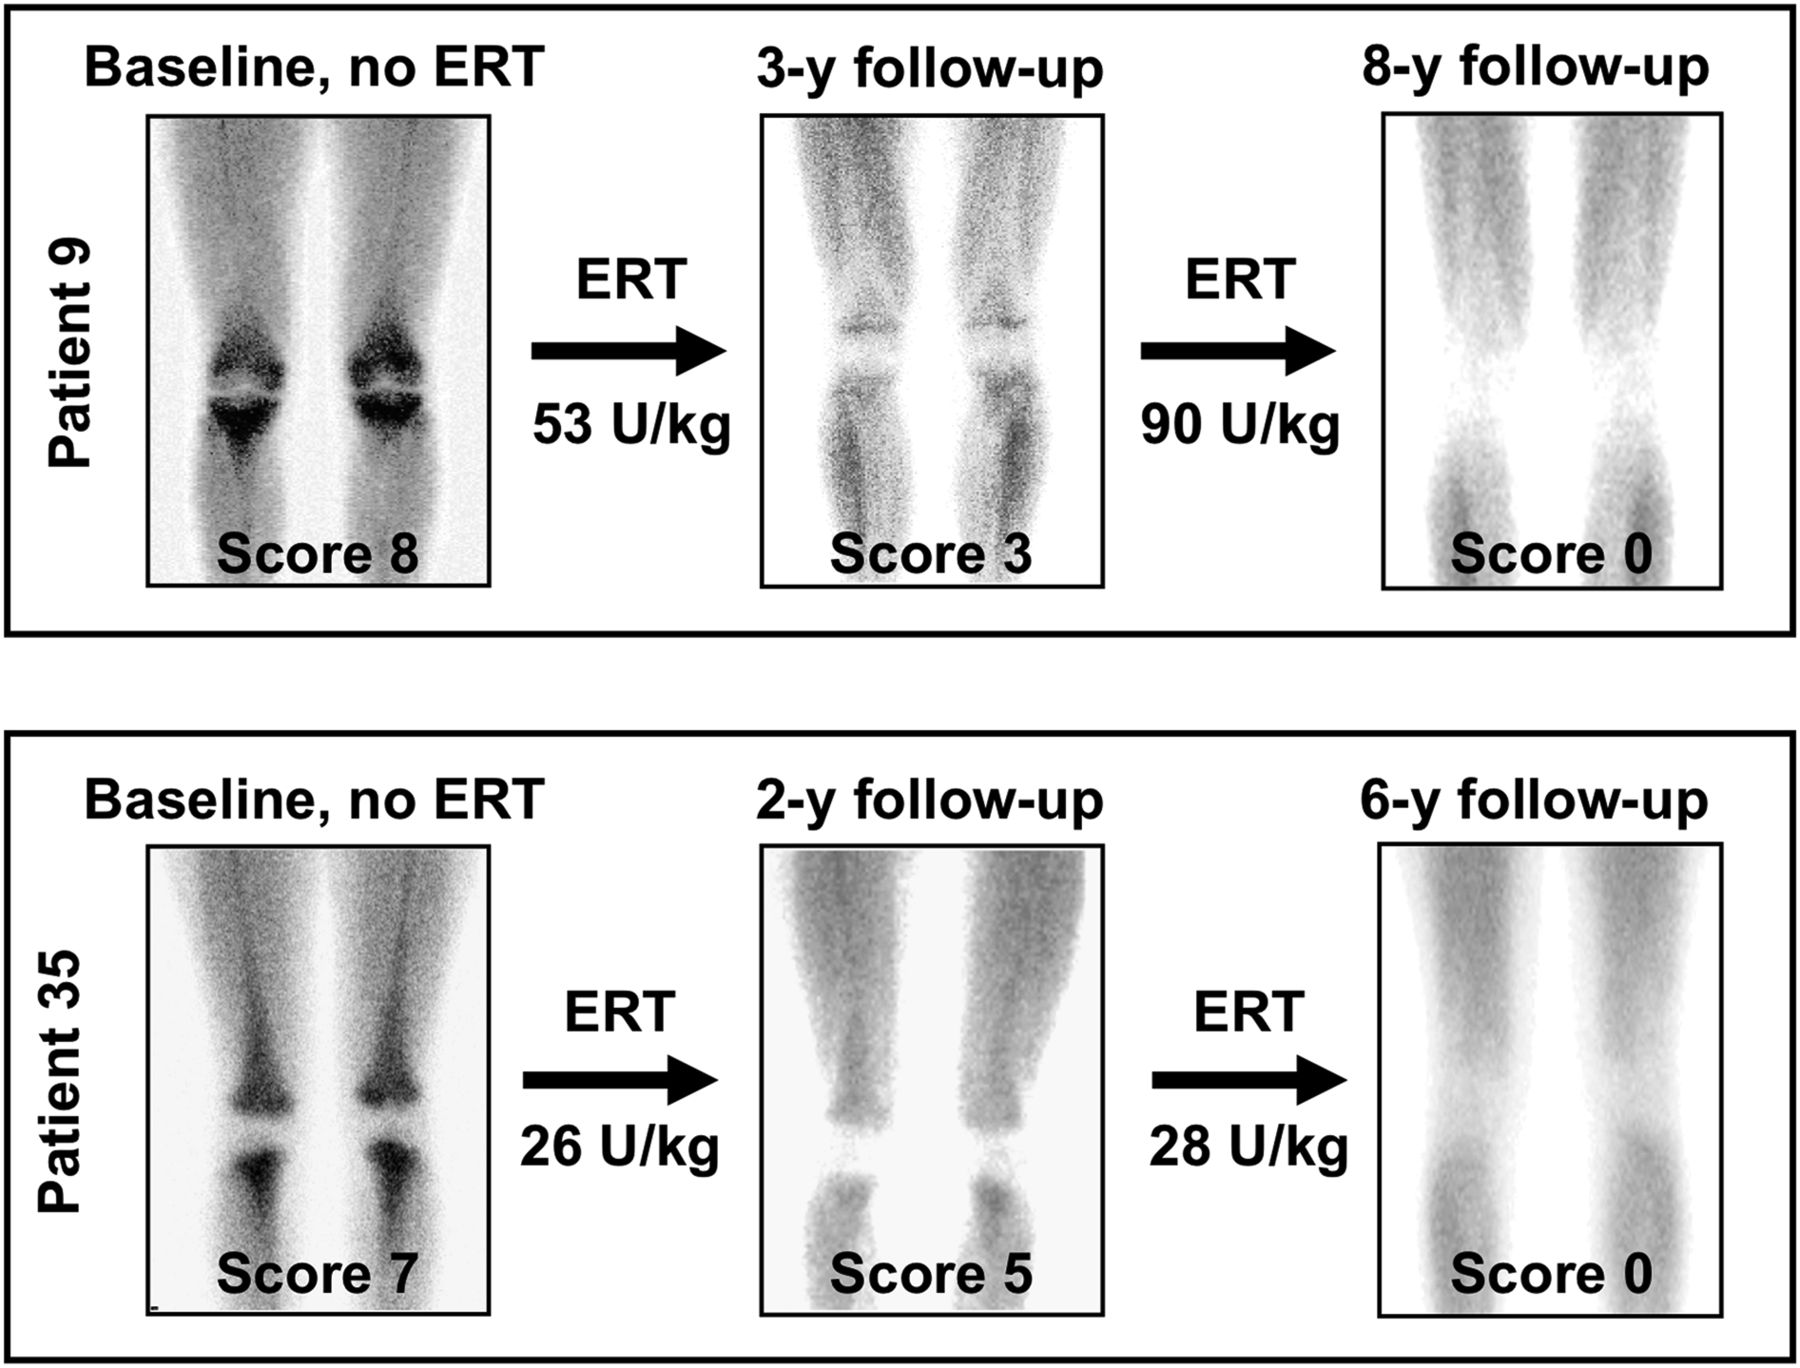
Progressive reduction until normalization of 99mTc-sestamibi scintigraphic score induced by ERT in 2 patients with type 1 GD throughout follow-up. In patient 9, a 12-y-old girl, ERT was initiated after clinical and scintigraphic evaluation had shown worsening of overall pattern vs. baseline evaluation 1 y earlier. At subsequent follow-up 1 y later, 99mTc-sestamibi scintigraphy showed frank improvement and was scored 3. Five years later, no 99mTc-sestamibi uptake was detectable in bone marrow of femora and tibiae, being therefore scored 0. Patient 35 was 47 y old at enrollment. At baseline evaluation, she had never received ERT. Intense tracer uptake (score 7) involved almost entirety of femora and tibiae. After about 2 y of ERT, 99mTc-sestamibi scintigraphy showed clear improvement vs. baseline, with bone marrow visualization still being extensive but tracer uptake much less intense (score 5). At last follow-up evaluation 6 y after baseline, scintigraphic pattern was normal.
The Mann–Whitney U test demonstrated that patients whose bone marrow disease was improved by ERT only at first or only during follow-up versus at baseline had been treated with a significantly higher ERT dose per month than patients who did not improve on ERT (41.85 ± 2.93 [SEM] vs. 26.08 ± 4.47 U/kg/mo, P = 0.0032). The minimum effective ERT dose inducing reduced bone marrow infiltration, calculated as mean − 2 SEMs in the group with the improved score, was 35.99 U/kg/mo, whereas the maximum noneffective dose (mean + 2 SEMs in the group with an unchanged or worsened score) was 34.92 U/kg/mo. Therefore, considering all patients treated between baseline evaluation and the first follow-up evaluation, the threshold for ERT to induce any improvement in the 99mTc-sestamibi score (average reduction equal to 2 score units as both median and mean value) was about 35–36 U/kg/mo.
During follow-up, 23 or 48 patients receiving ERT reached a normal or nearly normal scintigraphic pattern, respectively, with the 99mTc-sestamibi score declining from an initial 3–8 to a final 0–2. Parameters that significantly discriminated patients with better bone marrow response were a shorter duration of signs of GD, lower baseline scintigraphic score, longer duration of ERT, and higher cumulative ERT dose. Normal or near-normal final marrow scores were associated with significantly lower final serum chitotriosidase levels and Zimran SSI (Table 2).
Patients with Normal or Near-Normal 99mTc-Sestamibi Score After ERT (from Initial 3–8 to Final 0–2) vs. Patients Whose Condition Did Not Normalize Despite ERT
Figure 2 shows changes in 99mTc-sestamibi scores between baseline and the first follow-up visit in the 3 groups of patients. Significant differences in the pattern of change in the score were observed among the 3 groups (F2, 49 = 5.670 with P = 0.001 after adjustment for length of follow-up). In particular, group III patients (ERT-naïve at enrollment) had baseline scores markedly higher than the patients of groups I and II, but their score dramatically improved during follow-up. The baseline 99mTc-sestamibi score of group I patients was only slightly higher than that of group II but then worsened during follow-up without ERT. Group II patients (already treated with ERT for an average 4 y before enrollment) had initial scores of intermediate severity and subsequently improved during follow-up, although less dramatically than group III patients.
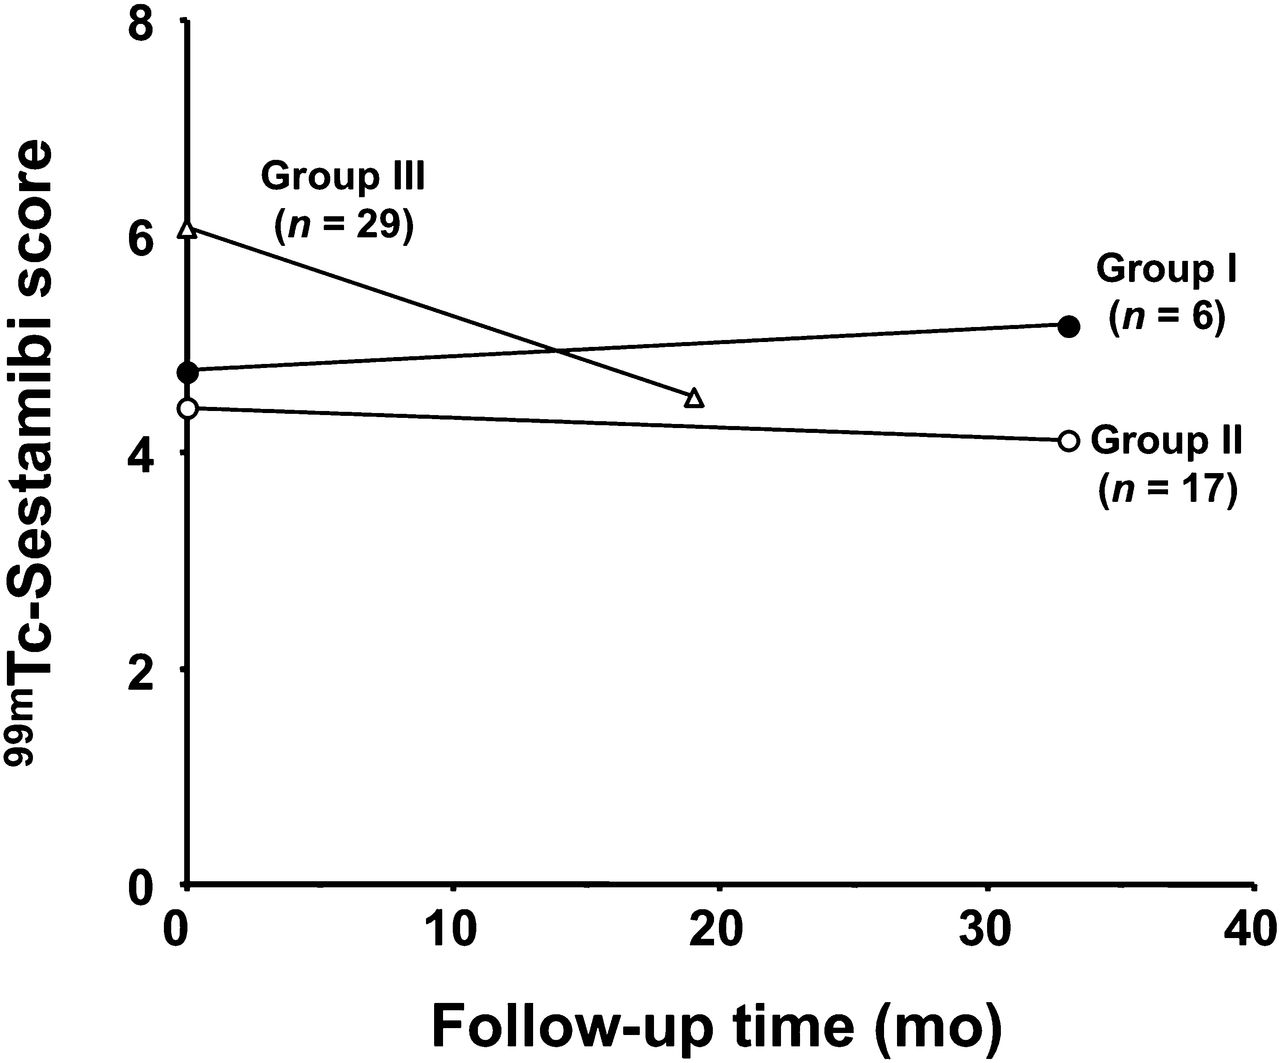
Repeated-measures ANOVA in groups defined as follows: group I, patients ERT-naïve at enrollment who did not receive ERT during follow-up; group II, patients already receiving ERT at enrollment and maintained on ERT during follow-up; group III, patients ERT-naïve at enrollment who then were started on ERT. Data are changes in mean 99mTc-sestamibi scores between baseline evaluation and first follow-up visit, with average length of follow-up being shown for each group. Most pronounced reduction in scintigraphic score was observed in group III. Groups I and II had similar initial scores at enrollment, but in patients not treated with ERT (group I), score worsened, whereas in patients continuing treatment (group II), score continued to improve, though with lesser slope than in patients of group III.
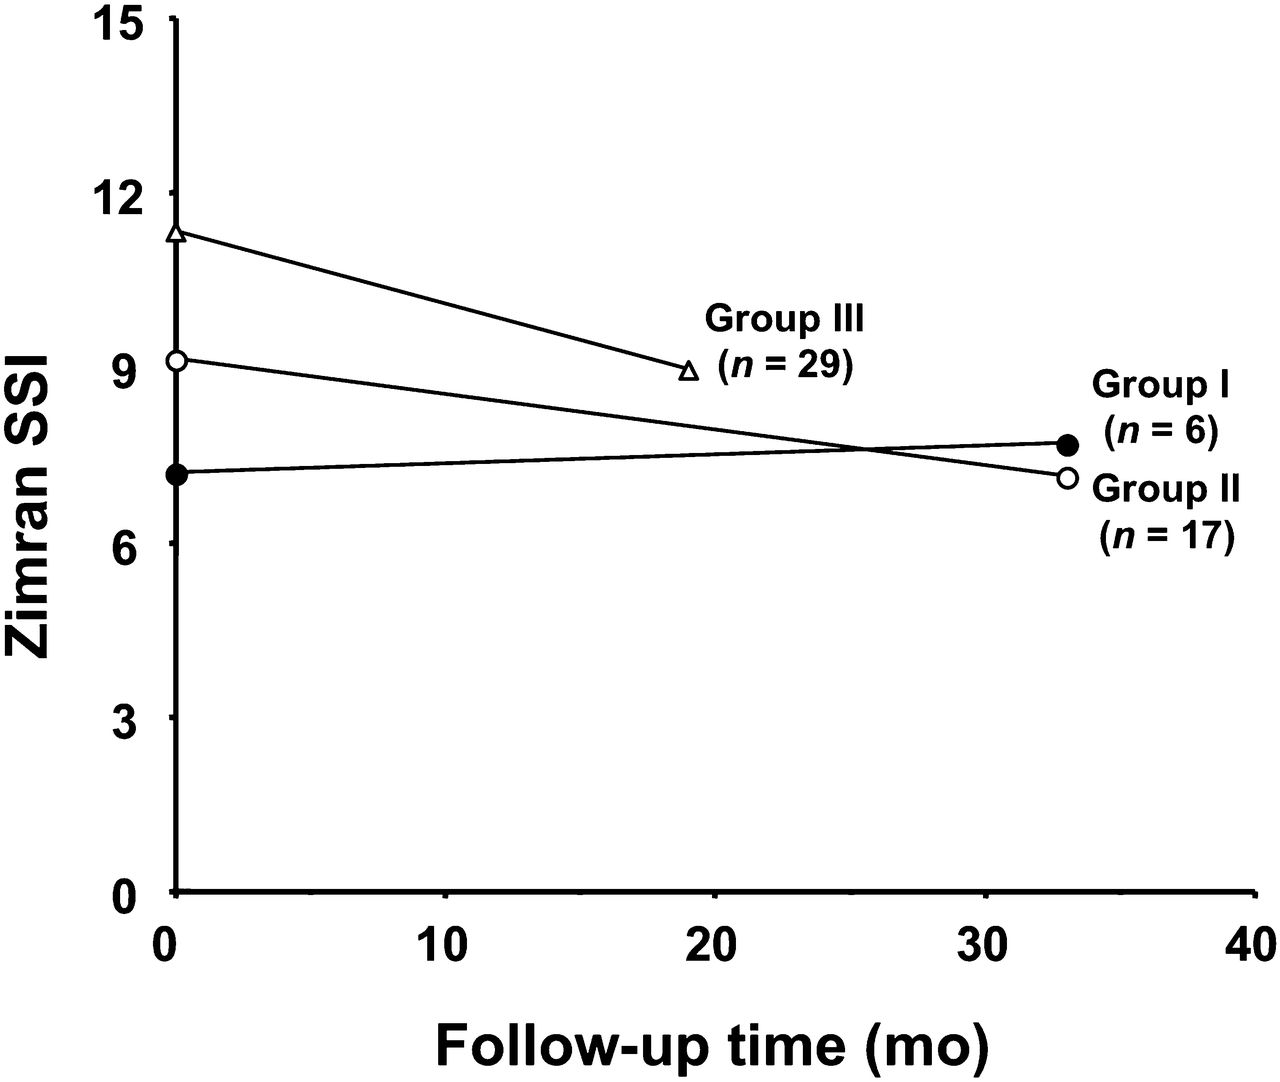
The pattern of change in the bone marrow score at the first follow-up visit versus baseline was consistent with that observed with the overall Zimran SSI, also worsening in patients not receiving ERT during follow-up (F2, 49 = 7.971 with P = 0.001 after adjustment for length of follow-up) (Fig. 3).

Average changes in overall Zimran SSI observed at first follow-up visit vs. baseline, showing patterns similar to those observed with 99mTc-sestamibi score.
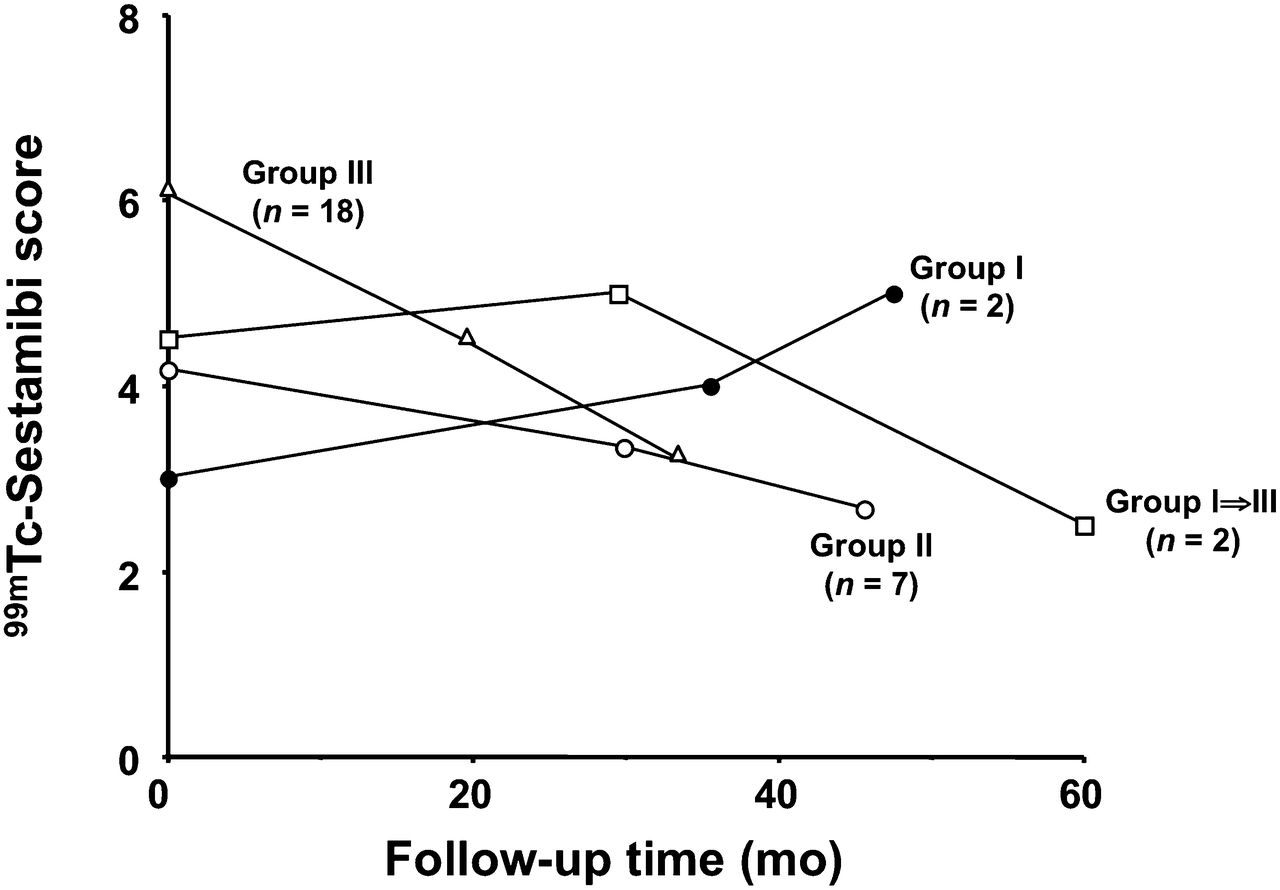
Figure 4 shows the changes in bone marrow score in 2 patients of group I who started ERT after their first follow-up evaluation and in 2 patients who remained untreated. Groups II and III showed subsequent improvement in the bone marrow score, whereas group I patients who continued without ERT further worsened. In contrast, group I patients who started ERT after their first follow-up visit had a dramatic reduction of marrow disease.

Pattern of changes in scintigraphic score observed in the 29 patients who were evaluated at least at 2 follow-up points after baseline evaluation. The 2 group I patients who started ERT after first follow-up evaluation are plotted separately and identified as group I⇒III. Although population of patients with at least 2 follow-up evaluations after enrollment is reduced, patterns observed are quite consistent with those observed at first follow-up in entire population.
Table 3 reports the results of regression and cross-sectional analysis. In group III patients (n = 31), all ERT parameters correlated strongly with the bone marrow response. In contrast, for group II patients (n = 17) the only significant determinants of improvement in the score were duration of ERT and total ERT dose (Fig. 5). Patients already receiving ERT (group II) responded more slowly than ERT-naïve patients (different intercept values in Fig. 5). Between baseline and the first follow-up scan, the ERT dose was slightly lower in group II than in group III (37.4 vs. 41.2 U/kg/mo). Afterward, the average ERT doses were 44. 7 and 40 U/kg/mo in groups II and III, respectively.
Correlation of Changes in 99mTc-Sestamibi Score and in Combined Clinical SSI with Other Variables

Results of cross-sectional analysis assessing improvement in 99mTc-sestamibi score as function of ERT dose per month, plotted separately for patients of group II (already receiving ERT at time of enrollment and continuing treatment through follow-up, ▪) and group III (ERT-naïve at enrollment and then started on ERT) (○). Despite similar slopes, higher intercept value of line for group III indicates slower response to ERT in patients who were already receiving treatment than in ERT-naïve patients when treatment was initiated. b.w. = body weight.
Linear regression analysis for group III patients showed that any unit increase in ERT dose per month improved the scintigraphic score by a factor of 0.036 (P = 0.012), whereas a unit increase in cumulative ERT dose improved the score by a factor of 0.0016 (P < 0.001). Therefore, in ERT-naïve patients a reduction of 1 unit in bone marrow score is expected after ERT at about 28 U/kg/mo, or after a cumulative dose of 625 U/kg.
An additional result of the cross-sectional analysis (not shown in Table 3) was that the reduction in 99mTc-sestamibi score in response to ERT was slower in patients with greater degrees of splenomegaly than in patients with milder splenomegaly (P = 0.002 for ERT dose per month, P = 0.003 for cumulative ERT, P = 0.005 for total ERT). The same pattern was observed in patients with reduced platelet count versus patients with normal platelet count (P = 0.001 for ERT dose per month, P < 0.0001 for cumulative ERT, P = 0.001 for total ERT). No other clinical parameter (either separately or combined in the overall SSI) was associated with improvement in the scintigraphic score in response to ERT.
A sensitivity analysis based on data obtained with the 3 statistical models (repeated-measures ANOVA, multiple regression analysis, and GEEs) confirmed the coherence of the results obtained.
DISCUSSION
Despite reports on the use of 99mTc-sestamibi scintigraphy to assess bone marrow involvement in GD patients (25,26,33), the mechanism of accumulation in the marrow is unclear. Evidence acquired during this study might shed some light on this matter. A prosthetic hip replacement that was planned for a 39-y-old woman with GD immediately after 99mTc-sestamibi scintigraphy allowed ex vivo SPECT/CT imaging of her resected femoral head, which was then processed for immunohistochemical analysis using an antiglucosylceramide antibody. The accumulation of 99mTc-sestamibi within the femoral head matched MR imaging changes indicating macroscopic marrow infiltration, and immunohistochemistry confirmed the presence of Gaucher cells in the same area (Fig. 6). Thus, although 99mTc-colloid scintigraphy was not performed on this patient for a pairwise comparison, the pathophysiology of 99mTc-sestamibi accumulation in the bone marrow of GD patients might be similar to that observed in multiple myeloma patients, in whom focal sites of 99mTc-sestamibi uptake match sites of active disease as detected by 18F-FDG PET and MR imaging (34).

A 39-y-old patient for whom left hip prosthetic replacement was planned because of GD-related changes. Patient was injected with 99mTc-sestamibi 1 h before surgery. (A) Coronal T1-weighted MR image of left hip showing marrow infiltration in femoral head (top left), frontal image of explanted femoral head (top right), coronal low-resolution CT image of explanted femoral head (bottom left), and fused coronal SPECT/CT image of explanted femoral head (bottom right). 99mTc-sestamibi uptake matches GD-related marrow changes detected by MR imaging in lower portion of femoral head. Arrows point to same anatomic landmark in all 4 images. (B) Immunohistochemical staining of same surgical specimen using mouse antiglucosylceramide antiserum (40), demonstrating typical glucosylceramide-positive Gaucher cells in bone marrow (∼×400 magnification on left and ×1,000 on right) corresponding to site of 99mTc-sestamibi uptake.
The criteria for monitoring the efficacy of ERT and for assessing the effect of adjustments in the dose or administration schedule are not clearly defined (35,36), especially concerning the skeletal manifestations of the disease, which are responsible for much of the disability associated with untreated GD (36). The recommendation to evaluate the entirety of the femora and spine with plain radiography every year or at the time of dosage adjustment (11,36) contrasts with the common notion that radiographically detectable improvements in the skeleton in response to ERT develop much more slowly than visceral or hematologic responses or improvement in quality of life (12,37).
Current guidelines for ERT in GD are derived mostly from early observations adopting a rather crude dose adjustment (e.g., 30 U/kg of body weight/mo in pediatric patients with hematologic and visceral manifestations only and double that dose if skeletal manifestations are also present, with a subsequent 50% dose increase in the case of bone crises) rather than from carefully designed dose-finding studies (3,36). Prospective and comparative studies on different dosing regimens and fractionation are limited (12). This issue is important for the use of resources available for health care.
In this investigation, we validated 99mTc-sestamibi scintigraphy as an additional method for monitoring the evolution of bone marrow involvement in GD patients, with or without treatment. Long-term changes in the scintigraphic score correlated strongly with the main ERT parameters, that is, dose per month, duration of treatment, and cumulative and total ERT doses. On average, patients exhibiting an improved 99mTc-sestamibi score received a significantly higher ERT dose per month than patients who did not improve. The threshold ERT dose above which the scintigraphic score is expected to exhibit any improvement (with a median and mean value of 2 units) was calculated to be about 35–36 U/kg/mo in patients receiving ERT. In ERT-naïve patients, an ERT dose of about 28 U/kg/mo induced a reduction of 1 unit in the bone marrow score. Therefore, this evidence-based threshold should be considered the minimum ERT dose expected to induce a reduction in bone marrow infiltration. In addition, the 99mTc-sestamibi score showed complete or nearly complete recovery in several patients after ERT. This information is not easily provided by radiography (which evaluates only the skeletal consequences of marrow infiltration) and sometimes is not provided even by MR imaging (which shows some abnormalities that can be irreversible even after long-term therapy, such as those caused by bone marrow infarction) (Supplemental Fig. 1, available at http://jnm.snmjournals.org) (15).
Demonstrating a dose–response threshold for the bone marrow is important in predicting a certain response to ERT, which follows a pattern relatively independent from the response of other parameters of disease severity. Despite the strong trend toward a better bone response to higher ERT doses, the risk for bone complications cannot be established as a criterion to start higher-dose ERT (38,39).
The likelihood that ERT would nearly eliminate bone marrow infiltration was higher under 3 circumstances: if therapy was initiated when signs of disease had appeared less than 10 y earlier, if patients had a less severe degree of bone marrow infiltration when ERT was begun, and if patients received a higher cumulative ERT dose or ERT for a longer period. These observations are especially important in that—due to limited resources—ERT is sometimes postponed even beyond guideline indications. Scintigraphic monitoring with 99mTc-sestamibi provides evidence that such a delay reduces the chance of attaining a normal or near-normal scintigraphic score, at least within a certain time window.
The sequential scintigraphic evaluations in this study showed that the response of bone marrow infiltration to ERT was dramatically more pronounced in ERT-naïve patients who initiated treatment after the baseline evaluation than in those already receiving ERT at enrollment. A tentative explanation for this finding is that the therapeutic effect is especially pronounced in the first phases of ERT (when the disease is severe) but becomes less pronounced as the disease severity approaches normalization. The patients of group II had already received an average cumulative ERT dose of 1,730 U/kg (distributed over an average 47-mo period) at the time of the baseline 99mTc-sestamibi scan. Thus, the difference between groups II and III in the slopes defining improvement of the scintigraphic score is most likely linked more to the difference in observation time after the start of ERT between the 2 groups than to the slight difference in ERT dose. Nevertheless, although the ERT-induced improvement in the scintigraphic score was less pronounced in patients already receiving ERT before enrollment than in ERT-naïve patients at enrollment, patients already receiving ERT still benefit from ERT. These observations indicate that improvement in the scintigraphic score caused by ERT is not linear over the entire duration of treatment but rather resembles a first-order process, that is, with a logarithmic-type function whereby a constant fraction of the process (improvement) takes place over time. Instead, the scintigraphic score worsened in those few patients not receiving ERT during follow-up. The patterns of changes in the quantitative scintigraphic score mimicked the corresponding pattern of changes in the overall Zimran SSI observed during follow-up. Furthermore, cross-sectional analysis of the follow-up data showed that no relevant effect of ERT was observed on the 99mTc-sestamibi score until platelet count and splenomegaly had improved.
CONCLUSION
The results of this study demonstrate that, although based on localized evaluation and possibly not directly mirroring glucosylceramide accumulation, the 99mTc-sestamibi bone marrow score is an excellent predictor of the overall severity of GD and that changes in the scintigraphic score correlated more closely with the main determinants of ERT than did the other clinical score (either separately or combined in the Zimran SSI). Of major clinical interest is that the results of ERT on the scintigraphic score were better in patients with a shorter manifestation of disease and in patients with less severe disease when initiating ERT. Furthermore, a dose–response relationship was identified between ERT and the scintigraphic score, and a minimum threshold was defined for the ERT dose expected to yield a positive response of the scintigraphic score to treatment. Therefore, 99mTc-sestamibi scintigraphy can be used to evaluate bone marrow response to ERT. Major benefits of this procedure are the ability to identify the quantity of enzyme required for bone marrow and skeletal benefit and to correlate this quantity with predictions of the optimal dose of exogenous glucocerebrosidase for successful treatment of patients with GD.
DISCLOSURE
The costs of publication of this article were defrayed in part by the payment of page charges. Therefore, and solely to indicate this fact, this article is hereby marked “advertisement” in accordance with 18 USC section 1734. Financial support was provided by the Italian subsidiary of Genzyme Corp. during portions of the study. No other potential conflict of interest relevant to this article was reported.
Acknowledgments
We thank all patients who participated in this investigation and the Italian Association of Gaucher Disease for its support. Thanks are also due to the following colleagues who either referred patients for the study or performed some of the 99mTc-sestamibi scans: Rosanna Gatti (Genoa, Italy), Angela Amendola (formerly in Rome, now in Potenza, Italy), Assuero Giorgetti, Marzio Perri, Isabella Raugei (Pisa, Italy), Isabella Raugei, Giuseppe Villa (Genoa, Italy), Massimo Morfini (Florence, Italy), and Maria D. Cappellini (Milan, Italy).
Footnotes
Published online Aug. 29, 2013.
- © 2013 by the Society of Nuclear Medicine and Molecular Imaging, Inc.
REFERENCES
- Received for publication February 18, 2013.
- Accepted for publication May 7, 2013.


Jump to section
Related Articles
Cited By...
- No citing articles found.