


Abstract
The application of stereotactic ablative radiotherapy (SABR) to hepatocellular carcinoma (HCC) is emerging. To identify pretreatment prognostic indicators is crucial for patient selection and optimal individual therapy. The aim of this study was to determine whether 18F-FDG PET and a combined 18F-FDG–contrast CT parameter could be useful tools to predict tumor control for patients with HCC treated by SABR. Methods: We retrospectively identified 31 patients (41 tumors) who underwent 18F-FDG PET before SABR between November 2007 and September 2011. 18F-FDG PET parameters were collected as prognostic indicators, including visual PET scale (+/−), maximal standardized uptake value (SUV) of the tumor (TSUVmax), ratio of TSUVmax to maximal normal-liver SUV, ratio of TSUVmax to mean normal-liver SUV, and score combining tumor volume and TSUVmax (CT/18F-FDG PET score). They underwent SABR with a median dose of 42 Gy (ranging from 30 to 50 Gy) in 4–5 fractions. 18F-FDG PET parameters and clinical factors were tested as predictors of tumor control and patient survival. Results: The median follow-up time was 18 mo. Among the parameters examined, TSUVmax and CT/18F-FDG PET score were significantly correlated with tumor control. TSUVmax with a cutoff value of 3.2 was the most significant prognostic indicator. The 4-y control rate was 86.2% in tumors with a TSUVmax of 3.2 or less but only 37.5% in those with a TSUVmax of more than 3.2 (adjusted hazard ratio, 9.40; 95% confidence interval, 1.18–74.76; P = 0.034). CT/18F-FDG PET score (≤4 vs. >4) was also a significant predictor of tumor control after SABR. Tumors with a CT/18F-FDG PET score of more than 4 had a 5.23-fold risk of tumor failure. After adjustment for factors of sex, American Joint Committee on Cancer stage, Cancer of the Liver Italian Program score, and Child–Pugh classification, tumors with a score of more than 4 had a 4.96-fold risk of failure after SABR, compared with tumors with a score of 4 or less. For overall survival, none was statistically significant. Conclusion: The use of 18F FDG PET to predict tumor control is feasible. TSUVmax with a cutoff value of 3.2 is the best prognostic indicator. We suggest that 18F-FDG PET may be a reference for prognostic prediction, patient selection, and radiation dose adjustment for HCC patients treated with SABR.
Hepatocellular carcinoma (HCC) represents the main histologic type (70%–85%) of primary liver cancers, which are the fifth most frequently diagnosed cancer worldwide in men and the seventh in women. HCC is a fatal disease with an overall ratio of mortality to incidence of 0.93 (1,2). Surgical resection or transplantation is the treatment of choice (3). However, 80% of cases are unresectable at the time of diagnosis because of the underlying chronic liver disease and the presence of advanced disease. Alternatively, locoregional therapies may be used to palliate symptoms, to extend life, and to downstage the tumor to allow transplantation or resection. Of those, stereotactic ablative radiotherapy (SABR), also known as stereotactic body radiation therapy, is increasingly being used to treat unresectable HCC. It is an increasingly popular new radiation therapy technique with highly precise delivery of high-dose radiation to the target in a hypofractionated course under an image-guided setting. Publications on its safety and efficacy are emerging, and the results are promising (4–8). Nevertheless, a substantial fraction of patients experience tumor recurrence. How to identify useful pretreatment prognostic indicators and carefully select patients is therefore crucial for optimization of the application of SABR on HCC.
PET using 18F-FDG is a noninvasive functional technique with rapid expansion in clinical application over the past few years, especially in oncology. 18F-FDG PET is a useful tool for the staging and restaging of cancer, for detection of occult primary tumors, and for early prediction of treatment response in various types of malignancy, including non–small cell lung cancer, esophageal cancer, head and neck cancer, colon cancer, and lymphoma (9). For diagnosis of HCC, the sensitivity of 18F-FDG PET is only 50%–55% (10–12), yet a recent metaanalysis concluded that 18F-FDG PET is powerful at ruling in extrahepatic metastases and ruling out recurrent HCC (13). Also, some reports have suggested that 18F-FDG PET is a potent predictor of treatment outcome in patients with HCC after hepatectomy, liver transplantation, radiofrequency ablation, and transarterial chemoembolization (14–21). However, there is only a single report on 18F-FDG PET as a predictor of 1-mo response after radiation therapy. Kim et al. found that higher 18F-FDG uptake resulted in better response in patients with HCC 1 mo after completion of conventionally fractionated radiation therapy (22). Still, no study has focused on the association of 18F-FDG PET and tumor control after SABR. Moreover, the role of 18F-FDG PET in the actual tumor control rate during long-term follow-up remains unclear.
The aim of this study was to examine our hypothesis that 18F-FDG PET is a useful tool to predict tumor control for patients with HCC treated by SABR. We also sought to evaluate the prognostic values among various 18F-FDG PET parameters and determine the independent predictors.
MATERIALS AND METHODS
Patients
From November 2007 to September 2011, 171 patients with HCC were treated at the Cyberknife Stereotactic Radiosurgery Center, Tri-Service General Hospital, Taipei, Taiwan. Among them, 31 patients with 41 lesions underwent 18F-FDG PET before SABR. Data were collected from the cancer registry of Tri-Service General Hospital. Diagnosis was by cytohistology or noninvasive criteria. The diagnosis was made if there was a nodule larger than 2 cm together with the classic enhancement on 1 imaging technique or an α-feto protein (AFP) level higher than 200 ng/mL. The diagnosis was also made if there was a 1- to 2-cm nodule with typical features on 2 imaging studies (23). Before SABR, the medical history of the patients was taken, and they underwent physical examination; testing of complete blood count, serum biochemistry, and AFP; chest radiography; and MR imaging or CT of the abdomen. Liver angiography and bone scanning were optional for some patients if clinically indicated.
All patients were retrospectively restaged according to the American Joint Committee on Cancer (AJCC) staging manual, seventh edition. Written informed consent was obtained from all patients before therapy, and the study was approved by the institutional review board of Tri-Service General Hospital. The detailed patient and tumor characteristics are listed in Tables 1 and 2, respectively.
Patient Characteristics
Tumor Characteristics
SABR
Details of our SABR protocol, target delineation, treatment planning techniques, planning evaluation, and constraints of dose-limiting organs have been previously published (6). In short, SABR was delivered with the Cyberknife (Accuray Inc.) image-guided radiosurgery system. Treatment-planning CT images were obtained at 1 mm per slice 1 wk after fiducial placement. Target delineation was based on the visible tumor volume on contrast-enhanced imaging. Treatment planning was conducted with Multiplan Cyberknife planning software, and a Synchrony respiratory tracking system (Accuray Inc.) was used for real-time tumor tracking. The median prescribed dose was 42 Gy (range, 30–50 Gy) in 4–5 fractions on 4–5 consecutive working days. The normal liver dose constraint was set at more than 700 cm3 of normal liver receiving less than 15 Gy.
18F-FDG PET and Associated Parameters
18F-FDG PET was performed before SABR using an integrated PET/CT scanner (Biograph BGO duo; Siemens Medical Solutions). The patients fasted for more than 6 h, and their blood glucose levels were less than 150 mg/dL before the injection of 370 MBq of 18F-FDG tracer. Acquisition of the PET images began 1 h after the injection.
Quantitative analysis of 18F-FDG uptake was performed to obtain 18F-FDG PET parameters. The standardized uptake value (SUV) was calculated as follows:
Where C was tissue activity concentration measured by PET and ID was injected dose. The maximal SUV of the tumor (TSUVmax) was defined as the highest SUV in the tumor. TSUVmean represented the mean SUV of the tumor. To evaluate the SUV of the normal liver, 2 regions of interest containing about 100 pixels were circled on normal liver of the right lobe, with at least a 5-cm separation. Another region of interest containing about 100 pixels was drawn on normal liver of the left lobe. The maximal SUV of normal liver (LSUVmax) was defined as the highest SUV among the 3 regions of interest. The mean SUV of normal liver (LSUVmean) was the average of the mean of the 3 regions of interest in normal liver. As a result, we obtained PET parameters of visual PET scale (+/−), TSUVmax, TSUVmax/LSUVmax, and TSUVmax/LSUVmean.
TSUVmax indicates the highest 18F-FDG uptake in tumor cells but does not represent tumor burden. Therefore, we created a new scoring system, CT/18F-FDG PET score, by combining TSUVmax on 18F-FDG PET and tumor volume on contrast CT. First, we arbitrarily divided tumors into 4 groups by the quartile of TSUVmax, and then we scored them as 1–4 points (≤2.8, 1 point; 2.9–3.4, 2 points; 3.5–4.2, 3 points; >4.2, 4 points). Second, we arbitrarily categorized tumors into 4 groups by the quartile of tumor volume (0–10 cm3, 1 point; 10–50 cm3, 2 points; 50–125 cm3, 3 points; >125 cm3, 4 points). The CT/18F-FDG PET score of each tumor was the sum of these 2 scores. All tumors were further divided into a high–CT/18F-FDG PET score group (>4) and a low–CT/18F-FDG PET score group (≤4).
Follow-up and Assessment
All patients were followed every 1–2 mo for the first 6 mo and every 3 mo thereafter. History taking, physical examinations, complete blood count, prothrombin time/activated partial thromboplastin time, serum biochemistry, and AFP were performed during follow-up. Patients underwent CT scanning or MR imaging 2–3 mo after completion of SABR and then every 3–4 mo. Tumor control was defined as no recurrence within the planning target volume, demonstrated by no new contrast enhancement or progressive disease as defined by the Response Evaluation Criteria in Solid Tumors.
Statistical Analysis
Associations between clinical tumor factors and 18F-FDG PET parameters were examined by χ2 testing. We used the Kaplan–Meier method to calculate the tumor control curves (41 tumors) and overall survival curves (31 patients), and the differences between groups were assessed using the log-rank test. The Cox proportional hazards regression model was used to estimate relative risk of tumor failure. We also determined the adjusted hazard ratio and confidence interval for tumor failure after adjusting factors of sex, AJCC stage, Cancer of the Liver Italian Program (CLIP) score, Child–Pugh classification, and tumor volume. All tests were 2-sided, and a P value of less than 0.05 was considered statistically significant. Data were analyzed using SPSS (SPSS Inc.), version 17.
RESULTS
Clinical Tumor Factors and 18F-FDG PET Parameters
Table 1 shows patient characteristics. Men composed 81% of the study population. The mean age of all 31 patients was 63.8 y. Most were carriers of hepatitis B, with Child–Pugh A liver function. Their performance status was generally good. Table 2 demonstrates tumor characteristics, including CT parameters, 18F-FDG PET parameters, and radiation dose prescribed. The mean tumor size was 4.5 cm, and mean tumor volume was 120.9 mL. The median value of TSUVmax, TSUVmean, TSUVmax/LSUVmax, and TSUVmax/LSUVmean was 3.5, 2.9, 1.15, and 1.36, respectively. The median prescribed dose was 42 Gy, ranging from 30 to 50 Gy.
Table 3 shows the associations between clinical tumor factors and 18F-FDG PET parameters. Tumor volume (>40 vs. ≤ 40 cm3) and AFP level (>100 vs. ≤100 ng/mL) correlated statistically with 18F-FDG PET parameters. Forty-four percent of tumors showed positive 18F-FDG uptake by visual interpretation. Of them, 11 of 18 patients (61.1%) had a pretreatment AFP level of more than 100 ng/mL, whereas only 3 of 23 patients (13.0%) without visual 18F-FDG uptake had a pretreatment AFP level of more than 100 ng/mL (P = 0.001). In the analysis of associations between tumor volume (>40 vs. ≤ 40 mL) and visual PET (positive vs. negative), TSUVmax (>3.2 vs. ≤ 3.2), and TSUVmax/LSUVmax level (>1.15 vs. ≤ 1.15), all showed significant correlations.
Associations Between Clinical Tumor Factors and 18F-FDG PET Parameters
Tumor Control and 18F-FDG PET Parameters
The median follow-up time was 18 mo. At the time of analysis, 11 of 41 tumors (27%) had recurrence. The 1-, 2-, 3-, and 4-y tumor control rates were 67.0%, 63.3%, 58.4%, and 58.4%, respectively. Table 4 shows the results of the analysis of possible prognostic factors for tumor control after SABR. TSUVmax (>3.2 vs. ≤3.2) and CT/18F-FDG PET score (>4 vs. ≤4) correlated significantly with tumor control. The 4-y control rate was 86.2% in tumors with an TSUVmax of 3.2 or less but was only 37.5% in those with an TSUVmax of greater than 3.2, resulting in a nearly 5-fold increased risk of subsequent local tumor failure in the latter compared with the former. After adjusting factors of sex, AJCC stage, CLIP score, Child–Pugh classification, and tumor volume, tumors with an TSUVmax greater than 3.2 further show a higher risk of tumor failure, with an adjusted hazard ratio of 9.40. CT/18F-FDG PET score (≤4 vs. >4) was also a significant predictor of tumor control after SABR. Tumors with a CT/18F-FDG PET score of more than 4 had a 5.23-fold risk of tumor failure. After adjustment for factors of sex, AJCC stage, CLIP score, and Child–Pugh classification, these tumors had a 4.96-fold risk of failure after SABR, compared with those having a score of 4 or less.
Prognostic Factors on Tumor Control After SABR by Cox Proportional Hazards Model
Figure 1 shows tumor control curves with stratification of visual PET (positive vs. negative), TSUVmax (>3.2 vs. ≤3.2), TSUVmax/LSUVmax (>1.15 vs. ≤1.15), and CT/18F-FDG PET score (>4 vs. ≤4). Of them, TSUVmax and CT/18F-FDG PET score were independent indicators for tumor control.
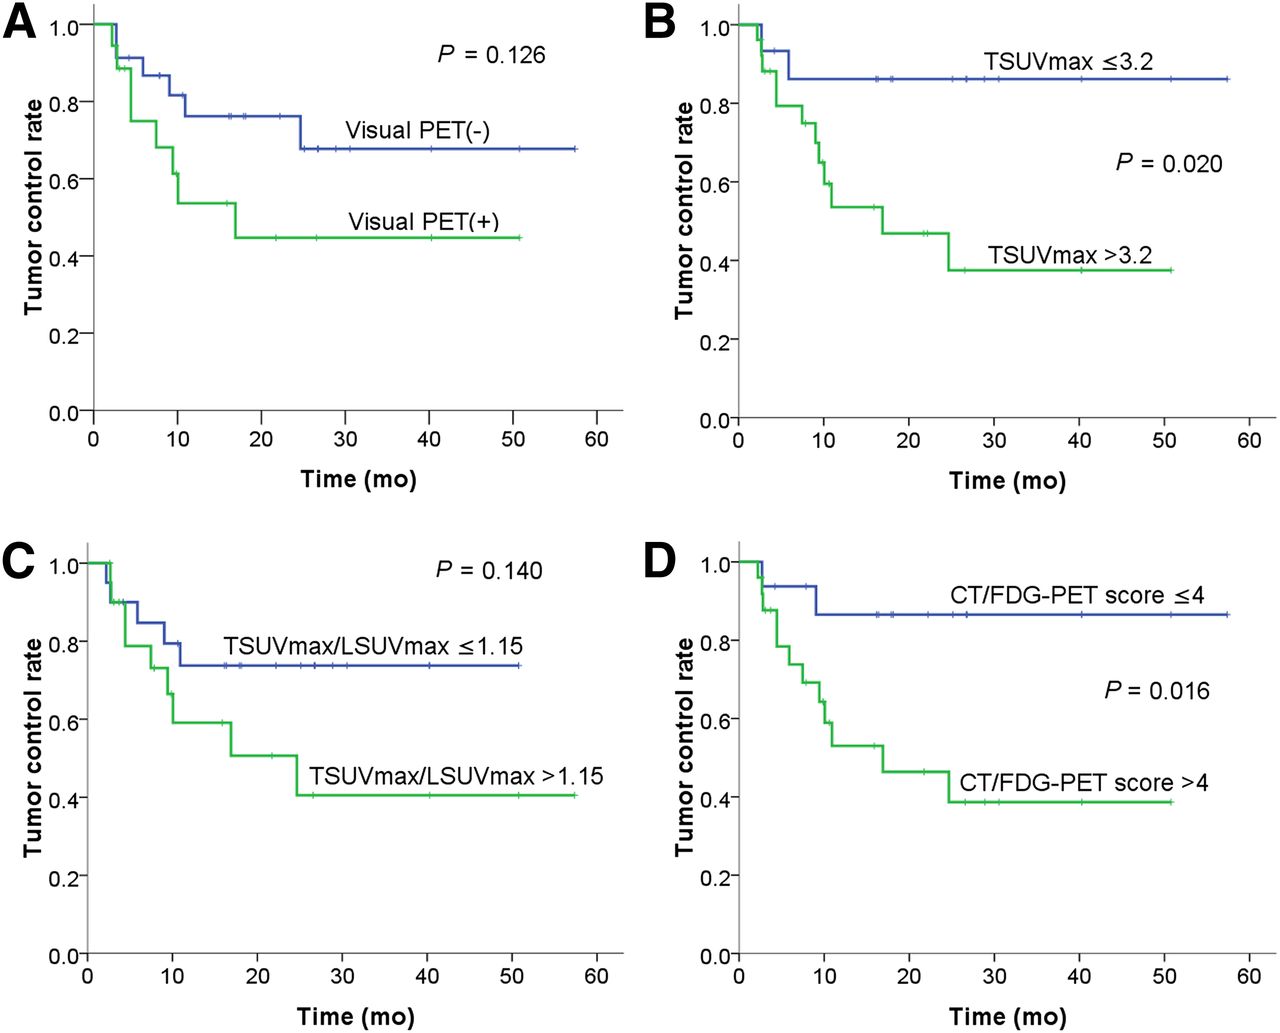
Tumor control curves separated by visual PET (+ vs. −) (A), TSUVmax (>3.2 vs. ≤ 3.2) (B), TSUVmax/LSUVmax (>1.15 vs. ≤ 1.15) (C), and CT/18F-FDG PET score (>4 vs. ≤ 4) (D).
Overall Survival and 18F-FDG PET Parameters
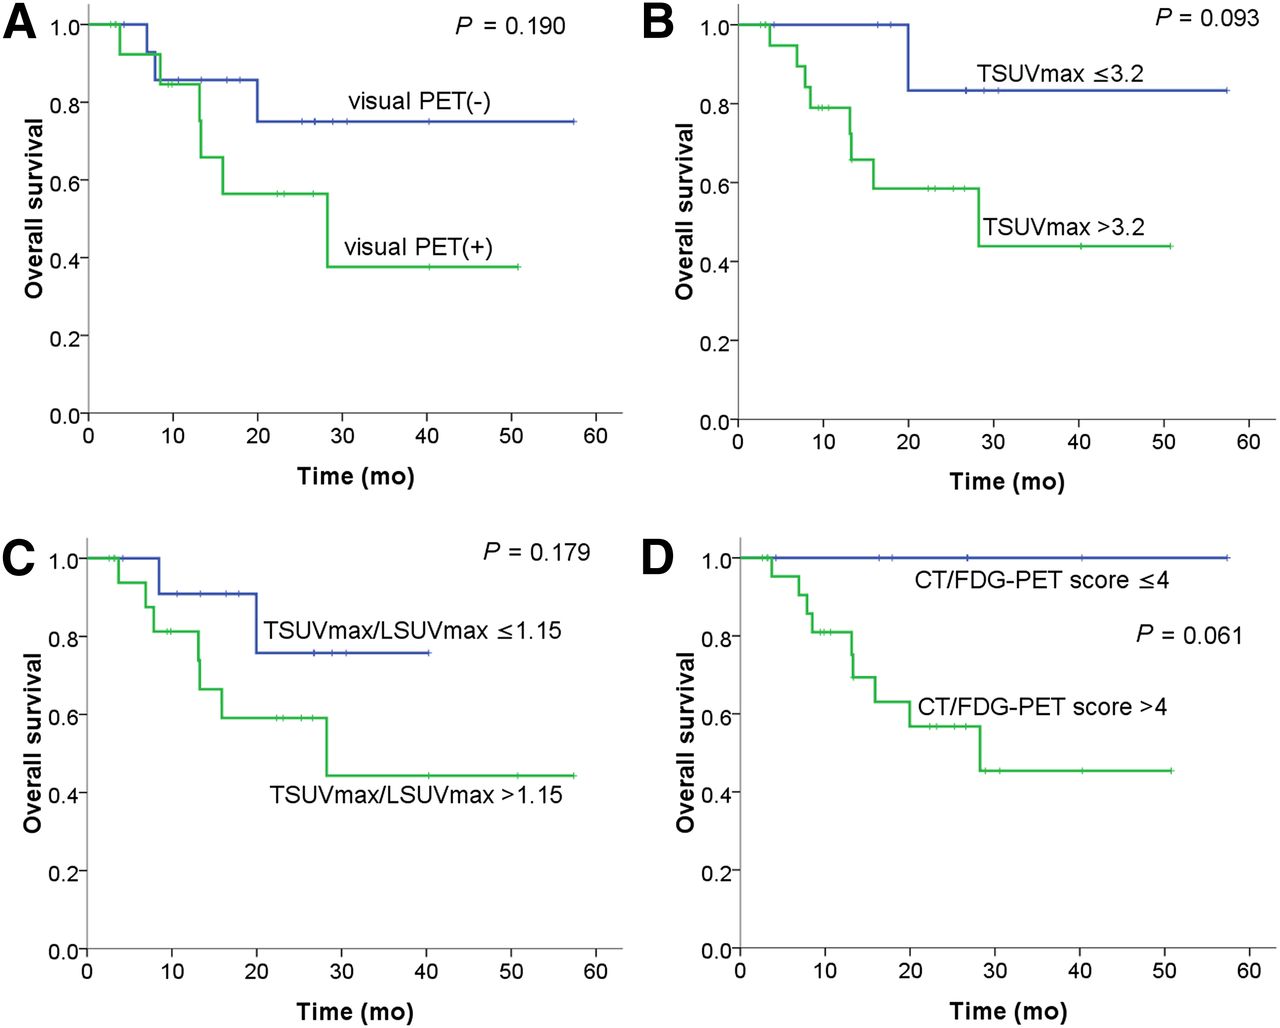
Among 31 patients, 9 patients died and 22 were alive at the time of analysis, resulting in 1-, 2-, 3-, and 4-y overall survival rates of 85.3%, 67.1%, 57.5%, and 57.5%, respectively. Figure 2 shows the overall survival curves of different groups according to different variables and stratifications. Patients with lower TSUVmax, lower TSUVmax/LSUVmax, lower CT/18F-FDG PET score, and negative visual PET had a trend toward a higher overall survival rate, but none was statistically significant. Patients with a TSUVmax level of 3.2 or less had 1-, 2-, and 4-y overall survival rates of 100%, 83.3%, and 83.3%, respectively, whereas the respective rates in those with a TSUVmax level of more than 3.2 were 78.9%, 58.5%, and 43.9%. All patients with a CT/18F-FDG PET score of 4 or less were alive at the last follow-up, whereas only 45.5% of patients with a CT/18F-FDG PET score of more than 4 were alive. Examples of 2 representative cases are shown in Figures 3 and 4.

Overall survival curves separated by visual PET (+ vs. −) (A), TSUVmax (>3.2 vs. ≤ 3.2) (B), TSUVmax/LSUVmax (>1.15 vs. ≤ 1.15) (C), and CT/18F-FDG PET score (>4 vs. ≤ 4) (D).

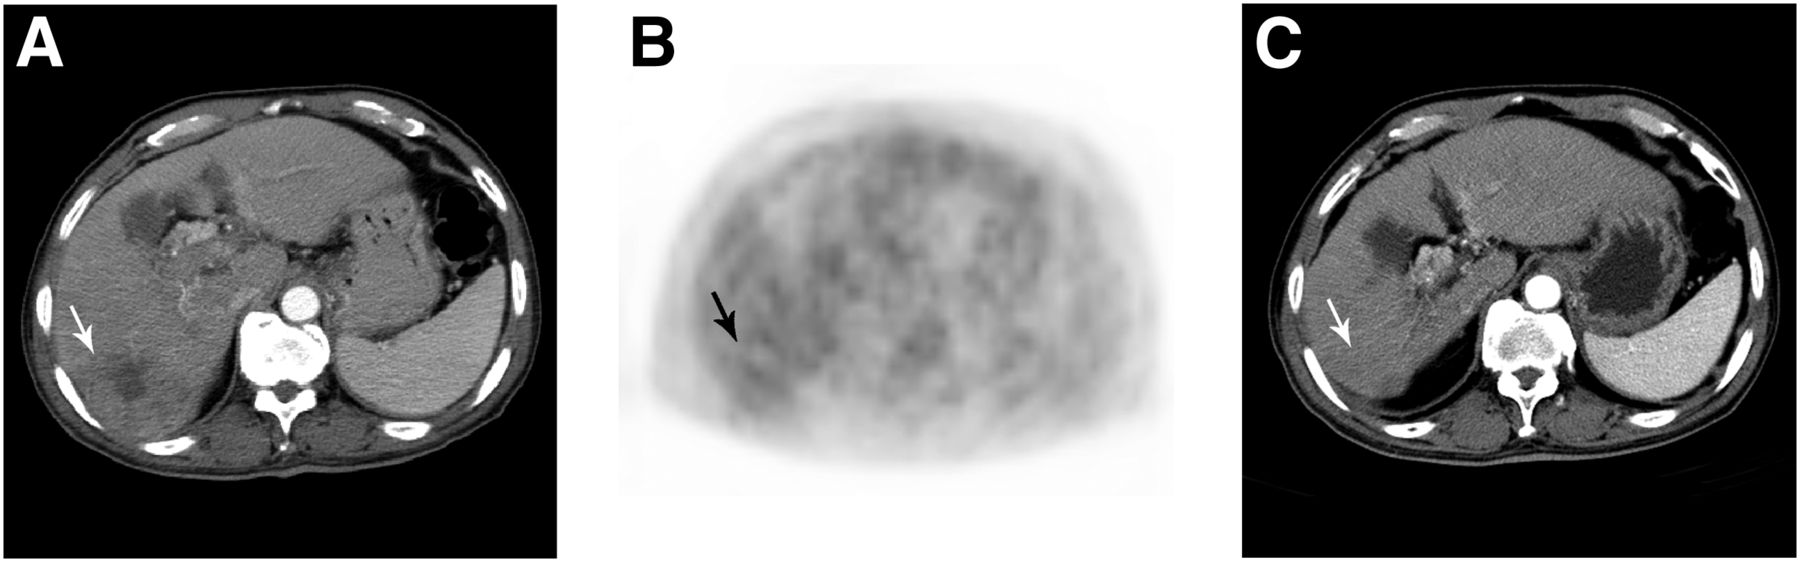
Pretreatment enhanced CT scan (A), PET scan (B), and 7 mo posttreatment enhanced CT scan (C) of tumor (arrow) that was positive on visual PET and had a TSUVmax of 4.3, TSUVmax/LSUVmax of 1.23, and CT/18F-FDG PET score of 6. Patient underwent SABR of 45 Gy in 5 fractions. Tumor recurred at 7 mo after SABR.
Pretreatment enhanced CT scan (A), PET scan (B), and 18 mo posttreatment enhanced CT scan (C) of patient with moderately differentiated HCC (arrow). Visual PET, TSUVmax, TSUVmax/LSUVmax, and CT/18F-FDG PET score were negative, 2.5, 1.04, and 4, respectively. Patient underwent SABR of 33 Gy in 5 fractions. Tumor was well controlled during follow-up.
DISCUSSION
HCC is one of the major public health problems, with an increased incidence globally. It is biologically and clinically heterogeneous, demanding identification of variables that are helpful in predicting disease behavior before therapy. To the best of our knowledge, this was the first study to investigate whether 18F-FDG PET is useful as a prognostic indicator for HCC patients treated with SABR. We find that it seems to be a significant predictor for local tumor control. Tumors with a TSUVmax of 3.2 or less were well controlled by SABR, with a 4-y control rate of 86.2%, whereas the rate was only 37.5% in those with a TSUVmax of more than 3.2. This finding supports our hypothesis that 18F-FDG PET may be a powerful tool to predict tumor control of HCC.
Previous studies of 18F-FDG PET as a prognostic indicator for HCC focused largely on patients who underwent liver transplantation, resection, radiofrequency ablation, and transarterial chemoembolization (14–21). Most of these studies showed that lower 18F-FDG uptake was associated with a better outcome. Lee at el. reported that TSUVmax/LSUVmax level was the most significant variable. Patients with a TSUVmax/LSUVmax level of less than 1.15 had a much higher 1-y recurrence-free survival rate (97% vs. 57%, P < 0.001) (20). Kornberg et al. showed that visual PET (−) was the best pretransplant prognostic factor for recurrence-free survival. Its prognostic power was even stronger than that of the Milan criteria (18). Hatano et al. studied 31 HCC patients who underwent preoperative 18F-FDG PET and concluded that a lower SUV ratio (<2) is significantly associated with longer overall survival after liver resection (5-y overall survival: 63% vs. 29%, P = 0.006) (16).
Kim et al. presented the only publication evaluating the prognostic value of 18F-FDG PET in HCC patients who underwent radiation therapy (22). They retrospectively analyzed 35 HCC patients who were treated with conventionally fractionated radiation therapy with a median total dose of 45 Gy in a daily dose of 1.8–2 Gy. Initial response was determined using the Response Evaluation Criteria in Solid Tumors 1 mo after completion of radiation therapy. A higher SUV ratio (tumor-to-nontumor ratio of SUV) (≥2.5) resulted in a better 1-mo objective response rate (80% vs. 40%, P = 0.015). However, it is still unknown whether a lower SUV ratio can result in long-term tumor control—a more important endpoint than early response rate when we examine the application of SABR in HCC patients.
18F-FDG uptake denotes the degree of glucose metabolism, which often refers to the aggressiveness of the cancer cells. In this study, we used the CT/18F-FDG PET score to include TSUVmax and tumor volume on contrast-enhanced CT. This score appears to be an independent prognostic indicator, with an adjusted hazard ratio of 4.96. However, it does not further enhance the predictive power in comparison with TSUVmax alone. As a result, we found that, among all 18F-FDG PET parameters we analyzed, TSUVmax with a cutoff value of 3.2 was the best indicator of tumor control after SABR.
Accordingly, 18F-FDG PET has great potential for optimizing patient selection and may reduce the side effects and costs of ineffective SABR. For patients with a TSUVmax of more than 3.2, other locoregional or systemic therapies may be considered first. Alternatively, a combination of SABR and other treatment modalities, such as transarterial chemoembolization, alcohol injection, sorafenib, and thalidomide, may be tested in future clinical trials.
TSUVmax can serve as a reference for radiation dose prescription. One of those major unsolved problems regarding the application of SABR in HCC is how much radiation should be delivered to optimize tumor control while limiting toxicity. This study showed that the dose we prescribed (median, 42 Gy; range, 30–50 Gy) resulted in good local control for tumors with a TSUVmax of 3.2 or less. However, those with a TSUVmax of more than 3.2 demonstrated radioresistance at the dose we prescribed. This finding may imply that dose escalation for tumors with a TSUVmax of more than 3.2 is needed to improve tumor killing and will lead to better results.
The major limitation of the present study was that it was a retrospective single-institution study with a small sample size, caused by the fact that PET is not a routine study for HCC to date. Although the use of SABR for HCC has been gaining popularity recently, worldwide only a few institutes perform this novel radiation therapy technique, and the total treatment number is still small.
CONCLUSION
The findings of this study support the use of 18F-FDG PET to predict tumor control for patients with HCC treated by SABR. Among all the 18F-FDG PET parameters we surveyed, TSUVmax with a cutoff value of 3.2 was the best prognostic indicator. SABR for HCC with a TSUVmax of 3.2 or less resulted in a 4-y tumor control rate of 86.2%, whereas the rate was only 37.5% in those with a TSUVmax of more than 3.2. We suggest that the use of 18F-FDG PET may be applicable for patient selection, prognostic prediction, and radiation dose adjustment. A large-scale multicenter clinical trial to evaluate the prognostic role of 18F-FDG PET in HCC patients treated with SABR may be justifiable.
DISCLOSURE
The costs of publication of this article were defrayed in part by the payment of page charges. Therefore, and solely to indicate this fact, this article is hereby marked “advertisement” in accordance with 18 USC section 1734. The study was supported in part by the study projects of TSGH C101-056 and TSGH-C102-055. No other potential conflict of interest relevant to this article was reported.
Acknowledgments
We thank the Cancer Registry of Tri-Service General Hospital for helping with data collection.
Footnotes
↵* Contributed equally to this work.
Published online Aug. 22, 2013.
- © 2013 by the Society of Nuclear Medicine and Molecular Imaging, Inc.
REFERENCES
- Received for publication January 11, 2013.
- Accepted for publication April 30, 2013.


