


Abstract
We report on a radiopharmaceutical imaging platform designed to capture the kinetics of cellular responses to drugs. Methods: A portable in vitro molecular imaging system comprising a microchip and a β-particle imaging camera permitted routine cell-based radioassays of small numbers of either suspended or adherent cells. We investigated the kinetics of responses of model lymphoma and glioblastoma cancer cell lines to 18F-FDG uptake after drug exposure. Those responses were correlated with kinetic changes in the cell cycle or with changes in receptor tyrosine kinase signaling. Results: The platform enabled direct radioassays of multiple cell types and yielded results comparable to those from conventional approaches; however, the platform used smaller sample sizes, permitted a higher level of quantitation, and did not require cell lysis. Conclusion: The kinetic analysis enabled by the platform provided a rapid (∼1 h) drug screening assay.
In vivo molecular imaging assays with a variety of probes for specific biologic processes have been developed for PET. The most common probe in patient care and research, the glucose analog 18F-FDG, is used for imaging and measuring rates of glycolysis. In cancer patients, 18F-FDG assays are used for diagnosing and assessing therapeutic responses (1). About 3,000 molecular imaging probes for PET have been reported for various metabolic and other processes associated with disease states (1).
In vitro metabolic assays with radiolabeled probes have been adapted to 96-well plates and microchip formats (2). We explore here the use of such assays for quantitating the kinetics of cellular responses to targeted drugs. A microfluidic chip (the RIMChip) was coupled to a β-particle imaging camera (2–4) to form a Betabox. The Betabox was designed for quantitative analysis of the metabolic responses of small numbers of cells to pharmaceuticals. Most assay steps were similar to those of standard 96-well plate radioassays, but the Betabox assay required far fewer cells, permitted quantitation of the signal per cell, and used live cells. The platform was validated for various adherent and suspended cancer cells. We characterized the influence of the monocarboxylate transporter 1 (MCT-1) protein as well as a glycolytic inhibitor on 18F-FDG uptake in isogenic liposarcoma cells. Using different liposarcoma cells, we investigated the influence of deoxycytidine kinase (dCK) (5) on uptake of the deoxycytidine analog molecular imaging probe 1-(2′-deoxy-2′-18F-fluoroarabinofuranosyl) cytosine (18F-FAC) (6).
We next explored how certain cancer cell lines responded to 2 mechanistically distinct targeted inhibitors. We quantitated the kinetics of the response of liposarcoma cells to gemcitabine (7) by correlating cell cycle arrest with 18F-FDG uptake. We also quantitated the kinetic response of model glioblastoma multiforme cancer cells to an epidermal growth factor receptor (EGFR) inhibitor by correlating changes in 18F-FDG uptake with the levels of phosphoproteins associated with EGFR signaling. Glucose consumption consistently provided a rapid (∼30 min) indicator of a positive therapeutic response, and the Betabox platform provided a simple tool for quantitating the kinetics.
MATERIALS AND METHODS
Betabox Platform
The RIMChip design and fabrication process required standard photolithography and elastomer molding methods, as described in the supplemental materials (supplemental materials are available at http://jnm.snmjournals.org). The β-particle imaging camera has been described elsewhere (3). For this work, the camera was miniaturized to be portable and simple to operate. The Betabox was assembled by mounting the RIMChip directly onto the camera face.
Cell Sample Preparation, Viability, and Cell Cycle Assays
Liposarcoma cell lines LPS1 and LPS2, with dCK and MCT-1 knockdowns, respectively, were derived from patient samples. Lentivirus-based, small hairpin RNA–mediated knockdowns of MCT-1 and dCK were described previously (8). The murine leukemic lines (L1210-wt and L1210-10K) (9) were kind gifts from Charles Dumontet (Université Claude Bernard Lyon I, Lyon, France) (10). The human lymphoma line CEM was purchased from the American Type Culture Collection (CCL-119); the subline, CEM/dCK, was generated via selection with ara-C (11) and was a gift from Margaret Black (Washington State University). A human leukemia T-cell line (Jurkat T) was purchased from the American Type Culture Collection. The human glioblastoma cell line U87 EGFRvIII/PTEN was prepared as described previously (12). A LIVE/DEAD Viability/Cytotoxicity Kit (Invitrogen) was used to distinguish live cells from dead cells. For the cell cycle assay, 2 × 10⁶ cells were collected and washed with phosphate-buffered saline. DNA content was determined through staining with propidium iodide (50 μg/mL; Sigma) for L1210 cells or a bromodeoxyuridine kit (R&D Systems) for U87 EGFRvIII/PTEN cells. Data were acquired with 4- and 5-laser LSRII cytometers (BD Biosciences) and analyzed as previously described (13).
Betabox Radioassay
Cells were prepared at a concentration of 3 × 10⁶ cells/mL and injected into the RIMChip. For adherent cells, the microchannels were coated with fibronectin. For the kinetics studies, 5 mM 2-deoxyglucose (Sigma), 10 μM gemcitabine, or 5 μM erlotinib in RPMI 1640 medium or Dulbecco modified Eagle medium supplemented with 10% fetal bovine serum was added to the cells for a designated period. After 4 h of incubation in a CO2 incubator at 37°C, phosphate-buffered saline was flushed through the RIMChip to remove unattached cells. The radiolabeled imaging probe (18F-FAC or 18F-FDG) was pipetted into the RIMChip microchannels, and the RIMChip was incubated for 30 min, flushed with phosphate-buffered saline twice, and then incubated with Hoechst 33342 (1 μg/mL) in Dulbecco modified Eagle medium supplemented with 10% fetal bovine serum and 1% penicillin-streptomycin. Finally, the Betabox was assembled for the imaging measurement. Cell numbers were determined by use of a Nikon Eclipse Ti microscope with the 4′,6′-diamidino-2-phenylindole channel.
Off-chip Radioassay
About 105 cells were seeded into a 12-well plate, and the radiopharmaceutical (18F-FAC or 18F-FDG at 0.37 MBq/mL) was added to the cells. The radioactivity of the lysed cells was measured with a γ counter. Detailed procedures are described in the supplemental materials.
Phosphoprotein Assay
Confluent petri dishes containing 5 × 10⁶ cells were prepared. Lysis buffer (Cell Signaling) with a protease inhibitor (Roche) and a phosphatase inhibitor (Sigma) was prepared according to the manufacturer’s instructions. After cell lysis, the protein concentrations in cell lysates were quantified with a bicinchoninic acid kit (Pierce). A panel of phosphoproteins from the lysates was assayed with a multiplex antibody array (14) and sandwich-type enzyme-linked immunoassays. All proteins in the panel were measured simultaneously in each sample. The biomolecular reagents used are listed in Supplemental Table 1.
Data Processing
The counts of β particles emitted from each cell capture chamber were normalized to the counted cell numbers to reflect the uptake of the radiolabeled imaging probe per cell (supplemental materials).
RESULTS
Each RIMChip (Fig. 1) permitted 4 repeats of 5 independent assays. Each assay microchannel inlet contained a bubble depletion chamber and a debris-trapping filter (Figs. 1A and 1B and Supplemental Fig. 1). These permitted the use of standard micropipetting for cell and reagent introduction. The 50-μm separation between the cell capture chamber floor and the camera yielded an 11-fold increase in the signal level relative to that in a previous design (2), in which a microscope cover slip was used as the chamber floor. Fibronectin coating of the microchannel surfaces promoted attachment and spreading of the adherent cells (Supplemental Fig. 2) but did not influence the uniformity of cell loading or 18F-FDG uptake (Supplemental Figs. 3 and 4). Suspended cells were found to attach to the untreated hydrophobic polydimethylsiloxane surface (Supplemental Fig. 4).

RIMChip design, operation, and Betabox performance. (A) Each RIMChip microchannel represents separate assay condition and permits 4 repeats per condition. Bubble depletion chamber and postprocessing filter are incorporated at each microchannel inlet. Drawings (not to scale) (B) and photographs (C) of cell capture chamber. Cell suspension is injected through inlets. Adherent cells attach to bottom of fibronectin-treated microwells. Waffle structure walls provide structural integrity and prevent cells from being disturbed by flowing solutions. (D) Photograph of RIMChip and sample Betabox radioassay revealing signal from 4-microchamber microchannel. (E) Statistics of cell loading (shown at 2 stages of Betabox assay) and statistics of radioassay signal, averaged over cells with chambers (S) and those without chambers (N). Bar heights and uncertainties are calculated with 4 cell capture chambers associated with given microchannel.
Cells within each cell capture chamber were counted (Fig. 1C) before and after the radioassay to permit per-cell quantitation of the radioassay results. Cell loading and 18F-FDG uptake exhibited approximately 8% variations across the different cell capture chambers associated with a single microchannel. For T-cell assays (Fig. 1E), chambers with approximately 70–110 cells exhibited approximately a 30-fold-higher signal than chambers with 0 cells (control chambers).
In proof-of-principle Betabox radioassays, the glycolytic or nucleoside salvage pathways in isogenic adherent liposarcoma cell lines were genetically or molecularly manipulated (Fig. 2). We altered MCT-1 levels through the stable expression of small hairpin RNA and examined the resulting changes in 18F-FDG uptake (Fig. 2A). In these cells, MCT-1 enhanced glycolytic flux, so that knockdown of MCT-1 should have resulted in a reduction in 18F-FDG uptake. The RIMChip assays detected a 35% relative decrease in 18F-FDG uptake in MCT-1 knockdown LPS2 cells relative to wild-type LPS2 cells. The conventional assays revealed a 12.5% reduction (Fig. 2A). Introduction of the glycolytic inhibitor 2-deoxyglucose resulted in a stronger (3- to 10-fold) repression of 18F-FDG uptake, as recorded in the RIMChip and bulk assays (Fig. 2B).
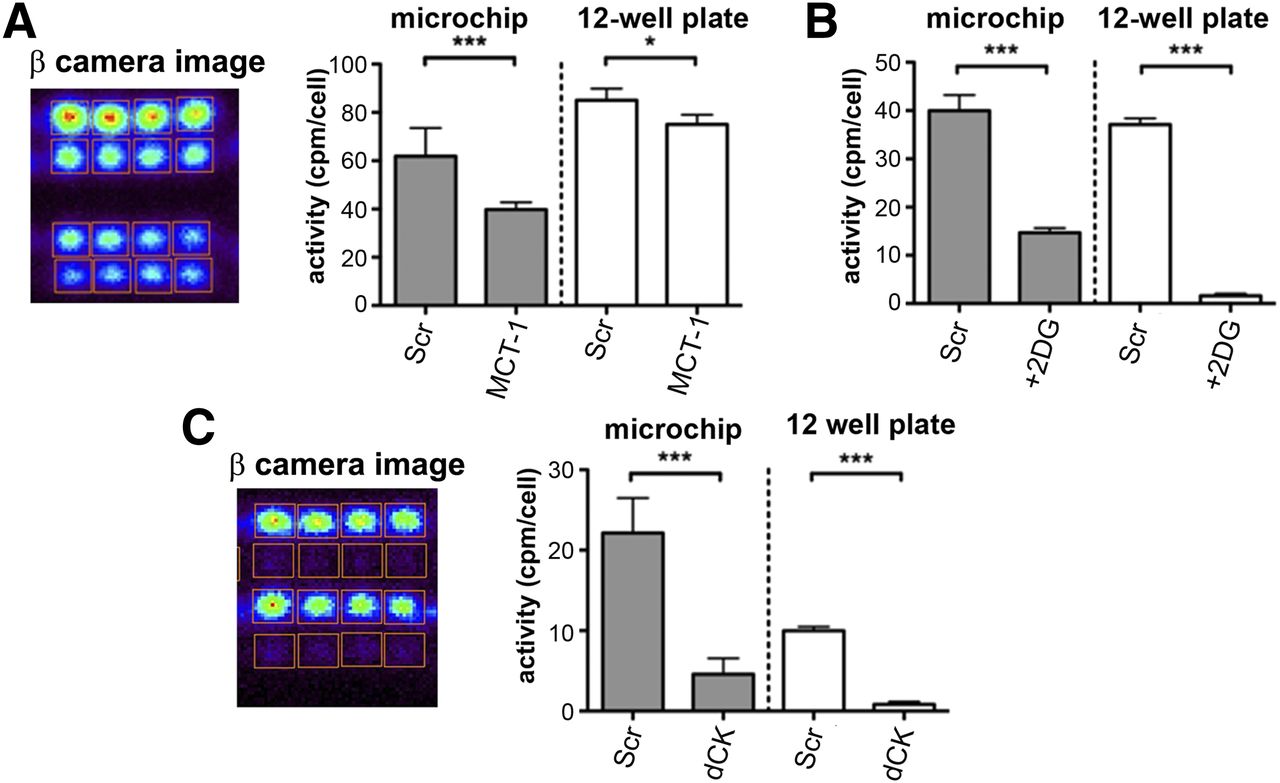
Validation of RIMChip through genetic and molecular manipulation of glycolytic flux and nucleoside salvage activity in Betabox assays, with comparisons against standard assays. (A) 18F-FDG uptake Betabox radioassays of wild-type LPS2 cells (Scr) and MCT-1 knockdown LPS2 cells (MCT-1). Betabox data uncertainties reflect statistics from 16 microchambers (8 microchambers from 2 RIMChips) of measurements for each cell line. Image from β-particle imaging camera is of one such assay; middle row is 0-cell control. (B) 18F-FDG assays of same cells showing influence of glycolytic inhibitor 2-deoxyglucose (+2DG). (C) 18F-FAC uptake Betabox radioassays of wild-type and dCK knockdown LPS1 cells. Microchambers containing dCK knockdown cells are in rows 2 and 4 from top; row 5 is control. Error bars represent SEMs. *P = 0.05. ***P = 0.001.
Certain liposarcomas exhibit nucleoside salvage activity, which can be imaged with the nucleoside analog 18F-FAC (8). 18F-FAC is a substrate for the enzyme dCK; therefore, dCK knockdown should result in decreased 18F-FAC uptake. The third Betabox validation study supported this hypothesis (Fig. 2C).
The Betabox was also used for interrogating the kinetics of cellular responses to targeted therapies. All time points in a given kinetics run were imaged simultaneously for easy comparisons. The influence of gemcitabine on L1210-wt leukemia cells was studied first. Gemcitabine is an anticancer prodrug nucleoside analog that will impede the cell cycle in dCK-positive tumors (9). Because glucose metabolism can help fuel the cell cycle, we reasoned that gemcitabine treatment could influence both 18F-FDG uptake and the cell cycle. Indeed, 18F-FDG uptake decreased on cell exposure to gemcitabine, with first-order kinetics and a half-life of approximately 30 min (Fig. 3A). Cell cycle arrest exhibited similar kinetics (half-life, ∼50 min) and lagged about 25 min behind changes in 18F-FDG uptake (Supplemental Figs. 5 and 6).
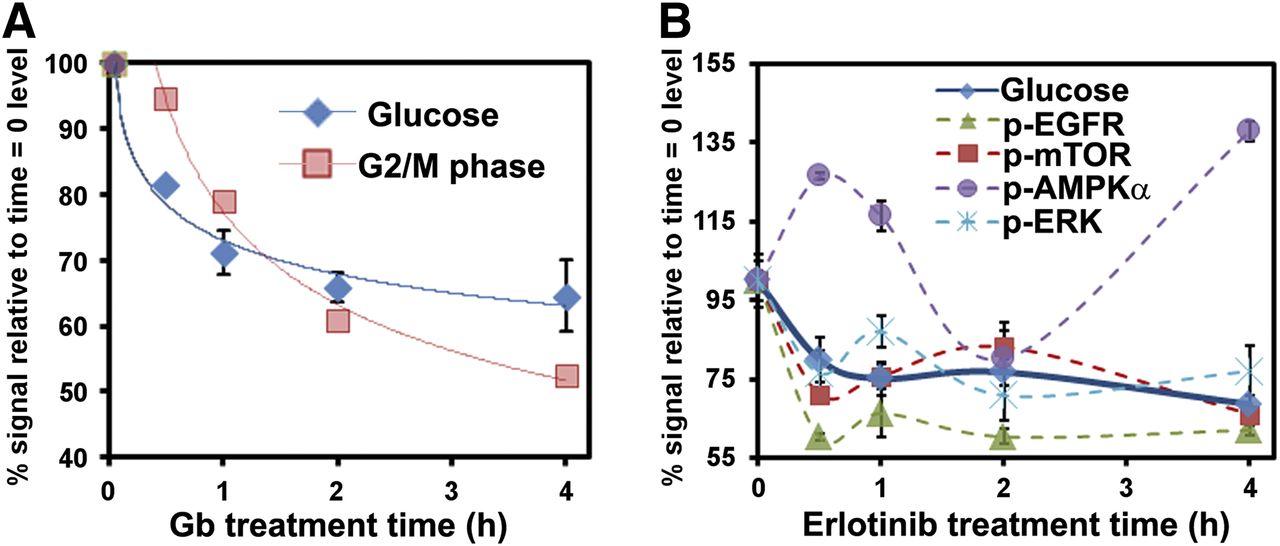
Betabox assays, correlated with other functional assays, for gauging responses of cancer cells to targeted drugs. For these plots, y-axis is percentage of initial level (defined at time zero) to allow for all data to be corepresented on same plots. (A) Kinetics of 18F-FDG uptake and cell cycle arrest (measured by flow cytometry) after gemcitabine (Gb) treatment of L1210-wt leukemia cells. Solid lines are first-order kinetic fits. (B) Comparison of kinetics of 18F-FDG uptake and dynamics of phosphoprotein levels within receptor tyrosine kinase signaling pathway of U87 EGFRvIII/PTEN glioblastoma multiforme cells on erlotinib treatment. Lines connecting data points are provided to guide readers. Error bars indicate average values from 3 repeat assays. p-AMPKα = phosphorylated AMPKα; p-EGFR = phosphorylated EGFR; p-ERK = phosphorylated Erk; p-mTOR = phosphorylated mTOR.
A second class of targeted drugs is aimed at blocking growth factor signaling of receptor tyrosine kinases. For example, the adenosine triphosphate–competitive EGFR tyrosine kinase inhibitor erlotinib blocks wild-type and mutant EGFR (EGFRvIII) signaling, inhibiting the phosphorylation of kinases that represent downstream effectors of EGFR (15,16) and thus inhibiting the growth of PTEN-expressing glioblastomas (12). An activated growth factor signaling pathway implies energy flux through that pathway, so we reasoned that inhibiting that pathway would likely reduce cellular glucose consumption. Thus, we treated EGFRvIII- and PTEN-expressing model glioblastoma multiforme cell lines with erlotinib and measured 18F-FDG uptake kinetics as well as the levels of a panel of phosphoproteins that are downstream effectors of EGFR (Fig. 3B and Supplemental Fig. 7). The full panel of assayed proteins is provided in Supplemental Table 1. Again, 18F-FDG uptake decreased sharply within 30 min, but the kinetics yielded behavior reminiscent of that of a damped oscillator. Interestingly, this oscillatory behavior was reflected in the changing levels of the assayed phosphoproteins. The protein phosphorylated adenosine monophosphate–activated protein kinase functions as an energy regulator within cells (17). Its level appears to initially oscillate out of phase with 18F-FDG uptake, implying a compensatory mechanism for the loss of glucose consumption. The levels of phosphorylated EGFR, phosphorylated Erk, and phosphorylated mTOR oscillated mostly in phase with each other and were partially synchronized with changes in 18F-FDG uptake. The amplitude of the changes in the levels of a given phosphoprotein may reflect its proximity to EGFR in the receptor tyrosine kinase signaling pathway. For example, phosphorylated EGFR itself exhibited the largest-amplitude response, and phosphorylated mTOR exhibited the weakest response. Over the course of the 4-h drug treatment window, the cell cycle was relatively unaffected (Supplemental Fig. 8).
DISCUSSION
The comparisons between the Betabox assay and the 12-well plate (bulk) assay (Fig. 2) revealed qualitative, but not fully quantitative, agreement between the 2 approaches. A concern might be that because of the relatively small number of cells in the RIMChip assay, the corresponding statistical spread of results would be significantly larger than in the bulk assay. However, this spread, which should scale as the square root of the numbers of cells, was not large. For the comparisons shown in Figure 2, 4 microchannels, each with 4 microchambers per channel, and 100 cells per microchamber yielded an error of 2.5%; the error expected for a bulk assay (∼50,000 cells) was approximately 0.5%. Cell counting errors for the RIMChip assay might add a few additional percentages, as would experimental errors in manipulating cells for the bulk assay. Small variations in the 50-μm-thick polydimethylsiloxane membrane separating the cells from the camera could also contribute a few percentages to the error. However, given that the 2 techniques had independent sources of error and that the number of cells in the RIMChip assay was approximately 50-fold smaller, the agreement between the 2 techniques was good. There is a flow cytometry–based assay that uses a fluorophore-labeled 18F-FDG analog, but recent literature (18) has called into question the validity of that assay; therefore, we did not use it for our comparisons.
The kinetic responses shown in Figure 3 revealed that the 18F-FDG RIMChip assay provided a rapid (<1 h) tool for detecting the responses of small numbers of cells to therapy. However, the assay also revealed different response kinetics for different cell lines and drugs. An exact resolution of such responses can be accomplished by capturing either the dynamic trajectories of individual cells (19) or the fluctuations of the functional proteins at the single-cell level (20). Obviously, the RIMChip assay does not resolve such trajectories or fluctuations, but the cited literature can provide some insight into the observed responses. For example, the first-order relaxation kinetics observed for the response of the L1210-wt leukemia cells to gemcitabine exposure was consistent with a transition between 2 distinct, steady-state descriptions of those cells. An alternative explanation, which we could rule out on the basis of our observations, was that gemicitabine exposure killed a fraction of the cells. No dead cells were detected during the course of the experiment. The oscillatory dynamics observed for the erlotinib-treated glioblastoma multiforme cells implied that competing networks influenced the kinetics. The overall results might be the same—that is, the cells were switching between 2 states—but if that is the case, the new steady state was not reached during the 4-hour erlotinib treatment time. Again, however, no dead cells were detected during the course of the experiment.
CONCLUSION
The Betabox platform, comprising a microfluidic chip (the RIMChip) mated to a β-particle imaging camera, enables robust, user-friendly execution of sensitive and quantitative cell-based radioassays. Each radioassay requires approximately 100 cells. Betabox radioassays provide a useful and rapid screening platform for investigating the responses of various cell lines to mechanistically distinct, targeted drugs. The Betabox platform provides a rapid screening tool for a variety of drug and cell line combinations as well as a powerful tool for mechanistic investigations.
DISCLOSURE
The costs of publication of this article were defrayed in part by the payment of page charges. Therefore, and solely to indicate this fact, this article is hereby marked “advertisement” in accordance with 18 USC section 1734. This work was funded by the National Cancer Institute (5U54 CA119347, to James R. Heath), the National Institute of Neurological Disorders and Stroke (NS 73831, to Paul Mischel), the Ben and Catherine Ivy Foundation, and the Department of Energy (DE-SC0001249). Kiwook Hwang acknowledges the Samsung Foundation for a fellowship. Some of the authors (Caius Radu, Arion F. Chatziioannou, Michael E. Phelps, and James R. Heath) have ownership in Sofie Biosciences, which has rights to the 18F-FAC probe. No other potential conflict of interest relevant to this article was reported.
Acknowledgments
We thank David Baltimore for access to the Nikon Diaphot 200 fluorescence microscope.
Footnotes
↵* Contributed equally to this work.
Published online Aug. 26, 2013.
- © 2013 by the Society of Nuclear Medicine and Molecular Imaging, Inc.
REFERENCES
- Received for publication December 20, 2012.
- Accepted for publication May 14, 2013.


