


Abstract
The renin angiotensin system (RAS) has been implicated as one mediator of the cardiovascular effects of estrogen. Since changes in angiotensin type 1 (AT1) receptor expression are central to modulation of the RAS, we used the noninvasive PET imaging technique to study for the in vivo effects of estrogen on membrane and intracellular AT1 receptors. Methods: Dynamic PET measurements of canine AT1 (cAT1) receptors using the radiolabeled AT1 receptor antagonist, 11C-L-159,884, were performed during 2-wk consecutive periods of estrogen deprivation induced by ovariectomy and 17β-estradiol (E2) replacement. Results: Kinetic modeling of time-activity curves in the kidney and adrenal showed lower receptor expression in the estrogen replete state (21% and 30% decrease in Gjedde-Patlak slope, influx constant, respectively). These in vivo findings correlated with in vitro radioligand-binding assays with 125I-[Sar1,Ile8]angiotensin II showing reduced AT1 receptor number in the adrenal (35%), glomeruli (30%), myocardium (35%), and liver (21%) in the estrogen-replenished compared with estrogen-depleted animals. Conclusion: Although other endogenous systems are known to regulate AT1 receptors and could compete with estrogenic actions, these PET studies reveal that estrogen attenuates AT1 receptor expression in vivo. Thus, estrogen modulation of AT1 receptors may contribute to the cardiovascular protective effects associated with estrogen.
- estrogen
- renin angiotensin system
- PET
- AT1 receptor
- angiotensin receptor
- estrogen
- hormone replacement therapy
- adrenal
- kidney
- heart
- liver
- regulation
- expression
Experimental research in rats suggests that estrogen administration inhibits the activity of the renin angiotensin system (RAS). Estradiol (E2) treatment lowers tissue levels of angiotensin II (Ang II) (1), most likely by its inhibitory action on angiotensin-converting enzyme (ACE) (2), which converts the inactive decapeptide, Ang I, into the active hormone, Ang II. Ang II is the key mediator of the metabolic and cardiovascular actions of the RAS and mediates its actions by binding to angiotensin type 1 (AT1) receptors in various target tissues in animals and humans (3). E2 attenuates the tissue responsiveness to Ang II action (4), most likely by its inhibitory effects on the number of AT1 receptors in target tissues (5). E2 treatment also augments the vasodilator effects of angiotensin1–7 (6).
So far, investigation of the interaction between estrogen and the RAS in humans has been limited to assessing changes in the circulating RAS components (7,8). These studies show that estrogen administration leads to an increase in plasma levels of angiotensinogen and plasma renin activity (PRA) (7), indicating that estrogen activates some components of the human RAS cascade. However, estrogen treatment also produced a reduction in ACE (8). These studies suggest that, even though some of the upstream components of the RAS cascade are activated, the overall effect of estrogen is to attenuate the activity of the AT1 receptor, the key effector of Ang II action in its target tissues. Until now, the effect of estrogen on AT1 receptor expression in humans (hAT1) or any other species that has only one known functional subtype of the AT1 receptor has not been reported.
In this study, we examined the effect of estrogen on canine AT1 (cAT1) receptor expression since the cAT1 and hAT1 receptors share many similar structural and regulatory elements (9,10). We used the noninvasive PET imaging technique to study the effects of estrogen on membrane and intracellular AT1 receptors in an in vivo setting that has the advantage of encompassing other endogenous systems that may regulate AT1 receptor action (11,12). PET measurements of cAT1 receptor expression in the kidney and adrenal of adult female beagles were performed during periods of estrogen deprivation and estrogen replacement in the same animal. At the end of the in vivo studies, organs were harvested and AT1 receptor numbers in target tissues, including the kidney, adrenal, heart, and liver, were determined by an in vitro radioligand-binding assay. Levels of circulating components of the RAS as well as serum and urine electrolytes were also measured under these conditions.
MATERIALS AND METHODS
Animal Protocol
The Animal Care and Use Committee of The Johns Hopkins Medical Institutions and Georgetown University approved the experimental guideline and protocol. Eight adult premenopausal female beagles (average weight, 11.6 kg) were used in the study. The animals were allowed an initial period of 1 wk to acclimatize to the animal holding area. They were fed a special standardized diet (H/D diet; Hill’s Pet Nutrition) enriched with normal daily salt intake (60 mEq/d total NaCl) and allowed water intake ad libitum throughout the duration of the study.
After 1 wk of acclimation, bilateral oophorectomy was performed on all dogs. Briefly, after premedication with acepromazine (0.03–0.05 mg/kg), anesthesia was induced with thiopental (10–20 mg/kg) and maintained with isoflurane. After standard skin preparation, an abdominal midline surgical incision was made. Using the uterus as a guide, the ovaries were identified and exteriorized. The vascular supply was identified, laid open, and ligated in between clamps, after which the 2 ovaries along with the ligaments were delivered in 1 piece. Complete removal of the ovaries and uterus was confirmed by ex situ serial sectioning and visual inspection. The incisions were closed in a routine fashion and the procedures were well tolerated by all animals.
While observing aseptic precautions, a slow-release E2 pellet (17β-estradiol, 25 mg per pellet, 21-d slow release; Innovative Research of America) was introduced into the subcutis through a stab incision placed over the right inferior border of the rib cage. To facilitate future removal, the pellet was maneuvered to sit directly on the rib before closing the skin.
After oophorectomy, the dogs were divided into 2 treatment groups. One group had immediate E2 replenishment lasting for 2 wk followed by another 2 wk without E2 (on-off model). The second group remained E2 deficient for the initial 2 wk after surgery and was thereafter placed on E2 replenishment for 2 wk (off-on model). In each animal, renal and adrenal AT1 receptor levels were assessed in vivo with PET imaging after 2-wk periods of E2 replacement as well as after 2-wk periods of E2 deficiency.
Imaging and Image Analysis
Animal preparation for PET involved fasting for at least 12 h before imaging but free water intake was allowed. Serum and plasma samples were collected before PET study for estimation of electrolytes (Na, K, Cl), blood urea nitrogen (BUN), creatinine, aldosterone, and PRA.
The radioligand 11C-L-159,884 (N-[[4′-[(2-ethyl-5,7-dimethyl-3H-imidazo[4,5-B]pyridine-3-yl)methyl][1,1′-biphenyl]-2-yl]sul-fonyl]-4-methoxybenzamide) was synthesized according to Hamill et al. (13). PET studies were performed in animals under pentobarbital anesthesia with a General Electric 4096+ (GE Medical Systems) as described previously (14). The in-plane-cross-plane resolution of this scanner is 6-mm full width at half maximum. The average injected dose was 552 ± 32 MBq (14.9 ± 0.9 mCi) at an average specific activity of 71 ± 40 GBq/μmol (2,206 ± 836 mCi/μmol). After performing a transmission scan with a 370-MBq (10 mCi) 68Ge pin source, the radioligand was injected intravenously as a slow bolus of 5- to 10-s duration and the following image sequence of the mid abdomen was acquired: four 15-s frames, three 1-min frames, three 5-min frames, three 10-min frames, and one 20-min frame. Since the images were reconstructed with a ramp filter, the spatial resolution of the PET scans was 6 mm.
To obtain tissue activity curves, regions of interest (ROIs) were defined to include the left renal cortex and left adrenal, which was shown to generate more reproducible results than the right side where partial-volume effects from the liver are significant (15).
Pixels with >30% of maximal renal cortical (or adrenal) activity were included in the ROIs. The obtained time-activity curves were corrected for radioisotope decay and were expressed in Bq/mL/MBq (nCi/mL/mCi) injected dose. ROIs were defined on all slices showing the adrenal and the kidney. The kidney cortex was easily identifiable and separable from the medulla. In contrast, it was impractical to separate the adrenal cortex from the adrenal medulla. Thus, the kidney ROI included only the cortex, whereas the adrenal ROI included both the cortex and medulla. Therefore, tissue radioactivity concentration was analyzed in the renal cortex, whereas total tissue activity was analyzed in the entire adrenal gland (Fig. 1).

Accumulation of 11C-L-159,884 in kidney and adrenal 55–95 min after injection (left image) and ROIs of left kidney and left adrenal gland (right image). ROIs were defined on all image slices showing organs. ROI of kidney included only renal cortex (C), whereas ROI of adrenal included entire gland (A).
Plasma radioactivity was measured in 0.3 mL arterial blood collected every 5–8 s during the first 2 min after injection and at increasing time intervals thereafter. Five additional samples (2 mL) were collected at 5, 15, 30, 60, and 90 min after injection for determination of radioligand metabolites by high-performance liquid chromatography (HPLC). Plasma radioactivity was cross-calibrated with the PET scans, corrected for decay and expressed in Bq/mL/MBq (nCi/mL/mCi) injected dose. The plasma curve was also corrected for metabolites by multiplying with the unmetabolized fraction obtained by HPLC. Since the average number of data points for the uncorrected input function was 35 compared with only 5 data points for HPLC, the percentage of unmetabolized ligand at the 35 time points was calculated by biexponential curve fitting of the 5 HPLC measured values.
This was different from the previous study (14) in which the missing points of the unmetabolized tracer were estimated by a monoexponential fit. Not only the addition of 1 more sample but also the significantly lower variance of the measurements with the recently published new technique (16) contributed to this more accurate fit.
Organ uptake of 11C-L-159,884 was quantified by graphical (Gjedde-Patlak) analysis (14) using the last 6 data points of the graphical plot. The radioligand influx constant Ki was used as outcome measure. The measurements were not corrected for tissue density; therefore, Ki was expressed in units of mL/min/mL.
In Vitro Measurements
PRA was determined by radioimmunoassay (Angiotensin I [125I] RIA Kit; Perkin Elmer) on 100-μL plasma samples in quadruplicate from blood collected in the presence of ethylenediaminetetraacetic acid (EDTA) (8.55 mg K3EDTA), at days 0, 15, and 30. The standard range of the assay was 0.1–10 ng/mL; the PRA was expressed as ng/mL/h of generated Angiotensin I. Quality control of the assay was ensured by using 3 serum controls (Lyphochek Hypertension Markers Control; Bio-Rad).
Aldosterone was determined by radioimmunoassay (Coat-A-Count Aldosterone; Diagnostic Product Corp.) on 200-μL plasma samples in duplicate from blood collected in the presence of heparin (100 U heparin). The standard range of the assay was 25–1,200 pg/mL. Quality control of the assay was ensured by using 3 serum controls (Multivalent Control Module; Diagnostic Product Corp.).
On day 30, the animals were killed and the tissues were removed to quantify AT1 receptor number by radioligand-binding assay. The glomeruli, adrenal glands, hearts, and livers from each dog were homogenized and membranes were isolated as previously described (12,17). AT1 receptor numbers were determined in radioligand saturation experiments using 125I-[Sar1,Ile8]Ang II as the radiolabeled ligand. Radioactivity was measured in a Beckman γ-counter. The maximum number of binding sites (Bmax) was calculated from Scatchard plots using the program PRISM (GraphPad Software Inc.) and was expressed as fmol/mg of protein (12).
Statistical Analysis
Results were expressed as mean ± SEM. Since identical animals were used for the on and off E2 measurements, differences in Ki values were tested using the paired unequal variance, t test. A regular Student t test was used to analyze Bmax, PRA, and aldosterone changes in response to ovariectomy and E2 treatment. For both types of tests, P < 0.05 was considered statistically significant. No corrections were applied for testing differences of multiple parameters. Due to lack of a normal distribution, the plasma levels of E2 and aldosterone were compared using the nonparametric Kruskal-Wallis test.
RESULTS
Arterial blood pressure monitoring showed that E2 depletion caused a marginal and statistically insignificant increase in average systolic and diastolic blood pressure from 130/74 ± 6/3 mm Hg on E2 to 138/77 ± 6/3 mm Hg off E2.
Serum levels of Na+, K+, HCO3, BUN, and creatinine measured in all animals were within the normal reference range during both phases of treatment (Table 1). Similarly, estimation of urine electrolytes and osmolality revealed values within the normal reference range (Table 1). Nonetheless, reduction in urinary excretion of Na+, K+, and urine osmolality with E2 administration was observed; however, due to a large variance of these parameters, only the differences in urine osmolality were statistically significant.
Vital Signs, Urine, and Serum Electrolytes During Estrogen-Deficient and Estrogen-Replete Phases of Study
PRA and plasma levels of E2 and aldosterone were assayed before each PET study. E2 levels were below the limits of assay detection in animals off E2, whereas those on E2 showed a range of 241–425 pg/mL (average, 318 ± 34 pg/mL; P < 0.05). The average PRA was 1.63 ng/mL/h in animals deprived of E2, which increased to 1.85 ng/mL/h during the E2-replenished phase (P < 0.05). Average plasma aldosterone levels were 26 ± 11 pg/mL in the hormone-deprived animals but were below the limits of assay detection in the E2-replenished animals (Table 2) (P < 0.05). Two dogs, one from each protocol, were withdrawn from this analysis because the baseline levels of aldosterone were outside of the baseline level interquartile range and results were significantly different from reported values in dogs using the same assay method (18).
Circulating and Tissue RAS Components During Both Phases of Study, as Measured In Vivo and In Vitro
There was a significant change in AT1 receptor expression with modulation of the hormonal state. E2 administration caused declines of 21% and 30% in renal and adrenal Gjedde-Patlak slopes (Ki), respectively (Table 2; Figs. 2 and 3). In vitro radioligand assays showed reductions of 30% and 35% in AT1 Bmax in kidney glomeruli and adrenal gland, respectively (Table 2; Fig. 4). Although the differences were similar, there was no quantifiable linear correlation between Bmax and Ki.
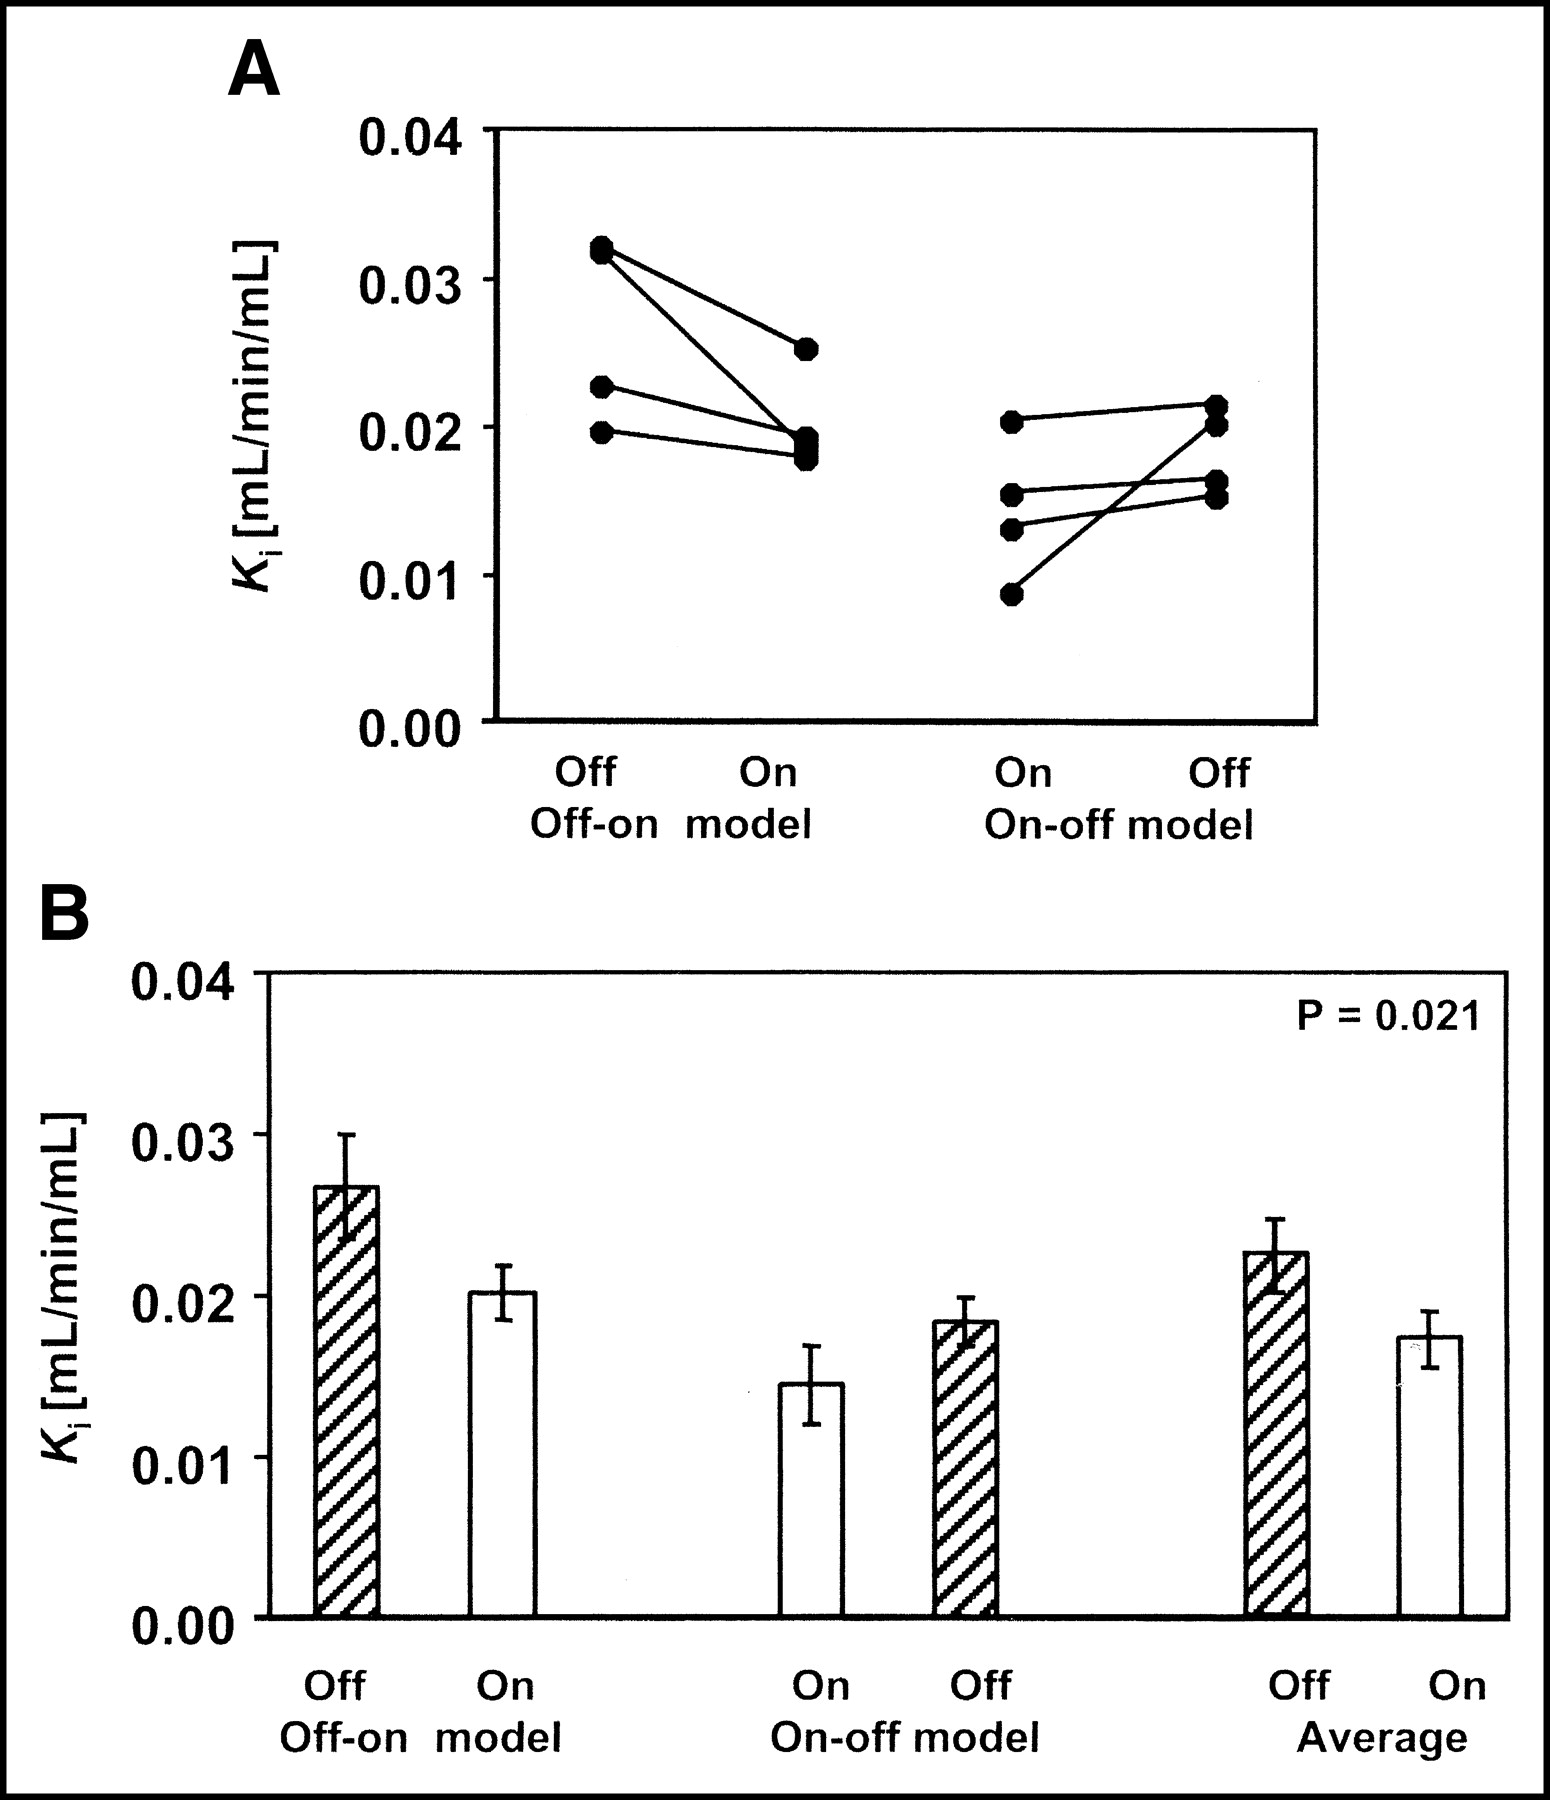
Effect of estrogen depletion on cAT1 receptor expression in renal cortex as determined by PET imaging in vivo. (A) Ki changes in individual animals first off and then on E2 (off-on model) and in animals first on and then off E2 (on-off model). (B) Ki in 2 groups of animals (off-on and on-off model) and in all pooled animals off and on E2. Differences between off and on E2 were consistent but statistically not significant in separate off-on and on-off subgroups. Differences between pooled parameters were statistically significant (P = 0.021).

Effect of estrogen depletion on cAT1 receptor expression in adrenal gland as determined by PET imaging in vivo. (A) Ki changes in individual animals first off and then on E2 (off-on model) and in animals first on and then off E2 (on-off model). (B) Ki in 2 groups of animals (off-on and on-off model) and in all pooled animals off and on E2. As in kidney (Fig. 2), differences between off and on E2 were consistent but statistically not significant in separate off-on and on-off subgroups. Differences between pooled parameters were statistically significant (P = 0.003).
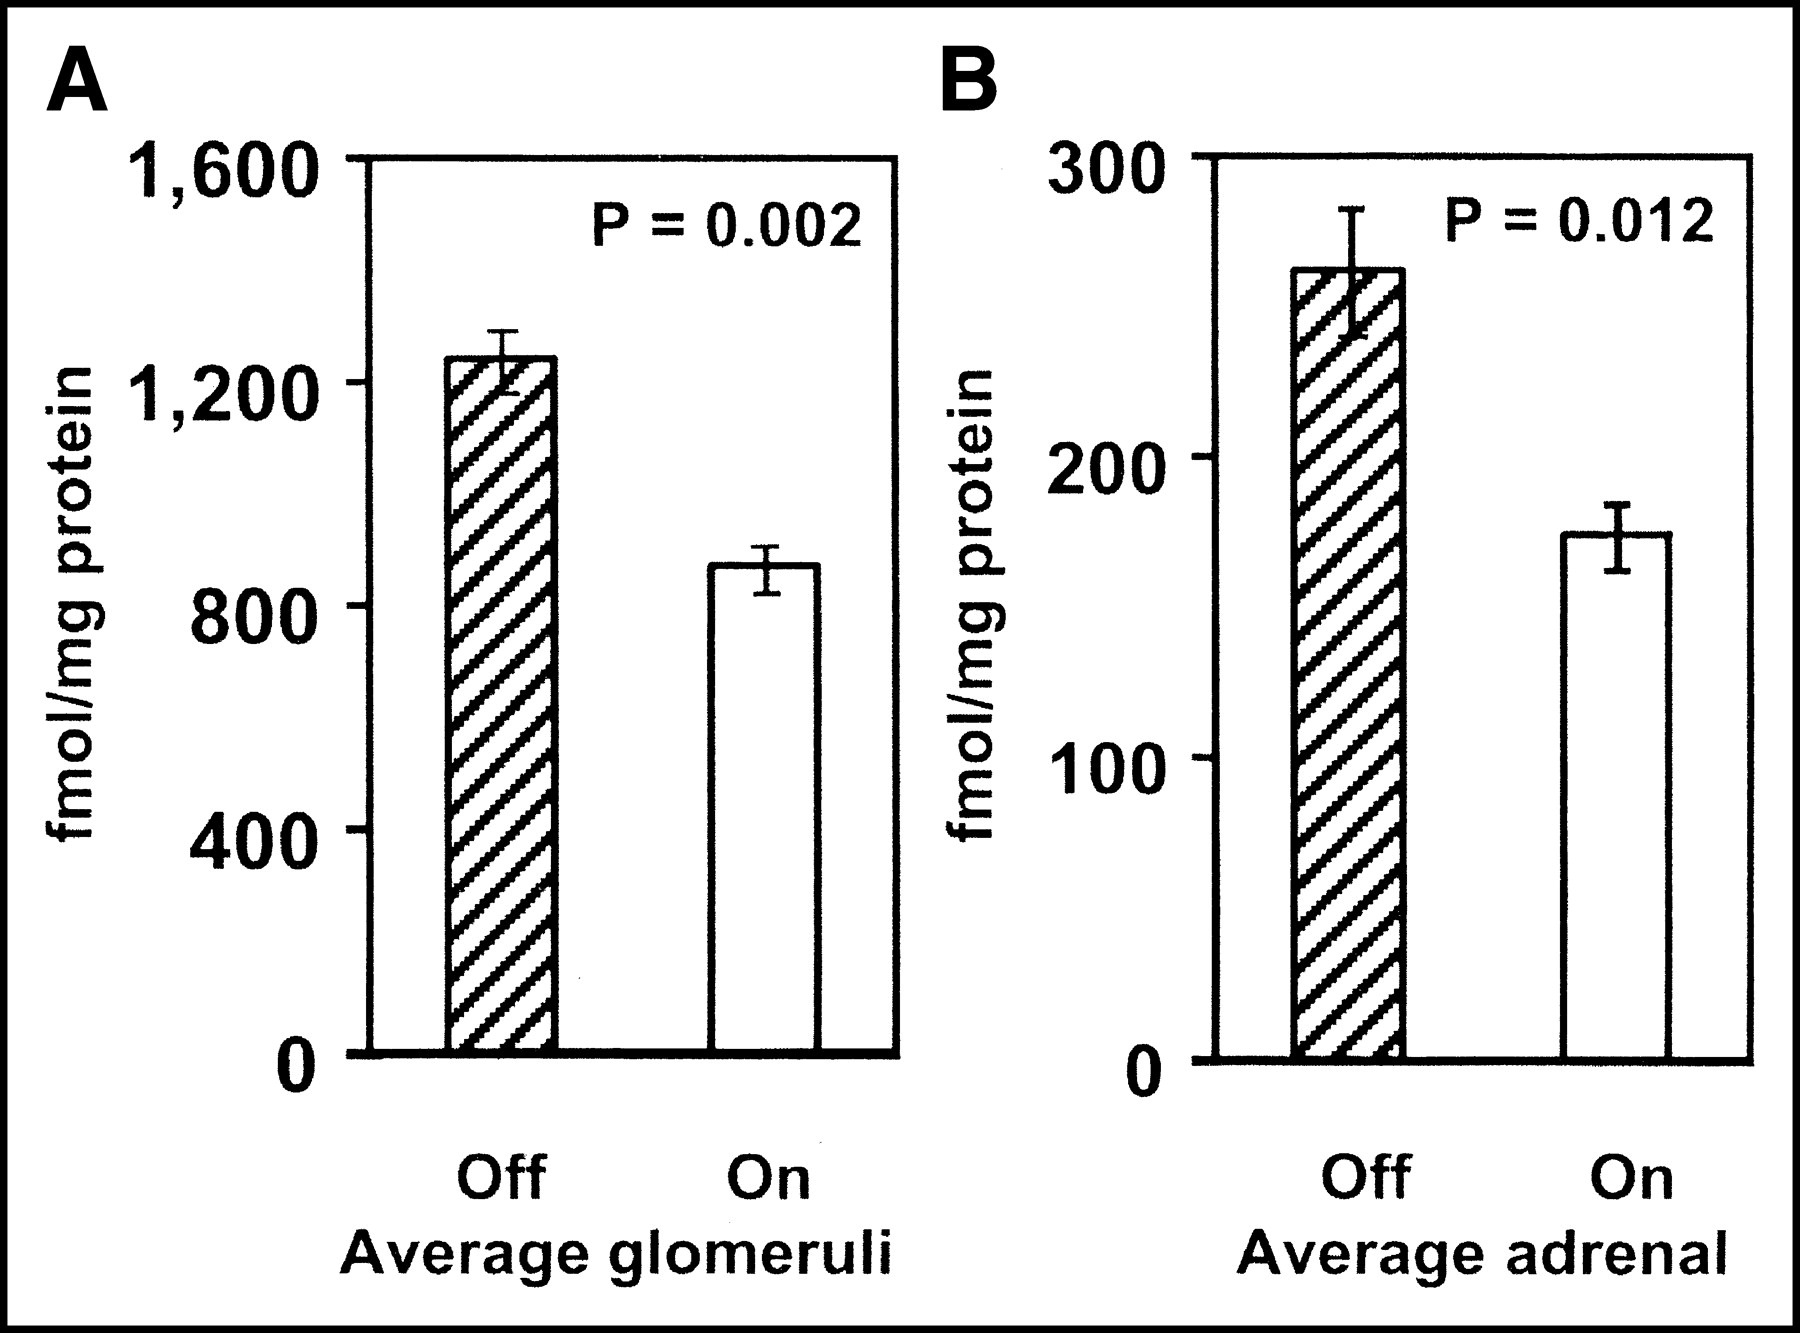
Effect of estrogen on cAT1 receptor expression as measured by in vitro radioligand binding expressed as Bmax in units of fmol/mg protein. Differences were significant in both glomerular (A) (P = 0.002) and adrenal (B) (P = 0.012) Bmax.
Animals in the on-off model showed 25% increase, whereas animals in the off-on model showed 32% decrease in renal Ki (Fig. 2). The change in adrenal Ki was similar: 31% increase for the on-off group and 35% decrease for the off-on group (Fig. 3). These changes could not be attributed to changes in the input function. The average unmetabolized 11C (i.e., the parent compound fraction) was 57.1% ± 2.8% in the animals on and 58.7% ± 2.2% in the animals off E2. The differences in the parent compound fraction were not statistically significant (paired t test P = 0.630). On the other hand, the in vivo measurements were confirmed by in vitro data. Two weeks of E2 treatment resulted in significant decreases in AT1 receptor Bmax determined in vitro, in membranes prepared from the adrenal (35%, P < 0.05), liver (21%; P < 0.05), myocardium (35%), and isolated glomeruli (30%; P < 0.05), compared with estrogen-depleted animals (Table 2; Fig. 4). Bmax was 4 times higher in the liver than in the myocardium (Table 2).
DISCUSSION
PET imaging revealed that E2 replacement after ovariectomy led to lower in vivo AT1 receptor radioligand binding in the renal cortex and adrenal compared with their E2-depleted state. This finding agrees with reports from in vitro studies by us (12) and by other investigators, which showed that E2 administration causes a downregulation of AT1 receptor expression in diverse tissues, including the hypothalamus, pituitary (5,19), adrenal gland (5), and aortic vascular wall (4). To our knowledge, this is the first study of estrogen action in a species that, like humans, has only one known functional subtype of the AT1 receptor. Furthermore, this is the first time estrogen action on AT1 receptors has been examined in vivo. Dogs subjected to hormonal deprivation and then E2 replenishment exhibited a 32% and 35% overall reduction in renal and adrenal AT1 receptor binding, respectively, compared with their E2-deficient state (Table 2). Using the Gjedde-Patlak plot for quantification of radioligand binding, all 8 dogs studied showed this down-regulatory effect of E2 on cAT1 receptor expression in the kidney and adrenal gland.
The Ki parameter depends not only on receptor binding of the radioligand but also on uptake and release in the kidney (20). In this specific set of experiments, the observed changes of Ki can be applied to measure AT1 receptor regulation for the following reasons: (a) The contribution of specific binding to the total variance of Ki is 67% (14). (b) Dietary sodium, a strong regulator of the AT1 receptor, does not affect renal blood flow measured with PET (15). (c) E2 has been shown to increase renal blood flow only by 12% (21) but such a change would have had an effect on the AT1 receptor opposite to those observed in the present experiments. (d) It is unlikely that metabolites of the radioligand, 11C-L-159,884, contributed to Ki since the amount of metabolized radioligand is <15% of the total 11C concentration in the renal parenchyma. This fraction remains stable with time after radioligand injection and is independent of the regulatory changes of the AT1 receptor (22). Also, the fraction of metabolized ligand in the plasma of animals on or off E2 was comparable. (e) Most importantly, in vivo differences in Ki are supported by differences of Bmax determined in vitro (Table 2; Figs. 2–4).
The renal and adrenal cAT1 receptor expression is coordinately regulated and strongly influenced by dietary sodium intake (10). This is a confounding variable that we had to guide against by ensuring that all animals were placed on a standardized diet enriched with normal daily salt intake. In addition, we determined the serum and urine electrolytes and urine osmolality before each PET study, and all measured values were within the reference range. Although increased urinary sodium reabsorption was noted in the presence of E2, this did not produce severe alterations in electrolytes since individual values were within the normal reference range and there was no significant difference in the average serum and urine electrolyte levels between the 2 treatment groups (Table 1). There were, however, significant differences in urine osmolality between the off-on and on-off phase, perhaps, as a consequence of the increased sodium reabsorption induced by E2. This finding is not surprising since E2 causes increased renal reabsorption of fluid and sodium independent of aldosterone levels (23) This effect of E2 is probably due to the hormone’s direct effect on mineralocorticoid activity (24) and possibly, also, through its action on the expression and localization of a NaCl cotransporter in the distal convoluted tubules (25,26).
We observed a 27% increase in PRA in the E2 repletion phase of the study compared with the E2 deprivation phase (Table 2). However, there was no associated increase in plasma aldosterone levels with the raised PRA. In fact, plasma aldosterone levels were below the detection limit of our assay method during the E2 replete phase. This seeming discordance between PRA and aldosterone levels may be explained by the other known actions of E2, including reduced ACE messenger RNA (2), reduced tissue sensitivity to Ang II (4,5), and, especially, reduced expression of the AT1 receptor in the adrenal (5). Furthermore, E2 administration acts centrally to suppress pituitary AT1 receptor expression, thereby causing reduced adrenocorticotropic hormone and aldosterone production (12,19). It is likely that these effects of E2 counteracted the consequences of increased PRA, thus producing an overall downregulation of the RAS. Although several investigators have also reported increased PRA with E2 administration (27), Schunkert et al. reported a fall in active renin concentrations in the plasma in postmenopausal women on estrogen replacement therapy (ERT) compared with those not on ERT (7). One possible explanation for the discrepancy between Schunkert’s findings and those of other investigators is the assay method used since the traditional indirect PRA assay correlates poorly with the direct monoclonal antibody active renin assay when the PRA level is <2 ng/mL/h (27). Although further studies may be needed to fully elucidate the effect of E2 on plasma renin, our data suggest that the overall effect of E2 is to reduce the activity of the RAS by lowering AT1 receptor expression and, consequently, reduced tissue responsiveness to Ang II. Thus, suppression of the RAS by estrogen could be a contributory mechanism accounting for the cardiovascular health benefits associated with estrogen.
Whereas the in vivo measurements were repeated in the same animal, we could only perform one in vitro assay in each animal. Nonetheless, by having one group of dogs on E2 and the other group off E2 at the time of killing, we were able to study the effect of E2 on AT1 receptor expression in vitro. This in vitro assessment was also used to validate the in vivo PET measurements. In vitro binding assays revealed a 30% decrease in glomerular Bmax and a 35% decrease in adrenal cAT1 Bmax in animals on E2 compared with those off E2 (Table 2; Fig. 4). This change is consistent with in vivo PET assessments.
The Ki parameter that was derived from the PET studies depends on the density of receptors (Bmax) in a linear fashion (28); thus, similar relative changes of the AT1 receptor are expected when assessed by in vitro and in vivo binding experiments if other physiologic parameters, such as renal blood flow and nonspecific binding of the radioligand, remain unchanged.
The presented in vitro assay results are also comparable with our previous data showing a 45% reduction in adrenal rat AT1 receptor number after E2 replacement in NaCl-deprived ovariectomized rats (12). The lack of correlation between individual in vitro and in vivo renal AT1 receptor values can be partly explained by the fact that assays were performed on isolated glomeruli rather than whole kidney preparations. Also, the use of unlabeled AT1 receptor- and AT2 receptor-specific ligands for saturation and competition studies made for greater accuracy in estimating the amount of non-AT1 receptor binding in vitro (15). The in vitro studies also demonstrated downregulation of myocardial AT1 receptor binding in animals on E2, a result that is of special importance considering the potential cardioprotective effects of ERT. Receptor density (Bmax) was much lower in the myocardium than in the liver, adrenal, or kidney (Table 2). This large difference in the number of binding sites and the fact that the PET radioligand is excreted through the hepatobiliary route may hamper imaging of the myocardium—in particular, imaging of the inferior wall. Similarly, high receptor binding in the liver combined with hepatobilitary excretion can interfere with receptor quantification in the right adrenal and the upper pole of the right kidney.
The RAS regulates blood pressure and fluid homeostasis through AT1 receptors in various target tissues. Thus, downregulation of AT1 receptors is likely to reduce the tissue responsiveness to Ang II in these tissues. In the kidney, AT1 receptors mediate glomerular blood flow and sodium, chloride, and bicarbonate transport processes in the renal tubules (29). In the adrenal gland, stimulation of AT1 receptors results in aldosterone secretion from the adrenal cortex (30) and increased catecholamine synthesis in the adrenal medulla (31). In the heart, AT1 receptors mediate vascular contractility as well as growth and hypertrophy (32). Although the effects in the liver are not well understood, AT1 receptors are known to modulate hepatic metabolism, including glucose and lactate balance (33). Attenuation of all or some of these actions could contribute to the cardioprotective effects associated with estrogen.
CONCLUSION
This study examines the effects of estrogen on AT1 receptor expression in vivo. It shows that E2 regulates the RAS in dogs, causing reduced expression of the cAT1 receptor in the kidney, adrenal gland, liver, and heart. These receptor changes are reversible and measurable with PET imaging. PET measurement of changes in AT1 receptor expression is comparable with in vitro assays and may hold great potential for further investigation of the effect of hormone replacement therapy in humans. Clarification of the precise molecular basis of estrogen action is likely to lead to the development of new hormone replacement therapeutics, which possess the optimum benefits of estrogen action while minimizing the adverse effects.
Acknowledgments
We appreciate the assistance of David Clough, Karen Edmonds, O’bod Nicely, Paul Clark, and Laura Marshall in carrying out the PET studies. This work was supported by National Institutes of Health grant DK 50183.
Footnotes
Received Apr. 7, 2003; revision accepted Oct. 3, 2003.
For correspondence contact: Zsolt Szabo, MD, PhD, Division of Nuclear Medicine, Department of Radiology, Johns Hopkins University, 601 N. Caroline St., Baltimore, MD 21287.
E-mail: zszabo{at}jhmi.edu


