


Abstract
Most physiologic effects of the renin angiotensin system (RAS) are mediated via the angiotensin (Ang) type 1 receptor (AT1R). The 18F-FPyKYNE derivative of the clinically used AT1R blocker losartan exhibits high binding selectivity for kidney AT1R and rapid metabolism in rats. The aim of this study was to further assess the binding profile of this novel PET agent for imaging AT1R in rats and pigs. Methods: In vitro binding assays were performed with 18F-FPyKYNE-losartan in rat kidneys. Male Sprague–Dawley rats were used to assess dosimetry, antagonistic efficacy via blood pressure measurements, and presence of labeled metabolites in kidneys. Test–retest PET imaging, blocking with AT1R antagonist candesartan (10 mg/kg), and plasma metabolism analysis were performed in female Yorkshire pigs. Results: 18F-FPyKYNE-losartan bound with high affinity (dissociation constant of 49.4 ± 18.0 nM and maximal binding of 348 ± 112 fmol/mm2) to rat kidney AT1R. It bound strongly to plasma proteins in rats (97%), and its labeled metabolites displayed minimal interference on renal AT1R binding. FPyKYNE-losartan fully antagonized the Ang II pressor effect, albeit with 4-fold potency reduction (the effective dose inhibiting 50% of the Ang II–induced maximal pressor response of 25.5 mg/kg) relative to losartan. PET imaging exhibited high kidney-to-blood contrast and slow renal clearance, with an SUV of 14.1 ± 6.2. Excellent reproducibility was observed in the calculated test–retest variability (7.2% ± 0.75%). Only hydrophilic-labeled metabolites were present in plasma samples, and renal retention was reduced (−60%) at 10–15 min after blockade with candesartan. Conclusion: 18F-FPyKYNE-losartan has a favorable binding profile and displays high potential for translational work in humans as an AT1R PET imaging agent.
Hyperactivity of the renin angiotensin system (RAS), and specifically the pathologic alteration in angiotensin II (Ang II) type 1 receptor (AT1R), is thought to play a distinct role in the development of disease processes including hypertension, myocardial infarction, chronic kidney disease, and cardiorenal failure (1–3). Conflicting results have been reported on AT1R levels measured under pathophysiologic conditions. Although previous PET studies have been performed with small (rodents) and larger (dogs, baboons, pigs) animals (4–6) using 11C-labeled AT1R ligands, no research has been published using an 18F-labeled AT1R ligand. 18F-labeled tracers offer some key advantages over 11C, including a longer half-life (109.6 vs. 20.4 min) (7), enabling multiple scans from a single formulation and shipment to other sites and higher image resolution due to lower energy and shorter positron range (0.23 vs. 0.39 mm in soft tissue) (8), thus enabling higher image resolution.
Previous structure–activity relationship studies demonstrated that large prosthetic groups can be introduced at the imidazole 5-position of losartan with minimal changes in binding properties (9). Moreover, addition of a leucine and a short linker composed of tetraethylene glycol and diglycolic acid between the losartan moiety and the tetra-amine chelator yielded to a losartan analog displaying high affinity (inhibitory constant = 6 nmol/L) for AT1R (10). Recently, 18F-FPyKYNE-losartan was synthesized by conjugation of 18F-FPyKYNE with the azide-modified trityl losartan via click chemistry with high chemical and radiochemical purities (11). Preliminary in vivo evaluation of 18F-FPyKYNE-losartan with PET imaging displayed a dose-dependent reduction of this radiotracer in rat kidney AT1Rs and binding selectivity for AT1R over AT2R. Additionally, 18F-FPyKYNE-losartan is metabolized into mostly hydrophilic-labeled products in rat plasma, suggesting minimal interference of the 18F-labeled metabolites with AT1R binding (11).
The specific aims of the present study were to evaluate the binding affinity of 18F-FPyKYNE-losartan to renal AT1Rs and antagonistic efficacy on Ang II pressor effect in rats; the relative proportions of labeled metabolites (if any) in rat kidney and pig plasma, compared with unchanged tracer using column-switch high-performance liquid chromatography (HPLC); the biodistribution and radiation dosimetry; and the PET imaging profile of 18F-FPyKYNE-losartan in pigs.
MATERIALS AND METHODS
Animals
All animal experiments were conducted in accordance with the Canadian Council on Animal Care guidelines and approved by the Animal Care Committee of the University of Ottawa. Male and female (for dosimetry) Sprague–Dawley rats (200–300 g) (Charles River) were housed in pairs and maintained on a 12-h light–dark cycle with free access to food and water. Female Yorkshire pigs (30–35 kg) (Panmure Farms) were kept for 1 wk on arrival before any studies were performed and fed with a standard diet.
Radiochemistry
18F-FPyKYNE-losartan (specific activity, 7.4–155 GBq/μmol) and unlabeled FPyKYNE-losartan (Fig. 1) were produced in high purity as reported previously (11).

Chemical structures of 18F-FPyKYNE-losartan (X: F-18) and cold standard, FPyKYNE-losartan (X: F-19).
Rat Studies
In Vitro Evaluation of Binding Parameters
After decapitation, rat kidneys were snap-frozen in 2-methylbutane at −40°C and stored at −80°C for autoradiography (n = 5 assays) (12–14). Briefly, 20-μm kidney sections mounted onto slides (3 per slide) were preincubated in 150 mM NaCl, 1 mM ethylenediaminetetraacetic acid, 50 mM Na3PO4, 0.1% bovine serum albumin, and 0.1 mM bacitracin for 15 min, and then increasing concentrations of 18F-FPyKYNE-losartan (1–500 nM) were added in the presence of AT2R blocker PD123,319 (10−5 M; Sigma) for 1 h at room temperature. To determine nonspecific binding (NSB), parallel incubations were performed with the addition of 10 μM unlabeled Ang II (Sigma) (12–14). After 3 successive 15-min washes, dry slides were loaded into x-ray cassettes with a set of radioactivity standards and exposed to an imaging phosphor screen for 1 h. Screens were imaged with the Molecular Imager FX (Bio-Rad) and the binding densities quantified with a computer-assisted image analysis system (QuantityOne). The optical density value of each pixel of digitized image was converted into DPM/mm2, and nonlinear curve-fitting of total binding and NSB isotherms was performed to determine the dissociation constant (KD, nM) and maximal binding (fmol/mm2) of radiotracer using GraphPad Prism (version 6.02; GraphPad Software).
In Vivo Assessment of Antagonistic Activity
Rats were anesthetized with sodium pentobarbital (60 mg/kg, intraperitoneally), then the carotid artery was cannulated and connected to a fiber-optic pressure transducer for blood pressure measurement. Drugs were injected through a catheter in the tail vein. Animals were kept warm at 37°C.
To obtain a dose-pressor response curve for Ang II and determine its submaximal dose, Ang II (0.03–100 μg/kg) was administered intravenously in a cumulative manner (n = 4), and each successive injection was given immediately after the maximal effect of the preceding dose was obtained (10–20 s). Saline vehicle was given to animals 15 min before and after Ang II (15,16). All drugs were injected in a 0.2- to 0.4-mL volume. Rats were euthanized by an overdose of sodium pentobarbital (90 mg/kg, intravenously) (17). The effects of FPyKYNE-losartan (3–50 mg/kg; n = 1–3) and the AT1R blockers candesartan (1–10 mg/kg; n = 1–3) and losartan (1–30 mg/kg; n = 1–3) were examined.
Doses were injected 15 min before the administration of Ang II at its submaximal dose, and then dose–response curves were plotted and the percentage decrease in diastolic blood pressure was calculated for each test compound in relation to that obtained in untreated animals. Inhibitory dose–response curves were best-fitted with a 4-parameter logistic equation under a shared Hill slope using GraphPad Prism 6.02 to determine the effective dose inhibiting 50% of the Ang II–induced maximal pressor response and the percentage antagonist-mediated maximal inhibition in vivo.
Plasma-Protein Binding
Plasma-protein binding of 18F-FPyKYNE-losartan was measured in quintuplicate using the Centrifree Ultrafiltration device (Millipore; molecular weight cutoff, 30,000 Da). Unchanged 18F-FPyKYNE-losartan was added to plasma obtained from rats (n = 5) sacrificed by decapitation without anesthesia. Plasma was centrifuged (2,000g, 30 min) and the filtrate (protein-free fraction) counted in the γ-counter (18,19).
Radiolabeled Metabolite Analysis in Kidneys
18F-FPyKYNE-losartan metabolism was examined in normal rat kidney homogenates at 5, 10, 20, and 30 min (n = 3 per time point) after the injection of 74–148 MBq as previously reported (11). Blocking studies were performed with candesartan (5 mg/kg, n = 4; and 10 mg/kg, n = 5) via the tail vein immediately before 18F-FPyKYNE-losartan, and rats were sacrificed at 10 min after tracer injection. Tissue samples were homogenized in ethanol/water 80/20 (v/v) using a polytron homogenizer and ultracentrifuged for 15 min. Supernatant was collected and evaporated, reconstituted in acetonitrile/water 1/99 (v/v) containing urea (0.4 g/mL) to disrupt plasma-protein binding, filtered (0.2-μm Nylon Membrane [Acrodisc]), and injected into the HPLC system. Tissue homogenates (n = 3 at −5 min) spiked with approximately 1.85 MBq of 18F-FPyKYNE-losartan were also tested by column-switch HPLC as controls.
Estimation of Human Effective Doses
Human dosimetry for 18F-FPyKYNE-losartan was calculated using whole-body biodistribution data extrapolated from rats, following the Radiation Dose Assessment Resource method as implemented in the OLINDA/EXM 1.1 program (Vanderbilt University), and using tissue-weighting factors from the International Commission on Radiological Protection (ICRP) protocols (20,21). A detailed description of the methods is provided in the supplemental materials (available at http://jnm.snmjournals.org).
Pig Studies
PET Imaging
Pigs were anesthetized with Telazol (tiletamine-zolazepam, 0.044 mg/kg; Zoetis Inc.), glycopyrrolate (0.01 mg/kg), and isoflurane and placed supine for PET imaging using a Discovery D690 PET-VCT scanner (GE Healthcare). A CT scout scan was obtained, followed by a low-dose CT for attenuation correction and a 10-min 82Rb scan to ensure that both kidneys were in the scanner field of view. 18F-FPyKYNE-losartan was administered via the ear vein at a dose of 5 MBq/kg. Vital data were monitored continuously. Pigs were rescanned the following week to ensure repeatability of results (n = 3). On the third week of each pig study, blocking PET scans were obtained by injecting (intravenously) a saturating dose of candesartan (10 mg/kg) 15 min before tracer injection. PET imaging was performed for 90 min and images reconstructed into 12 × 10 s, 6 × 20 s, and 16 × 5 min frames, using the vendor ordered-subset expectation maximization method with 8-mm postfiltering.
PET Image Analysis
Siemens Inveon Research Workplace software was used to analyze reconstructed dynamic images and generate time–activity curves for the arterial blood input function (derived from aorta regions) and right kidney tissue uptake. Renal CT angiography images were coregistered with their corresponding PET scans, to ensure accurate localization of regions of interest. Arterial time–activity curves were corrected for partial-volume losses based on a computer simulation of the PET image resolution and the aorta radial dimension measured on the CT angiography images. 18F-FPyKYNE-losartan renal activity was measured as SUV (g/mL) at 10–15 min after injection (frame 20) (22). The specific binding index was expressed as the reduced peak retention in the renal cortex and was calculated from the difference in peak SUVs between baseline and blocking conditions.
Radiolabeled Metabolite Analysis in Plasma
During the PET scans, blood samples were collected from the femoral artery at −5 (control), 1, 2, 5, 10, 20, and 40 min after injection (n = 3). Plasma samples were prepared as described previously (11,19). Control plasma was spiked with 0.37 MBq of tracer, filtered, and then injected onto the HPLC system.
Arterial Input Function Corrections
The first step toward generating an arterial input function was correcting for plasma radioactivity. To correct for binding to red blood cells, activity in whole blood and in plasma was measured at serial time points, and the plasma–to–whole-blood ratio was determined as a function of time. 18F-FPyKYNE-losartan (5 MBq/kg) was injected via the ear vein and arterial blood (5–6 mL) collected from the femoral artery at 0.5, 1, 2, 5, 10, 20, 40, 60, and 90 min. Blood samples were weighed and counted for activity. Samples were centrifuged to obtain plasma and then weighed and counted to determine activity per gram (19).
Statistical Analysis
All results are expressed as mean ± SD or ± SE as indicated. Means were compared using the t test (paired or unpaired). The test–retest variability was calculated by taking the ratio of the absolute value of the difference between repeated measurements and the mean of the repeated measurements as described by Lortie et al. (19).
RESULTS
In Vitro Binding in Rat Kidneys
18F-FPyKYNE-losartan binding displayed a discrete localization in the kidney. The highest level of total binding relative to NSB was detected in the kidney cortex. Global curve-fitting analyses of paired total binding and NSB curves revealed that 18F-FPyKYNE-losartan bound to kidney cortex with a KD of 49.4 ± 18.0 nM and maximal binding of 348 ± 112 fmol/mm2.
In Vivo Antagonism in Rats
Ang II caused a dose-dependent increase in blood pressure, and the submaximal dose was determined graphically to be 3 μg/kg. Losartan and candesartan exhibited a dose-dependent antagonism of AT1Rs and virtually abolished the Ang II effect at doses of 30 and 10 mg/kg, respectively. The blocking effect of FPyKYNE-losartan obtained at a dose of 50 mg/kg was 72%. The computed effective doses inhibiting 50% of the Ang II–induced maximal pressor response values (in mg/kg) obtained with the curve-fitting analysis of inhibitory dose-response curves were 0.7 (candesartan), 6.4 (losartan), and 25.5 (FPyKYNE-losartan) (Fig. 2). FPyKYNE-losartan also displayed full antagonism but with less potency than losartan and candesartan.
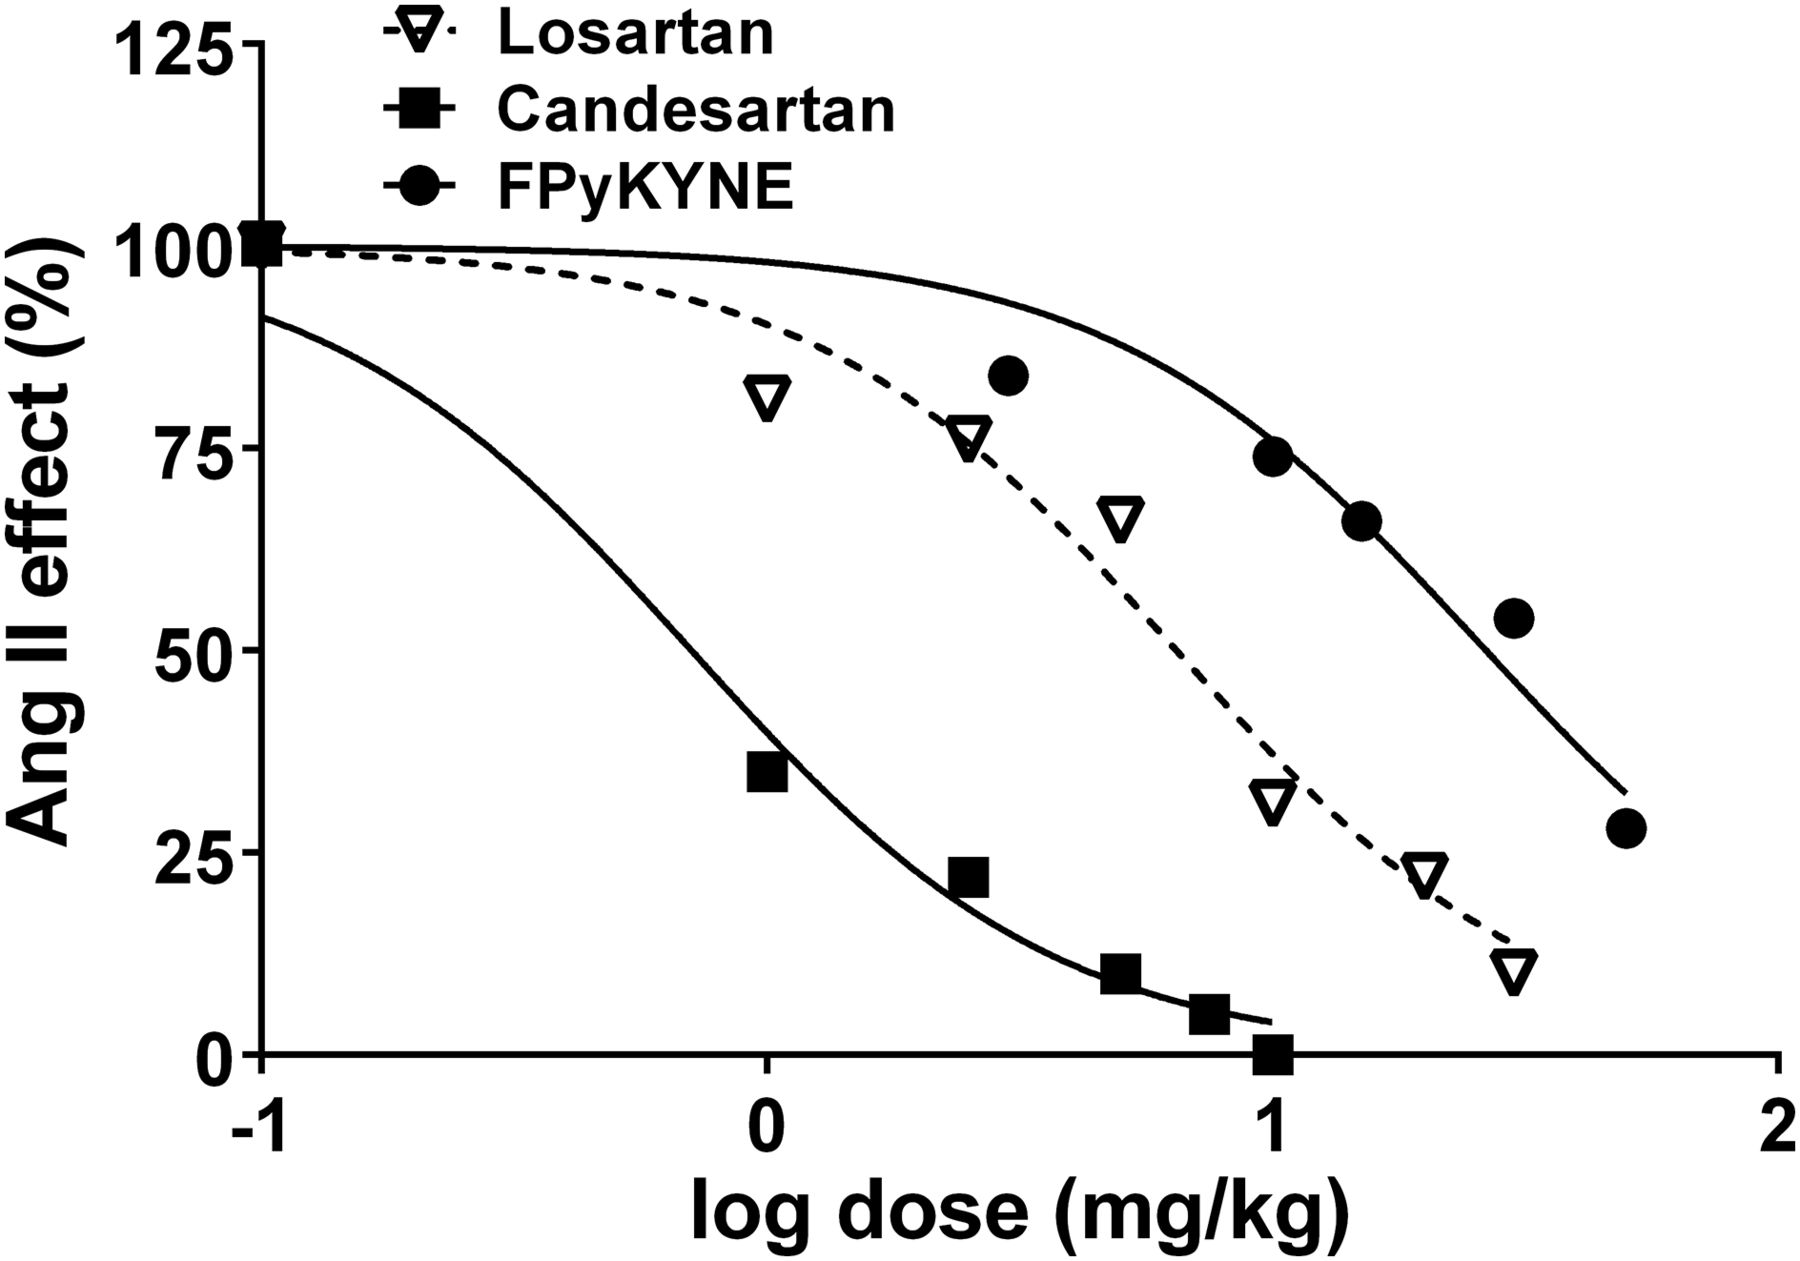
Dose–response curves of AT1R blockers candesartan, losartan, and FPyKYNE-losartan displaying their effect in blocking Ang II pressor response (submaximal dose, 3 μg/kg intravenously) in anesthetized rats. Curves were analyzed with nonlinear curve-fitting program (GraphPad Prism 6.02) using 4-parameter logistic equation. Curves were fitted with shared Hill slope factor.
Radiolabeled Metabolite Analysis in Rat Kidneys
18F-FPyKYNE-losartan was bound at 97% to plasma proteins. As described in rat plasma (11), kidney samples revealed 3 major HPLC peaks (Fig. 3A). The hydrophilic-labeled metabolite (peak 1) increased slowly over time, whereas the hydrophobic metabolite (peak 2) had a negligible contribution to the total activity. Unchanged 18F-FPyKYNE-losartan (peak 3) accounted for more than 50% of total radioactivity at all time points (Table 1). Blockade of AT1Rs with candesartan produced a reduction in unchanged tracer proportion by 74% and 88% with the 5 and 10 mg/kg doses, respectively. The proportion of hydrophobic metabolite decreased by half at a blocking dose of 10 mg/kg, whereas hydrophilic metabolite proportion increased by 86% at the same blocking dose (Table 1).
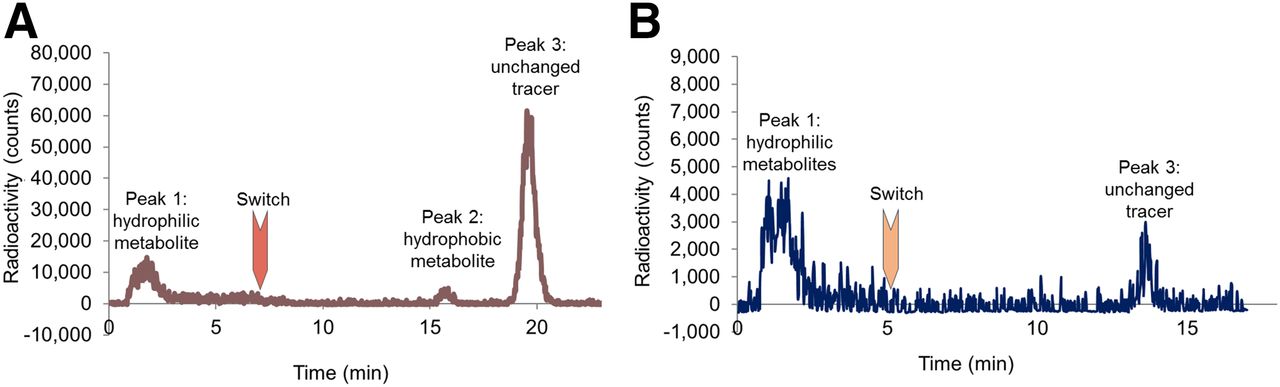
Representative high-performance liquid chromatograms displaying unchanged 18F-FPyKYNE-losartan (peak 3) and its labeled hydrophilic (peak 1) and hydrophobic (peak 2) metabolites in rat kidney (A) and pig plasma (B) at 10-min time point.
Proportions of Unchanged 18F-FPyKYNE-Losartan and Its Labeled Metabolites in Rat Kidney Homogenate at Respective Time Points
Rat Dosimetry Studies
The decay-corrected accumulation of radioactivity in whole tissues is depicted in Supplemental Table 1. Most tissues demonstrated a rapid tracer uptake, with levels gradually decreasing after 5 min. Similar trends were observed for both men and women. Elevated radioactivity accumulation with time occurred within the metabolism-related tissues (liver, small intestine contents, upper and lower intestine contents, and urine). The liver showed the highest uptake and accounted for around 30% of the effective dose (ED) in both sexes (Supplemental Table 2). The sex-averaged ED calculated using both ICRP 60 and 103 was 0.031 mSv/MBq. A mean of 85% of the total injected dose was recovered in the organs and carcass at the time points studied.
PET Imaging of Pig Kidneys
Time–activity curves derived from the right kidney exhibited high kidney-to-blood contrast (ratio of approximately 3) and slow clearance from the kidneys (Fig. 4A). The highest renal uptake was obtained at 10–15 min after injection, with an SUV of 14.1 ± 6.15. Test and retest scans were reproducible with a test–retest variability of 7.2% ± 0.75% and a P value of 0.89, showing no significant difference between the datasets. Blocking AT1Rs with 10 mg/kg of candesartan resulted in reduced renal 18F-FPyKYNE-losartan retention (Fig. 4B). SUVmax (at 10–15 min) in the right kidney was significantly decreased from 14.1 ± 6.15 to 5.8 ± 4.60 (P = 0.03). This 60% reduction demonstrates specific binding of 18F-FPyKYNE-losartan to AT1Rs in pig kidneys. The arterial plasma–to–whole-blood ratio (1.4) was almost constant over time (0–90 min), facilitating input function correction. However, further corrections are necessary for accurate quantification, including correction for labeled metabolites and plasma-protein binding.

Representative PET image (coronal view) of pig kidneys displaying 18F-FPyKYNE-losartan uptake in normal (A) and blocking (B) conditions. Tracer time–activity curves for blood input (aorta) and right kidney (RK) are presented as SUVs normalized to body weight (SUVBW) from 0 to 90 min.
Radiolabeled Metabolite Analysis in Pig Plasma
Only peak 1 (hydrophilic metabolite) and peak 3 (unchanged tracer) were present in pig plasma in both normal and blocking conditions (Fig. 3B). At 20 min, less than 10% of radioactivity (noise- and decay-corrected) in normal plasma was associated with unchanged tracer (Table 2). Blocking AT1Rs resulted in a faster metabolism in pig plasma at 20 min (Table 2). A significant difference in the proportion of unchanged 18F-FPyKYNE-losartan between normal and blocking conditions was identified at 5, 10, and 20 min (P = 0.008, 0.02, and 0.04, respectively).
Proportions of 18F-FPyKYNE-Losartan and Its Hydrophilic-Labeled Metabolites in Pig Plasma in Normal and Blocking Conditions
DISCUSSION
Successful development of a new noninvasive 18F-labeled molecular imaging probe for quantifying AT1Rs would present a unique opportunity to advance understanding and contribution of AT1Rs to the progression of cardiovascular and renal diseases and a means to directly measure therapy responses to optimize patient outcomes. 18F-FPyKYNE-losartan small-animal PET images obtained previously (11) displayed high tissue contrast in the kidney cortex and outer medulla, which correlates well with the known physiologic distribution of AT1R (24). Nonetheless, the cortical and medullary binding could not be differentiated, which can be attributed to the image resolution of the small-animal PET. In the current study, FPyKYNE-losartan exhibited high in vitro binding affinity to AT1R in the renal cortex and full in vivo antagonism, similar to its parent compound losartan. However, a higher dosage of FPyKYNE-losartan was required for blocking Ang II pressor response relative to losartan and candesartan (4 and 36 times more potent, respectively). The order of potency of candesartan and losartan in vivo is consistent with the in vitro binding affinities of these AT1R blockers reported previously (13,25).
Binding of a drug to plasma and tissue proteins inhibits drug disposition and has important effects on drug dynamics because only the free (unbound) drug interacts with receptors. 18F-FPyKYNE-losartan exhibits similar plasma-protein binding to its parent compound losartan (97% and 98%, respectively). Thus, only 3% of 18F-FPyKYNE-losartan is freely available for binding to tissue AT1R. 18F-FPyKYNE-losartan kidney metabolite analysis displayed slow accumulation of the hydrophilic-labeled metabolite and the presence of almost 60% unchanged tracer at 30 min after injection. Blocking AT1R with candesartan at 10 min reduced the proportion of the parent compound, whereas a significant increase was observed in the proportion of the hydrophilic metabolite. These results indicate that the portion of the signal corresponding to AT1R-specific binding is mostly from the unchanged tracer because of the proportion of the labeled metabolites that is not reduced after AT1R blockade in rat kidneys.
Rat dosimetry data suggest that the hepatobiliary system is primarily responsible for eliminating 18F-FPyKYNE-losartan from the body, whereas the kidneys are the secondary route of excretion. Losartan is known to be primarily eliminated via the cytochromes-P450 system in the liver (26,27). As a major site for drug metabolism, the liver aids in the elimination process by converting lipid-soluble substances into more hydrophilic compounds to be easily excreted by the kidneys (28). Hence, for hydrophobic compounds such as FPyKYNE-losartan, the hepatobiliary pathway is the main elimination route. The sex-averaged ED value calculated using ICRP 60 and 103 (0.031 mSv/MBq) is comparable to other 18F tracers such as 2-18F-fluoro-A-85380 (ED = 0.028 mSv/MBq), O-(2-18F-fluoroethyl)-l-tyrosine (ED = 0.016 mSv/MBq), and 18F-FDG (ED = 0.024 mSv/MBq) (29–31). EDs calculated for 18F-FPyKYNE-losartan are well below the regulatory limits recommended by the Food and Drug Administration (28). Although the RAS is known to differ between rats, pigs, and humans, the dose-limiting organs associated with common hepatobiliary metabolism and clearance pathways are likely to remain similar between species. Therefore, the dosimetry profile of 18F-FPyKYNE-losartan is within safe limits for approval of use in human studies.
PET imaging studies in pigs revealed higher image contrast and slower clearance of the tracer from the kidneys than in rats. The long residence time at the receptor and high tissue retention are expected with the long dissociation time of losartan in humans (67 min) (25,32,33). Reproducible results and imaging procedure provide evidence that the quantification of tracer uptake using SUVs is reliable in large animals. For accurate quantification, further arterial input corrections are required, namely metabolite correction for authentic parent tracer in plasma from arterial blood. Blockade of AT1Rs with candesartan reduced peak retention (∼ 60%) at 10–15 min in the renal cortex, further confirming binding specificity of 18F-FPyKYNE-losartan to AT1Rs. Thereby, the PET signal in pigs is expected to represent unchanged 18F-FPyKYNE-losartan and NSB. Normal pig plasma exhibited faster 18F-FPyKYNE-losartan metabolism than rat plasma, because complete clearance from pig plasma was detected at 30 min whereas 23% of unmetabolized tracer was still present in rat plasma at that time (13). When AT1Rs were blocked with candesartan, this process was even faster, with only 4% of the total radioactivity from unchanged tracer at 10 min and complete clearance of 18F-FPyKYNE-losartan from plasma at 20 min. The presence of hydrophilic metabolites only, not binding to AT1Rs, should facilitate accurate blood input function corrections and kinetic modeling calculations for quantification of AT1Rs in future studies. Confirmation of similar binding characteristics and high signal-to-noise ratio of the 18F-FPyKYNE structural analog of the clinically used losartan will facilitate translational work to humans.
CONCLUSION
18F-FPyKYNE-losartan binds with high affinity to renal AT1Rs, and this novel radioligand displays full antagonism for Ang II pressor effect. The metabolism studies in small and large animals revealed that the labeled metabolites do not bind to renal AT1Rs facilitating quantitative PET imaging. The sex-averaged ED of 18F-FPyKYNE-losartan is within an acceptable range compared with other 18F-labeled tracers. Reproducible PET images obtained in pigs combined with favorable binding profile support the potential of 18F-FPyKYNE-losartan for translational work in humans as an AT1R PET imaging agent.
DISCLOSURE
The costs of publication of this article were defrayed in part by the payment of page charges. Therefore, and solely to indicate this fact, this article is hereby marked “advertisement” in accordance with 18 USC section 1734. This work was supported in part by grants from the Canadian Institutes of Health Research (MOP-126079 to JD and MOP-125878 to MT), Ontario Preclinical Imaging Consortium (MRI ORF #RE03-51). Rob S. Beanlands is a career investigator supported by the Heart and Stroke Foundation of Ontario, a Tier 1 University of Ottawa chair in Cardiovascular Imaging Research, and the Ottawa Heart Institute’s Vered chair. No other potential conflict of interest relevant to this article was reported.
Acknowledgments
We thank the radiochemistry staff (Yanick Lee), Richard Seymour, Julia Petryk, and Marika Kolajova for assistance.
Footnotes
Published online May 19, 2016.
- © 2016 by the Society of Nuclear Medicine and Molecular Imaging, Inc.
REFERENCES
- Received for publication December 7, 2015.
- Accepted for publication April 11, 2016.


Jump to section
Related Articles
Cited By...
- No citing articles found.