


Abstract
Preclinical biodistribution and pharmacokinetics of investigational radiopharmaceuticals are typically obtained by longitudinal animal studies. These have required the sacrifice of multiple animals at each time point. Advances in small-animal imaging have made it possible to evaluate the biodistribution of radiopharmaceuticals across time in individual animals, in vivo. MicroPET and MRI-based preclinical biodistribution and localization data were obtained and used to assess the therapeutic potential of 90Y-trastuzumab monoclonal antibody (mAb) (anti-HER2/neu) against ovarian carcinoma. Methods: Female nude mice were inoculated intraperitoneally with 5·106 ovarian carcinoma cells (SKOV3). Fourteen days after inoculation, 12–18 MBq 86Y-labeled trastuzumab mAb was injected intraperitoneally. Tumor-free mice, injected with 86Y-trastuzumab, and tumor-bearing mice injected with labeled, irrelevant mAb or 86Y-trastuzumab + 100-fold excess unlabeled trastuzumab were used as controls. Eight microPET studies per animal were collected over 72 h. Standard and background images were collected for calibration. MicroPET images were registered with MR images acquired on a 1.5-T whole-body MR scanner. For selected time points, 4.7-T small-animal MR images were also obtained. Images were analyzed and registered using software developed in-house. At completion of imaging, suspected tumor lesions were dissected for histopathologic confirmation. Blood, excised normal organs, and tumor nodules were measured by γ-counting. Tissue uptake was expressed relative to the blood concentration (percentage of injected activity per gram of tissue [%IA/g]/%IA/g blood). 86Y-Trastuzumab pharmacokinetics were used to perform 90Y-trastuzumab dosimetry. Results: Intraperitoneal injection of mAb led to rapid blood-pool uptake (5–9 h) followed by tumor localization (26–32 h), as confirmed by registered MR images. Tumor uptake was greatest for 86Y-trastuzumab (7 ± 1); excess unlabeled trastuzumab yielded a 70% reduction. Tumor uptake for the irrelevant mAb was 0.4 ± 0.1. The concentration in normal organs relative to blood ranged from 0 to 1.4 across all studies, with maximum uptake in spleen. The absorbed dose to the kidneys was 0.31 Gy/MBq 90Y-trastuzumab. The liver received 0.48 Gy/MBq, and the spleen received 0.56 Gy/MBq. Absorbed dose to tumors varied from 0.10 Gy/MBq for radius = 0.1 mm to 3.7 Gy/MBq for radius = 5 mm. Conclusion: For all injected compounds, the relative microPET image intensity of the tumor matched the subsequently determined 86Y uptake. Coregistration with MR images confirmed the position of 86Y uptake relative to various organs. Radiolabeled trastuzumab mAb was shown to localize to sites of disease with minimal normal organ uptake. Dosimetry calculations showed a strong dependence on tumor size. These results demonstrate the usefulness of combined microPET and MRI for the evaluation of novel therapeutics.
Pharmacokinetics and biodistribution of radiopharmaceuticals in preclinical animal studies have generally been obtained by extraction of selected organs and scintillation counting for radioactivity at different times after injection. This approach requires the sacrifice of multiple animals at each time point, precludes the ability to monitor biodistribution in individual animals, and is partially susceptible to selection bias because unexpected accumulation of radioactivity in tissue not collected for scintillation counting will be missed. The availability of small-animal imaging instrumentation and positron-emitting analogs of therapeutic radionuclides (e.g., 86Y and 124I for 90Y and 131I, respectively) has made it possible to obtain preclinical pharmacokinetics noninvasively using imaging-based methods. The advantages of such an approach include the ability to monitor kinetics in individual animals over time and the ability to obtain whole-body images of biodistribution, thereby reducing the likelihood that areas of unexpected radiopharmaceutical accumulation will be missed. Together, these increase the statistical power of each measurement, reducing total animal requirements. The disadvantages include a reduction in quantitative accuracy and difficulty in placing the radioactivity distribution in the proper anatomic context. The latter difficulty arises because of resolution limitations and because images of radionuclide distribution do not typically provide detailed anatomic information.
In this work, the positron-emitting radionuclide 86Y, in conjunction with small-animal PET (microPET) imaging, is used to evaluate pharmacokinetics and dosimetry of 90Y-trastuzumab in a disseminated ovarian carcinoma model. MRI, in conjunction with image registration, was used to correlate the radiolabeled monoclonal antibody (mAb) distribution with anatomy. At the end of imaging, the animals were killed and conventional organ biodistribution information was obtained by γ-counting. The combination of these approaches satisfactorily addressed the issues of anatomic localization and quantitative accuracy.
86Y has a 14.7-h half-life (t1/2) and decays by positron emission. The relatively long half-life allows the acquisition of PET images 2–3 d after injection. Being isotopes of the same element, 86Y is chemically identical to 90Y, a pure β-particle–emitting radionuclide that is under investigation for use in targeted radionuclide therapy (1,2). A drawback of using 90Y is that the lack of emitted photons makes it difficult to study the biodistribution of the injected compound. To overcome this obstacle, alternative nuclides have been used. The most commonly used is 111In; however, with PET cameras becoming more available, the use of the positron emitter 86Y has been suggested as a better substitute. A nuclide of the same element is expected to behave chemically identically and thus serve better than a nuclide of another element. Comparisons between these 2 90Y substitutes—that is, 111In and 86Y—have recently been made (3,4).
The anti-HER2/neu mAb, trastuzumab, has demonstrated efficacy in the treatment of cancer patients whose disease exhibits high levels of HER2/neu expression (5,6). In several studies, trastuzumab has been shown to potentiate chemotherapy (7,8). The possibility of using radiolabeled anti-HER2/neu mAbs for cancer therapy has been previously considered (9).
MATERIALS AND METHODS
Cell Culture and Tumor Inoculation
The human ovarian carcinoma cell line SKOV3-NMP2 was provided by Dr. Paul Borchardt (Memorial Sloan-Kettering Cancer Center [MSKCC]). Subclone NMP2 was originally created at the University of Texas M.D. Anderson Cancer Center by passage of the line through nude mice and selected for this study because of enhanced tumorigenicity (10). Stock T-flask cultures were propagated at 37°C, in 95% relative humidity, and in 5% CO2 in RPMI 1640 medium (Invitrogen) supplemented with 10% fetal calf serum (Sigma), 100 units/mL penicillin, and 100 mg/mL streptomycin (Gemini Bio-Products). Cell concentrations were determined by counting trypsinized cells with a hemocytometer. Tumor inoculum was prepared as a single-cell suspension at 1·107 cells/mL in complete RPMI 1640 medium. Each 4- to 6-wk-old female BALB/c nude mouse (Taconic) received 0.5 mL inoculum (5·106 cells) administered by intraperitoneal injection. Animals receiving 0.5 mL of media alone served as negative controls.
Mice were housed in filter top cages and provided with sterile food and water. Animals were maintained according to the regulations of the Research Animal Resource Center at MSKCC, and animal protocols were approved by the Institutional Animal Care and Use Committee.
Preparation of Radioimmunoconjugate
mAb–chelate conjugates were provided as gifts: humanized anti-HER-2, trastuzumab (Herceptin; Genentech, Inc.), was provided by Dr. Paul Borchardt and prepared according to Borchardt et al. (11); humanized anti-CD33, HuM195 (Protein Design Labs, Inc.), was provided by Dr. Michael McDevitt (MSKCC) and prepared according to McDevitt et al. (12). A backbone-substituted derivative of diethylenetriamine pentaacetic acid (DTPA), 2-(4-isothiocyanatobenzyl)DTPA (SCN-CHX-A-DTPA), served as the chelate in all conjugation reactions. mAb conjugate was typically supplied at 7–10 mg/mL.
86Y was produced by irradiating isotope-enriched 86SrCO3 (97.02% 86Sr) with 15-MeV protons in the cyclotron facility (model CS-15; Cyclotron Corp.) of MSKCC (13). The 86Y was dissolved in 0.2–0.4 mL of 50 mmol/L HCl, generating 86YCl3. The radioactivity was measured with a dose calibrator (model CRC-15R; Capintec) and a NaI(Tl) γ-counter (model 5003, Cobra II; Packard).
Radiolabeling protocols were based on those developed in Nikula et al. (14,15). These references similarly outline methods for assessing reaction efficiency using instant thin-layer chromatography (ITLC) and for evaluating final immunoreactivity of the product. Briefly, 0.2–0.3 mL of 3 mol/L ammonium acetate was added to the 86YCl3 solution to adjust to pH ∼5.5. Approximately 200 μg of mAb conjugate were added and the reaction was allowed to proceed at 25°C for 30 min. The reaction was quenched by the addition of 0.040 mL of 10 mmol/L ethylenediaminetetraacetic acid. Radiolabeled mAb was purified from unbound isotope by size-exclusion chromatography using a 10-DG size-exclusion column (Bio-Rad Laboratories, Inc.). Minimum reaction efficiency was 70% as determined by ITLC. The radioactivity of the eluent was determined as previously described. Specific activity varied from 0.7 to 1.0 MBq/μg. Immunoreactivity as determined by acid wash was >90%.
MicroPET Imaging
Two weeks after tumor inoculation, each mouse received 15 MBq (∼20 μg) labeled mAb in 0.5 mL RPMI 1640 medium administered intraperitoneally. Mice receiving radiolabeled HuM195 prepared similarly or 15 MBq free 86Y in 0.5 mL medium served as negative controls. A competitive control was created by adding an additional 2 mg unlabeled mAb to the injectate (excess cold control). For each experiment, a 20-mL glass scintillation vial filled with medium and containing 15 MBq 86Y-trastuzumab was used as a standard. The microPET scanner used in these studies was not fitted with a transmission source; therefore, transmission studies were not collected for attenuation correction of the emission data.
Time-dependent distribution and localization of mAb were determined by 8 microPET imaging sessions over the course of 3 d. During each session a background scan and an image of the standard were also acquired. With the exception of the background, a minimum of 15·106 true counts per scan were collected to ensure adequate image quality. This required aquisition times of 2–5 min on day 0, 10–20 min on day 1, and 40 min on day 2 or 3 after injection. The mice were initially anesthetized using an isoflurane (Forane; Baxter) loaded vaporizer (Vetequip) attached to an incubation chamber. The mice were then placed on the imaging table and were kept anesthetized during the image acquisition by switching the vaporizer to a fitted nose cone.
MRI
On day 5 or 6 after injection, each mouse was imaged on a 1.5-T whole-body MR scanner (Signa; General Electric Medical Systems) to provide anatomic images for registration with PET scans. Five or 6 mice were anesthetized using 106 mg/kg ketamine and 5.5 mg/kg acepromasine, placed in an in-house–fabricated mouse coil designed for imaging up to 13 mice simultaneously (16), and imaged in a single 30- to 40-min session. Imaging parameters included a field of view of 8 × 8 mm, slice thickness of 1.5 mm, slice interval of 0.5 mm, imaging matrix of 512 × 512, a fast spin echo pulse sequence with a repetition interval (TR) of 4,500–11,000 ms, echo time (TE) arranged 96–102 ms, and 4 excitations per phase-encoding step. Selected mice were further imaged on a small-animal 4.7-T MR scanner (Omega; General Electric Medical Systems). A T2-weighted pulse sequence was also used on the 4.7-T scanner with a TR of 3,500 ms, TE of 40 ms, 1-mm-thick slice, imaging matrix of 256 × 256, and a 3-cm field of view.
Image Analysis and MicroPET Activity Quantitation
Image reconstruction was performed by filtered backprojection. In-house–developed software, MIAU (17) and 3-dimensional internal dosimetry (3D-ID) package (18), were used to quantitate reconstructed images and also for registration to MR studies. Whole-body clearance kinetics were obtained from the summed counts in each scan at each time point. Total counts were corrected for dead time and background. The decay-corrected total counts for the standard obtained in this manner varied by <2% over 72 h. Relative activity concentrations over the injection site, heart, and tumor were obtained by drawing regions of interests (ROIs). MicroPET quantitation can be influenced by the position of tissue relative to the central axis of the camera and also by the surrounding tissue, due to differential sensitivity and attenuation, respectively. Direct comparison of tumor to organ activity concentration was therefore not made; rather, only relative changes in the activity concentration in these tissues over time were evaluated. To minimize partial-volume effects arising because the activity containing volume (e.g., tumor nodules) is below the intrinsic resolution of the scanner, ROIs were consistently drawn to enclose a 30- to 40-μL volume.
Excised Organ Quantitation
Mice were killed on day 6 after injection by CO2 intoxication for dissection. Blood was collected via cardiac puncture. Organ, muscle, and tumor tissues were washed in phosphate-buffered saline and weighed. The samples were then counted for photons in a γ-counter (model 5003, Cobra II; Packard). Two 100-μL aliquots of the 20-mL imaging standard were used for calibration of γ-counting results. Results are expressed as the radioactivity concentration in each organ divided by the concentration in blood.
Dosimetry
86Y-Trastuzumab kinetics and biodistribution were used to estimate absorbed doses for trastuzumab labeled with 90Y, the therapeutically relevant radionuclide. Absorbed doses were estimated for the liver, kidneys, spleen, and tumor. A time–activity curve for blood was generated by determining the relative activity concentration from ROIs over the heart on repeated microPET images. The curve was then scaled to fit the activity concentration in collected blood at the time of dissection by extrapolating the monoexponential clearance phase of the curve. The activity concentration in liver, spleen, and kidneys was determined by γ-counting after dissection. The shape of the blood time–activity curve was used to construct a time–activity curve for each organ. The curve was scaled so that the activity concentration of the curve yielded the measured concentration at the time of dissection.
Tumor kinetics were obtained using the tumor ROI. Activity concentration in dissected tumor was fit to an extrapolated plateau in the time–activity curve. All curves were converted to represent physical-decay–corrected 86Y-trastuzumab uptake (% injected activity per gram tissue, %IA/g). Assuming the same distribution for 90Y-trastuzumab, the cumulated activity concentration (Ã/g) was calculated by integrating the decay-corrected uptake curves with the physical half-life of 90Y:
 Eq. 1 where A0 is the total amount of 90Y-trastuzumab activity injected in the mouse (Bq), f(t) is the time-dependent uptake of 90Y-trastuzumab (%IA/g), and λ is the decay constant of 90Y (3.0038·10−6 s−1).
Absorbed doses were calculated following the MIRD formalism (19). Absorbed fractions of electron energy emitted from a homogeneous distribution of 90Y in spheres of various sizes (20) were used for tumor absorbed dose calculations. Recently published murine-specific S factors (21) were used to calculate self and cross-organ absorbed dose for liver, spleen, and kidneys. In the work cited, murine S factors were generated on the basis of the anatomic structure of an actual mouse as defined by noninvasive, high-resolution MRI. Using the previously developed 3D-ID package (18), organ contours were drawn and the resulting 3-dimensional organ volumes were convolved with individual radioisotope point kernels to calculate the S-factor values.
RESULTS
Tumor Take
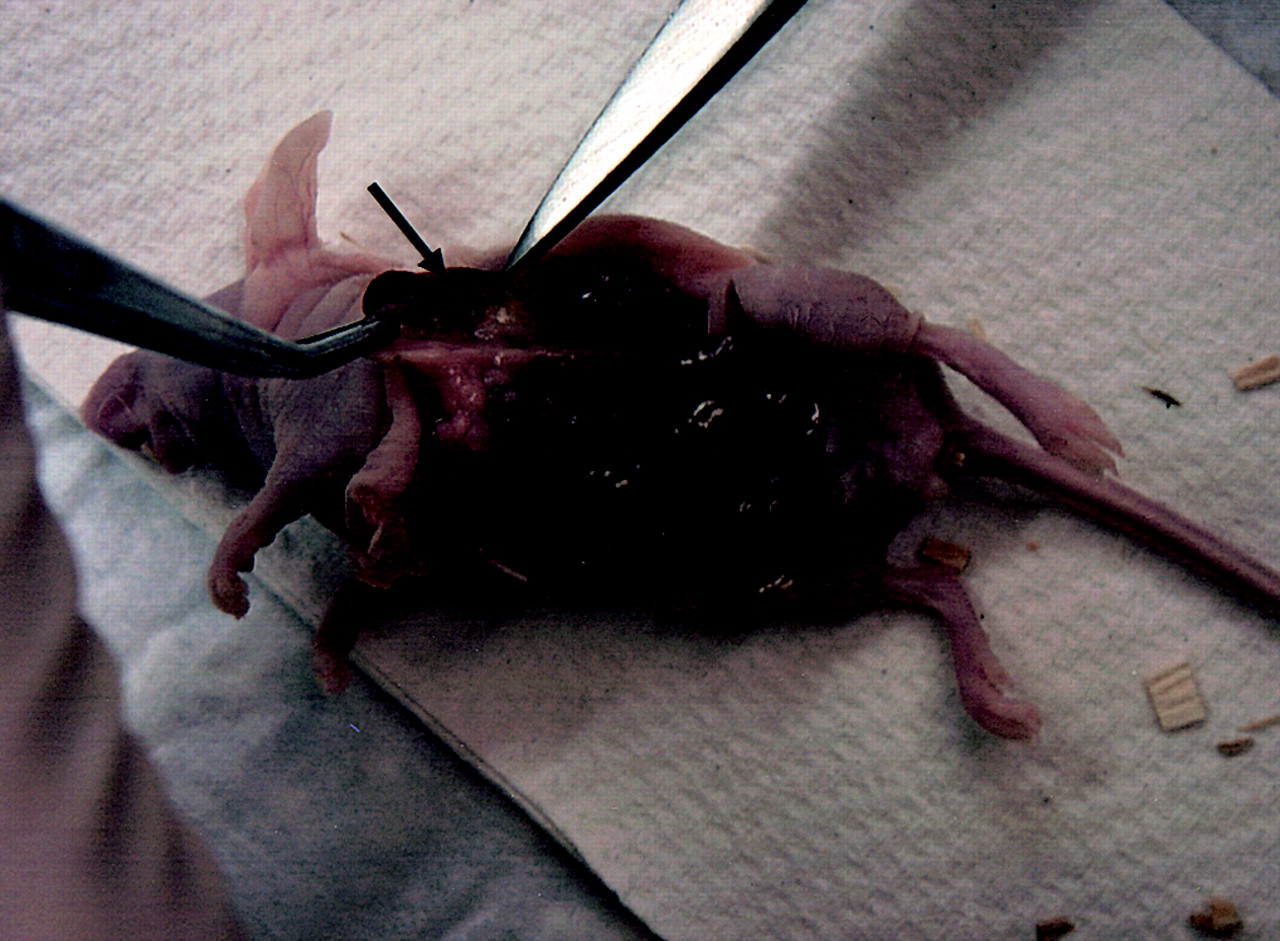
The efficiency of tumor formation in this ovarian carcinoma model was 100% (n = 23). A consistent tumor distribution pattern was observed with histologically confirmed tumor nodules always appearing within 2–3 wk on the ventral side of the spleen (Fig. 1). Tumor was also frequently found dispersed within the mesentery with small (∼1 mm), dense tumor nodules forming a “beads-on-a-string” configuration.

Dissected mouse. Arrow indicates location of small tumor nodules on spleen.
MicroPET Imaging
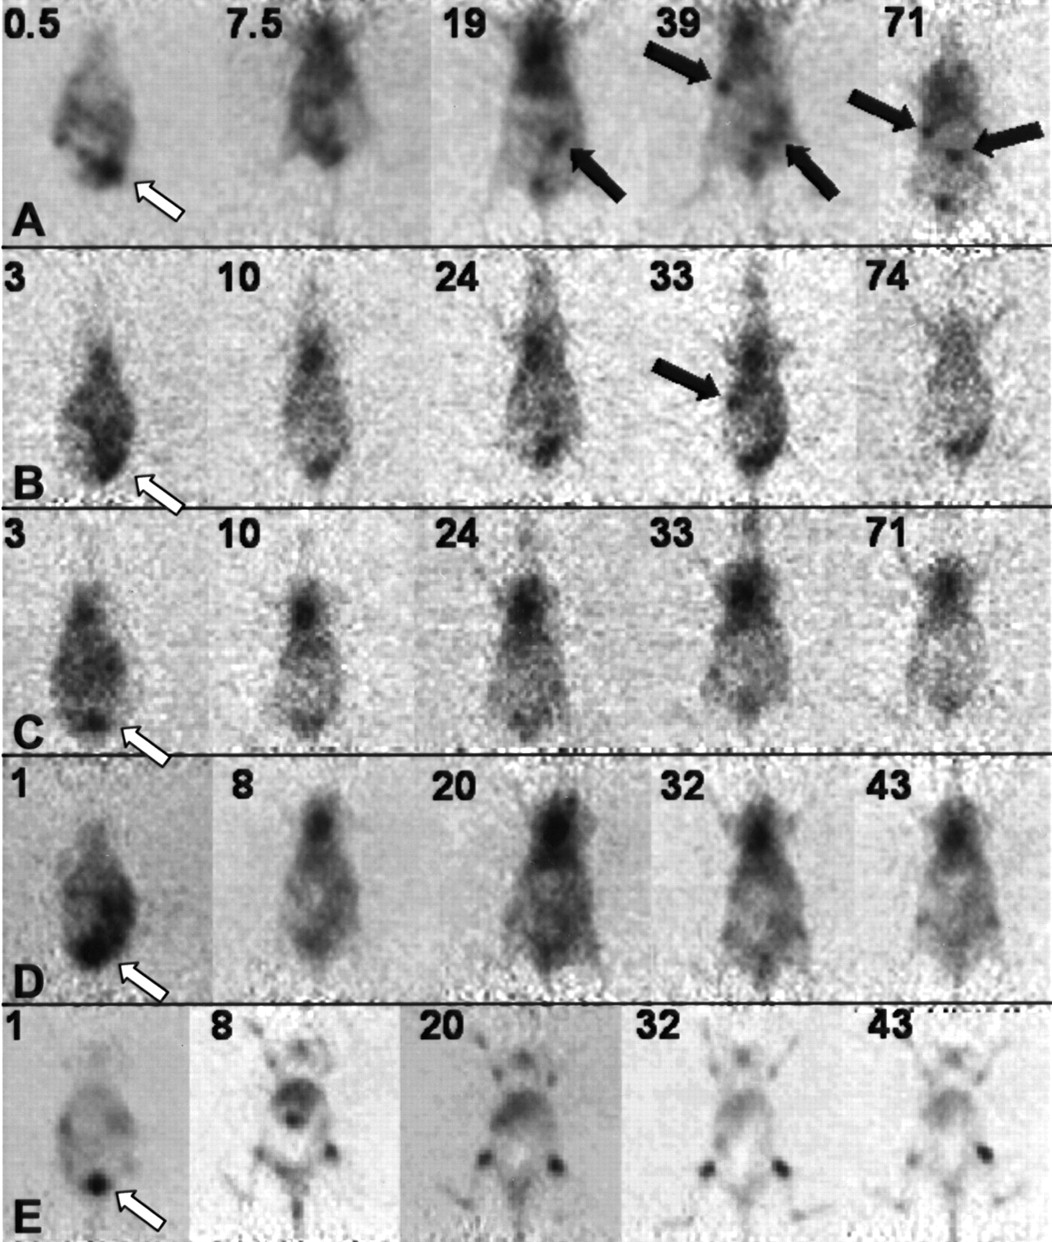
Time-sequential microPET images of coronal slices selected through the same plane (2 or 3 slices, ∼1 mm, above the bed) are shown in Figure 2. Images obtained using the specific mAb (n = 8) show high intensity at the injection site and subsequent accumulation of radioactivity in the circulation, as reflected by high cardiac signal intensity. This first becomes visible within 3 h and is most intense at ∼20 h after injection. Over this same time course tumor nodules become visible, first in the intestinal area and subsequently (e.g., by 30–40 h after injection) in the vicinity of the spleen. Tumor nodules were consistently visualized around the spleen in all animals. By 71 h, activity in the circulation is reduced and radioactivity persists at histopathologically confirmed tumor sites. In the 71-h image, the localization that is observed near the injection site corresponds to subcutaneous tumor nodules that occur as a result of the intraperitoneal tumor cell inoculation.

Longitudinal microPET coronal slice images of 86Y-trastuzumab (A), excess unlabeled trastuzumab (B), 86Y-trastuzumab on nontumor-bearing mice (C), 86Y-HuM195 (D), and free 86Y (E). Numbers in upper left corner of each panel indicate time after injection (in hours). Black arrows indicate mAb accumulation at confirmed tumor sites. White arrows indicate injection site.
Corresponding coronal slices for several different control experiments are also shown on Figure 2. In mice injected with a 100-fold excess of unlabeled trastuzumab (n = 3), tumor localization was less apparent. In tumor-free mice (n = 3), the radioactivity distribution over time was similar to that of the tumor-bearing mice with the exception that the dominant signal intensity arose from activity in the circulation; accumulation at sites that would typically contain tumor nodules was not evident. The distribution pattern seen with the irrelevant, anti-CD33 mAb (n = 6) was similarly dominated by activity in the circulation.
Images obtained after the administration of free 86Y (likely to be 86Y-phosphate on injection; n = 4) showed, as expected, accumulation in bone. The whole skeleton was visualized in these studies, with a slightly higher uptake around the various joints. These studies were useful in ensuring that the pattern observed with the specific mAb was due to radiolabeled mAb localization rather than localization of free 86Y, as might arise because of degradation of the chelated mAb. Such a pattern was only observed to a small extent, at 43 h after injection for the irrelevant control studies.
MRI
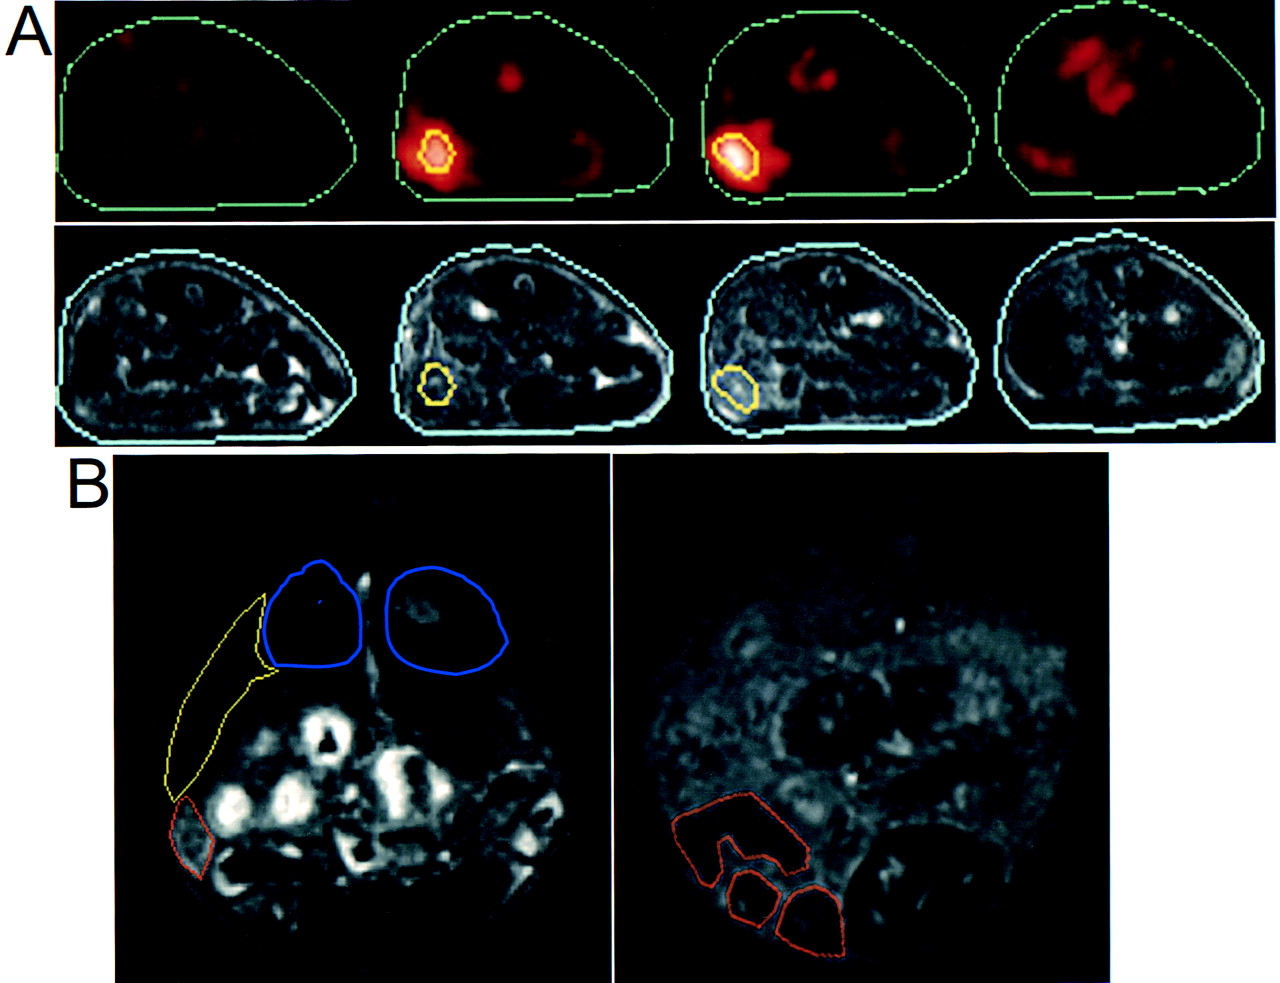
Figure 3, illustrates the typical tumor distribution observed in our model. In Fig. 3A, high-resolution transverse MR image slices obtained at 1.5 T are registered to corresponding microPET slices, providing anatomic context regarding the location of tumor nodules. The images in Fig. 3B depict multiple small (<1-mm diameter) tumor nodules associated with the spleen (left panel) and the mesentery (right panel).

(A) High-resolution transverse MR image slices, registered to corresponding microPET slices. Contours depicting outer periphery of mouse and also collection of tumor nodules near spleen are shown. (B) Two transverse MR slices, obtained on small-animal (4.7 T) scanner, are shown. Two slices are taken at different transaxial positions. Slice on left is through spleen (yellow contour), kidneys (blue), and tumor nodules (orange). Slice on right is posterior to left slice and depicts multiple small tumor nodules in mesentery.
Pharmacokinetics
Whole-body clearance was determined from the total counts in each image set. The specific mAb had the slowest clearance (t1/2 = 160 ± 10 h [mean ± SE]), but not significantly different from that of the irrelevant HuM195 (t1/2 = 150 ± 50 h) or free 86Y (t1/2 = 140 ± 50 h). Controls with an excess of unlabeled specific mAb had a more rapid whole-body clearance (t1/2 = 90 ± 20 h), similar to that of specific mAb in nontumor-bearing mice (t1/2 = 110 ± 60 h).
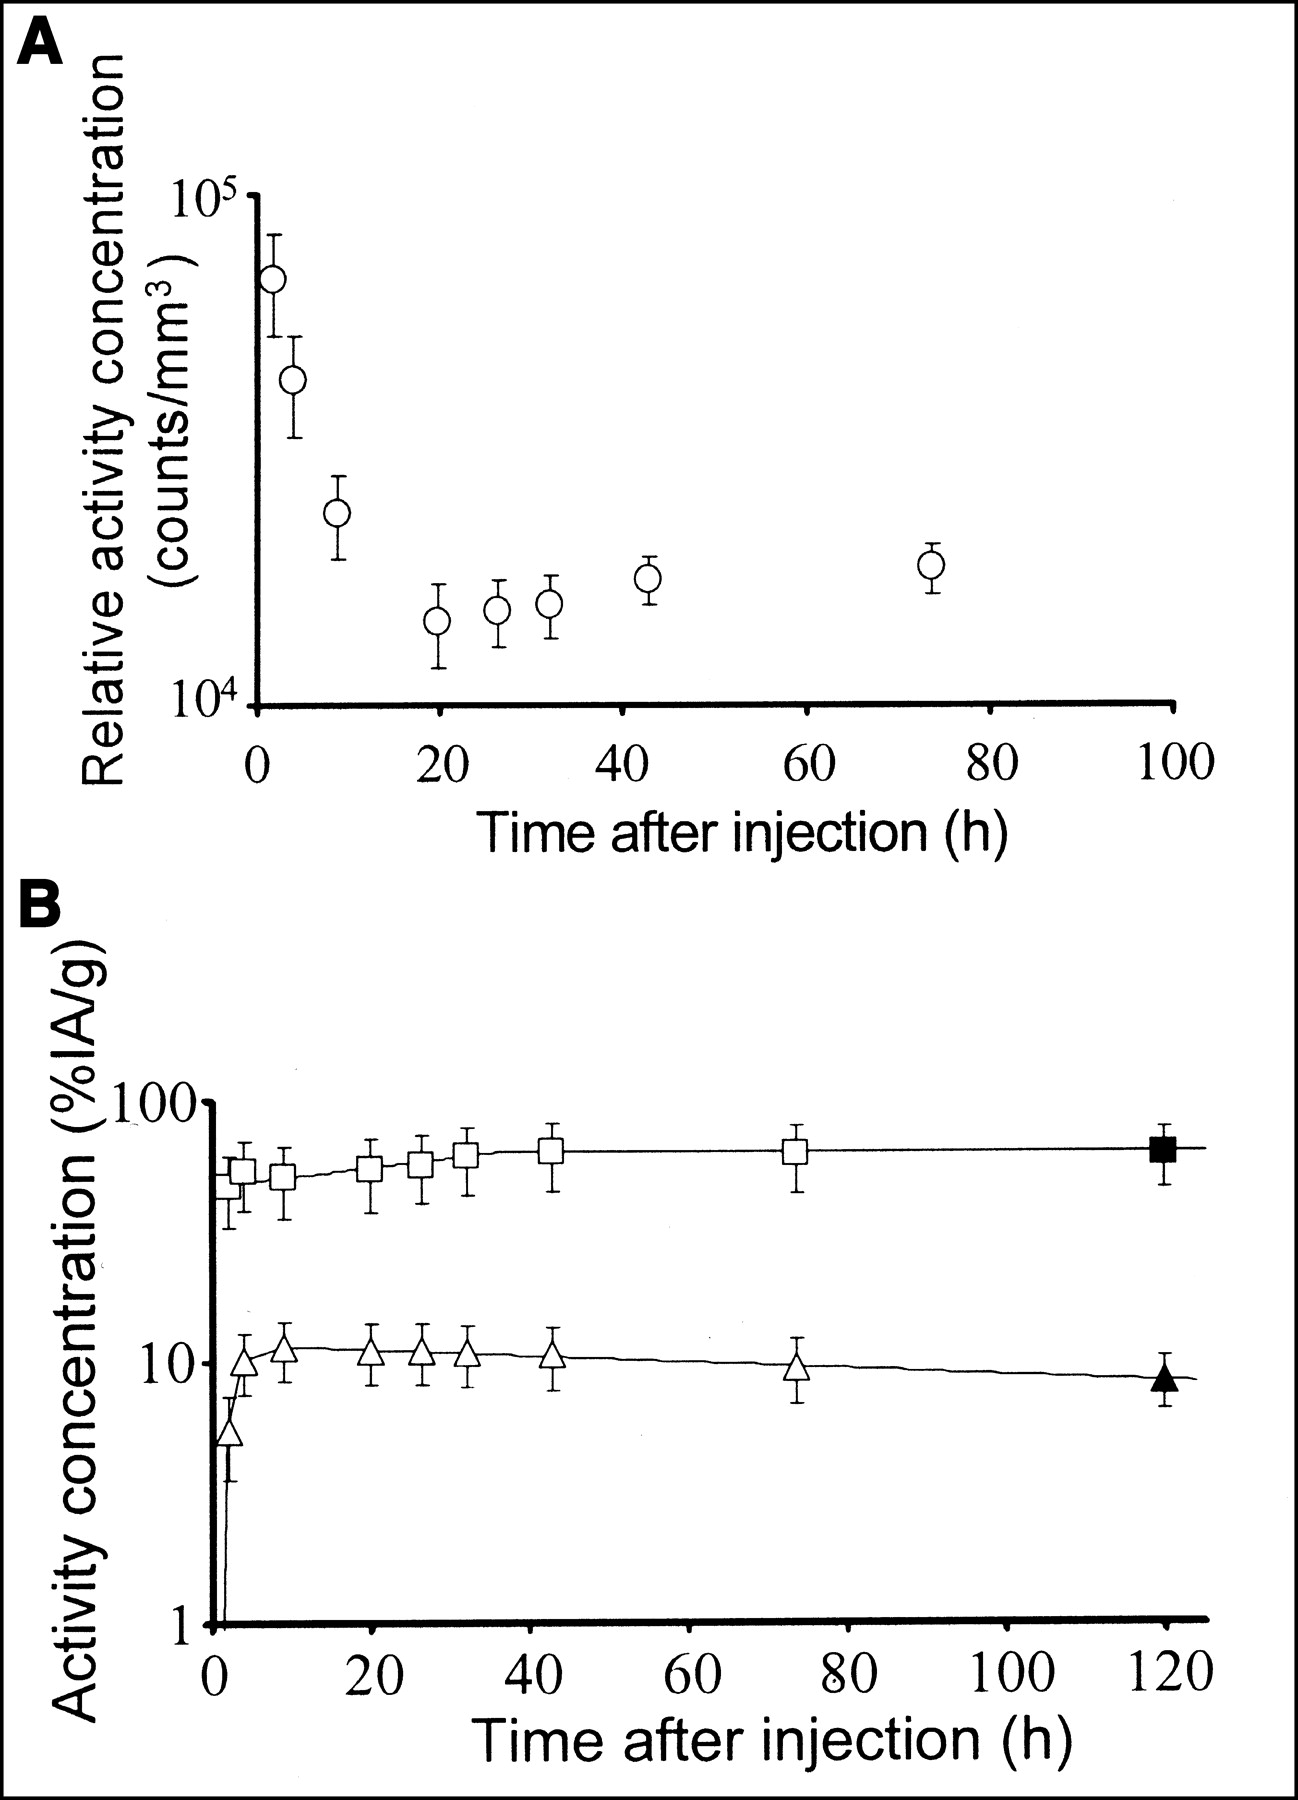
The group of mice receiving the specific mAb was evaluated for tumor and organ dosimetry. Initially, the activity concentration over the injection site decreased rapidly, reflecting redistribution in the circulation. This was followed by a slow uptake to a plateau level due to tumor at the trocar wound site (Fig. 4A). Blood kinetics showed a rapid uptake phase, followed by a slow clearance. Tumor had an essentially instantaneous uptake, slowly increasing to the stable maximum activity concentration at around 40 h after injection (Fig. 4B).

(A) Time–activity curve over injection site. Relative activity concentrations were determined by drawing ROIs on microPET image sets. Data are corrected for acquisition time, physical decay, and background. Error bars represent SE. (B) Time–activity curves for blood (triangles) and tumor (squares). Open symbols represent relative activity concentration (e.g., pharmacokinetics) derived from repeated microPET imaging. Activity concentrations (%IA/g) in dissected tissue (solid symbols) were used to quantitate image-based relative concentrations. Error bars represent combined standard uncertainty. Lines show fits used for cumulated activity calculations.
Biodistribution
The radioactivity distribution, obtained by well scintillation (γ) counting of excised tissues is shown in Figure 5. Uptake was represented as the organ-to-blood activity concentration ratio. The highest uptake, 7.4 ± 0.9 (mean ± SE), was found for 86Y-trastuzumab specific mAb on tumor. When a 100-fold excess of unlabeled trastuzumab mAb was added, the uptake in tumor was reduced to 2.2 ± 0.1. With the irrelevant, anti-CD33 mAb the uptake was 0.4 ± 0.1.
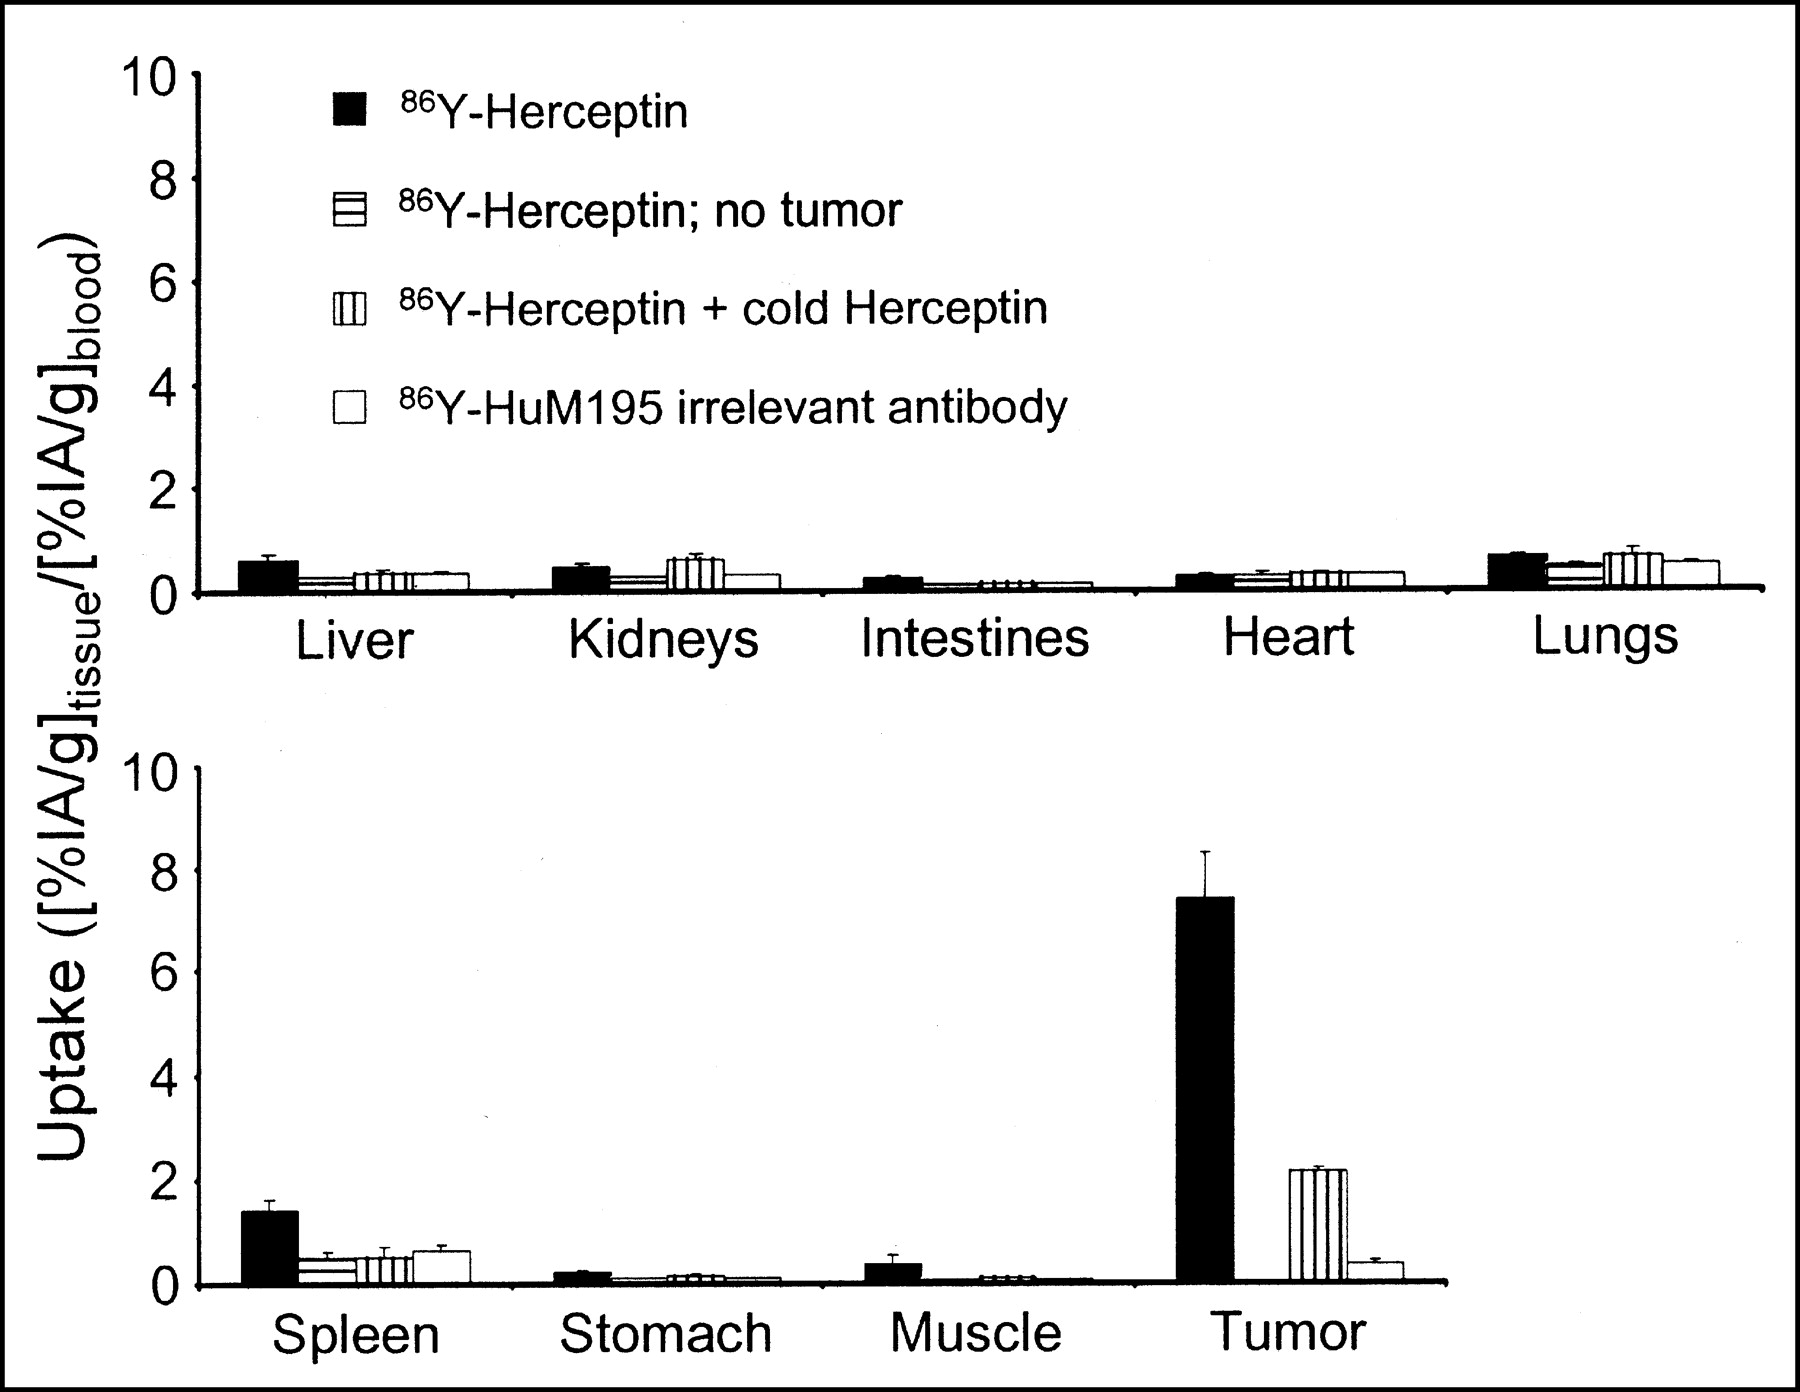
Uptake in various tissues 6 d after intraperitoneal injection with 86Y-trastuzumab (86Y-Herceptin), excess unlabeled (cold) trastuzumab, and 86Y-HuM195. Mean values and SE are shown.
Spleen had the second highest uptake for the specific mAb with an activity concentration 1.4 ± 0.2 greater than that of blood. The irrelevant mAb gave a slightly lower value of 0.7 ± 0.1. The increased specific uptake may be due to the accumulation of mAb in sites of occult disease within the spleen. Organ-to-blood activity concentration ratios for free 86Y approached infinity due to the exceedingly low radioactivity concentration in blood.
Dosimetry
Absorbed dose to tumor and select organs was calculated for mice receiving 90Y-trastuzumab. Activity concentrations determined from γ-counting dissected tissue was used to scale the ROI contents of the microPET images. The absorbed dose to the kidneys was 0.31 Gy/MBq 90Y-trastuzumab. The liver received 0.48 Gy/MBq, and the spleen received 0.56 Gy/MBq. Because tumors varied in size, calculations were made for spheres of various radii. 90Y activity was assumed to be uniformly distributed throughout the spheres. Absorbed dose to tumors varied from 0.10 Gy/MBq for radius = 0.1 mm to 3.7 Gy/MBq for radius = 5 mm. Results are summarized in Table 1.
Absorbed Doses to Organs and Tumors of Varying Sizes After Intraperitoneal Injection of 90Y-Trastuzumab
DISCUSSION
There is now a preponderance of evidence to suggest that radioimmunotherapy will be most successful in the treatment of micrometastatic disease (22–24). Most animal models evaluating tumor response rely on tumor volume measurements obtained by external, caliper-based measurements. Because this approach is not amenable to the evaluation of therapy against micrometastases, the preclinical evaluation of such is usually performed by assessing animal morbidity, secondary to macroscopic growth of the micrometastases (12). Using a positron-emitter–labeled mAb and microPET imaging we have demonstrated the ability to image, monitor targeting kinetics, and perform dosimetry of micrometastases at clinically relevant dimensions, noninvasively.
This approach is fundamentally different from studies examining gene expression, in which a reporter gene is cotransfected with the gene sequence to be studied (25–27). The ability to visualize disease with this approach is critically dependent on the mAb chosen, accessibility of the tumor cells to the injected mAb, and the degree to which the targeted antigen is expressed on tumor cells. These conditions are analogous to the conditions required for successful imaging in patients.
Relative to other small-animal imaging modalities (e.g., optical and MRI), microPET is characterized by a very high sensitivity but limited resolution. The high sensitivity is of great advantage in the detection of minimal disease over the whole body. Using microPET to identify the sites of metastatic spread and then using MRI to image these sites at high resolution, it is possible to use these 2 modalities in a complementary fashion.
The β-particle emitter, 90Y, is one of the most frequently used radionuclides for targeted radionuclide therapy (2,28–30). Recently, the Food and Drug Administration approved use of the 90Y-anti-CD20 mAb (90Y-ibritumomab tiuxetan [Zevalin]; IDEC Pharmaceutical Corp.) for treating various non-Hodgkin’s lymphomas (31). 90Y does not emit photons that can be used to obtain pharmacokinetics; biodistribution for dosimetry calculations is, therefore, typically obtained by imaging using the surrogate radiometal 111In. Although this radionuclide has been shown to have a generally similar behavior to 90Y, several differences have been noted (3,4,32). Using the chemically identical positron emitter, 86Y, the true distribution of the therapeutic radionuclide, 90Y, is used in this work.
The methodology outlined in this work for microPET-based dosimetry overcomes several important limitations in direct microPET quantitation. As noted in the methods, microPET quantitation can be influenced by the position of tissue relative to the central axis of the camera and also by the tissue surrounding the ROI. In imaging micrometastases, wherein the activity containing volume is below the intrinsic resolution of the camera, partial-volume effects also become important. These concerns were addressed by relating the time course of PET measurements to γ-counting results and by maintaining ROIs that were greater than the apparent intensity volume.
CONCLUSION
For all injected compounds, the relative microPET image intensity of the tumor matched the subsequently determined 86Y uptake. Coregistration with MR images confirmed the position of 86Y uptake relative to various organs. Radiolabeled trastuzumab mAb was shown to localize to sites of disease with minimal normal organ uptake. Dosimetry calculations showed a strong dependence on tumor size. These results demonstrate the usefulness of combined microPET and MRI for the evaluation of novel therapeutics.
Acknowledgments
We thank Virginia Pellegrini, BS, for providing excellent assistance with cell culture. This work was supported, in part, by National Institutes of Health/National Cancer Institute grants CA-08748, 1R24CA83084, R24CA83084, R01CA62444, and P01CA86438; by U.S. Army grant DAMD17-00-1-0429; by Department of Energy grant DE-FG02-86ER-60407; and by a Swedish Cancer Society Fellowship.
Footnotes
Received Nov. 5, 2002; revision accepted Mar. 24, 2003.
For correspondence or reprints contact: Stig Palm, PhD, Department of Medical Physics, Memorial Sloan-Kettering Cancer Center, 1275 York Ave., New York, NY 10021.
E-mail: palms{at}mskcc.org
REFERENCES
In this issue


Jump to section
Related Articles
Cited By...
- Preclinical Evaluation of 86Y-Labeled Inhibitors of Prostate-Specific Membrane Antigen for Dosimetry Estimates
- Preparation, Biological Evaluation, and Pharmacokinetics of the Human Anti-HER1 Monoclonal Antibody Panitumumab Labeled with 86Y for Quantitative PET of Carcinoma
- Direct Visualization of Heterogeneous Extravascular Distribution of Trastuzumab in Human Epidermal Growth Factor Receptor Type 2 Overexpressing Xenografts
- Alpha-Particle Emitting Atomic Generator (Actinium-225)-Labeled Trastuzumab (Herceptin) Targeting of Breast Cancer Spheroids: Efficacy versus HER2/neu Expression