


Abstract
Myocardial blood flow (MBF) and myocardial flow reserve (MFR) measured with PET have clinical value. SPECT cameras with solid-state detectors can obtain dynamic images for measurement of MBF and MFR. In this study, SPECT measurements of MBF made using 99mTc-tetrofosmin were compared with PET in the same patients. Methods: Thirty-one patients underwent PET MBF rest–stress studies performed with 82Rb or 13N-ammonia within 1 mo of their SPECT study. Dynamic rest–stress measurements were made using a SPECT camera. Kinetic parameters were calculated using a 1-tissue-compartment model and converted to MBF and MFR. Processing with and without corrections for attenuation (+AC and −AC), patient body motion (+MC and −MC), and binding of the tracer to red blood cells (+BB and −BB) was evaluated. Results: Both +BB and +MC improved the accuracy and precision of global SPECT MBF compared with PET MBF, resulting in an average difference of 0.06 ± 0.37 mL/min/g. Global MBF and detection of abnormal MFR were not significantly improved with +AC. Global SPECT MFR with +MC and +BB had an area under the receiver-operating curve of 0.90 (+AC) to 0.95 (−AC) for detecting abnormal PET MFR less than 2.0. Regional analysis produced similar results with an area under the receiver-operating curve of 0.84 (+AC) to 0.87 (−AC). Conclusion: Solid-state SPECT provides global MBF and MFR measurements that differ from PET by 2% ± 32% (MBF) and 2% ± 28% (MFR).
PET measurement of myocardial blood flow (MBF) and myocardial flow reserve (MFR) has been shown to have incremental benefit over relative myocardial perfusion imaging (MPI) for diagnosis (1–3) and prognosis (4–6). However, whereas 6.4 million MPI studies are done annually in North America, less than 1% are done with PET (7,8). Measuring MBF is difficult with traditional SPECT cameras because of the limited sensitivity and lower temporal resolution compared with PET. Despite these challenges, dynamic acquisitions with rapid sequential rotations (9) and spline-based 4-dimensional reconstruction approaches (10) have demonstrated the potential for SPECT to provide accurate MBF measurements. The introduction of dedicated solid-state cardiac cameras greatly facilitates the acquisition protocol for dynamic SPECT imaging because of their improved sensitivity and temporal resolution (11,12). Animal studies using microspheres have shown that these solid-state cardiac cameras can accurately measure MBF using either 201Tl or 99mTc-based standard perfusion tracers (13). Human studies have shown that indices of flow correspond well with coronary angiography using sestamibi (14), tetrofosmin (15), and thallium (16). Recently, a SPECT flow index, measured using tetrofosmin, has shown good sensitivity (70%) and specificity (78%) for detecting abnormal flow as measured in the same patients with ammonia PET (17). To convert indices of flow into MBF, the flow-dependent extraction fraction for SPECT tracers in humans is needed.
We measured SPECT MBF with 99mTc-tetrofosmin, using a dedicated cardiac SPECT camera and a Renkin–Crone model for the extraction fraction, and evaluated the incremental value of corrections for body motion, blood binding, and attenuation against PET MBF measured in the same patients.
MATERIALS AND METHODS
Patient Population
We recruited 32 patients with known coronary artery disease. Each patient underwent both PET and SPECT MPI studies within 1 mo. One patient withdrew from the study before completing both sets of images, and 2 studies were only partially available (1 rest list-mode file was not saved, 1 stress injection had inappropriate timing), leaving 29 paired rest–stress and 2 unpaired studies (60 scans in total). The average patient age was 64 ± 11 y, and the mean body mass index was 27.9 ± 4.7 kg/m2. Twenty-seven (87%) patients were men and 6 (19%) had diabetes mellitus. The study was approved by the Ottawa Health Science Network Research Ethics Board, and all patients provided informed written consent.
PET Imaging
PET studies were acquired using either 82Rb (n = 25) or 13N-ammonia (n = 6), on a Discovery 690 PET/CT scanner (GE Healthcare) according to our clinical protocol. The activity injected at both rest and stress was 10 MBq/kg (82Rb) or 5 MBq/kg (ammonia). Tracer was delivered mechanically as a 30-s bolus (82Rb) or as a rapid bolus by hand (ammonia). MBF was based on data acquired over 8 min (82Rb) or 4 min (ammonia). Stress was induced using dipyridamole (0.14 mg/kg/min for 5 min). Motion correction was applied as described for the SPECT studies. Kinetic analysis was performed using FlowQuant software with a 1-tissue-compartment model and dual-spillover correction as per our clinical protocol (18).
SPECT Image Acquisition
SPECT data were acquired in list-mode using the Discovery NM530c cardiac camera. Rest images were obtained for 11 min starting immediately before injection of 316 ± 71 MBq of 99mTc-tetrofosmin (Fig. 1). The patient returned at 45 min after injection for a 5-min static resting acquisition (corresponding to the standard time for MPI). Without repositioning, the patient was stressed using dipyridamole (0.14 mg/kg/min for 5 min) with 11 min of list-mode data acquired starting immediately before the injection of 1,122 ± 170 MBq of tetrofosmin. Both rest and stress injections were delivered mechanically over 30 s. Finally, a standard set of stress perfusion images was acquired at 45 min after tracer injection. The order of PET and SPECT scanning was based on camera availability. The average difference in acquisition dates was 19 ± 9 d, with 12 (39%) of the SPECT images obtained before PET imaging.

Acquisition protocol for SPECT MBF imaging. List-mode data are acquired for 11 min starting immediately before tracer injection. Data are binned into 9 × 10, 6 × 15, and 4 × 120 s dynamic frames for reconstruction and analysis. A 1 × 300 s static image is acquired just before stress to estimate residual activity remaining from rest imaging.
SPECT Image Processing
Similar to our previous animal work (13), list-mode data were rebinned into a dynamic series of projections (9 × 10, 6 × 15, and 4 × 120 s) and reconstructed using manufacturer-supplied iterative reconstruction software (30 iterations), both with and without CT-based attenuation correction (+AC and −AC, respectively), followed by Butterworth filtering (order 7, 0.37 cycles/cm). AC used the CT map acquired during PET/CT imaging, which was manually aligned with the SPECT image using online quality assurance tools (13,19). Kinetic analysis was performed using FlowQuant software (18) and applying a 1-tissue-compartment model with spillover correction from blood to myocardium only. The stress dynamic image series was corrected for residual rest activity by subtracting a scaled version of the static rest image acquired just before injection of dipyridamole. Analysis was performed with and without binding of the tracer to red blood cells (+BB and −BB, respectively) using the function derived from a porcine model (13), and scaled to correct for differences between humans and pigs in the equilibrium plasma–to–whole-blood (PWB) concentration (Eq. 1). Eq. 1where t is time (min). In addition, images were processed with and without motion correction (+MC and −MC, respectively) where each dynamic frame was visually compared, in midventricular coronal, sagittal, and transverse planes, with a contour outlining the heart in the final frame. The contour was adjusted using a manually defined count threshold to align with the myocardial edge. A rigid-body translation (without rotation) was applied frame by frame as needed to center the activity within the contour.
The global left ventricular K1 values were fit to the PET plasma flow (MBF × [1-hematocrit]) or MBF if a blood-binding correction was not performed, using the Renkin–Crone model (parametrized by α and β, Eq. 2) and a nonlinear least-squares fitting algorithm. Eq. 2The model fit; accuracy of conversion of SPECT K1 to MBF; and corresponding sensitivity, specificity, and an area under the receiver-operating curve (AROC) for an abnormal PET global MFR of less than 2.0 (5) were assessed using 50 repeats of 2-fold cross-validation (20). For 2-fold cross-validation, the patients are randomly divided into 2 groups. One group is used to estimate the model fit parameters, and the other group is used to test the fitted model’s accuracy and vice versa, giving 2 estimates of the model fit parameters and 2 evaluations of accuracy. Fifty repetitions of the process generate 100 sets of model parameters with associated accuracy measures. For each parameter or measure, the mean and SD of the 100 values give the overall estimate for the value and its uncertainty. The mean fit parameters were used to calculate the MBF and MFR in each coronary artery territory (regional MBF and MFR), and a similar analysis was performed.
Differences in mean values were compared using paired t tests and differences in variances with F tests. AROCs were calculated nonparametrically with the trapezoidal rule, and regional AROC were compared using the Mann–Whitney U statistic (DeLong approach) (21). A P value of less than 0.05, adjusted using a Bonferroni adjustment for multiple comparisons (n = 12) to a P value of less than 0.004, was considered significant.
RESULTS
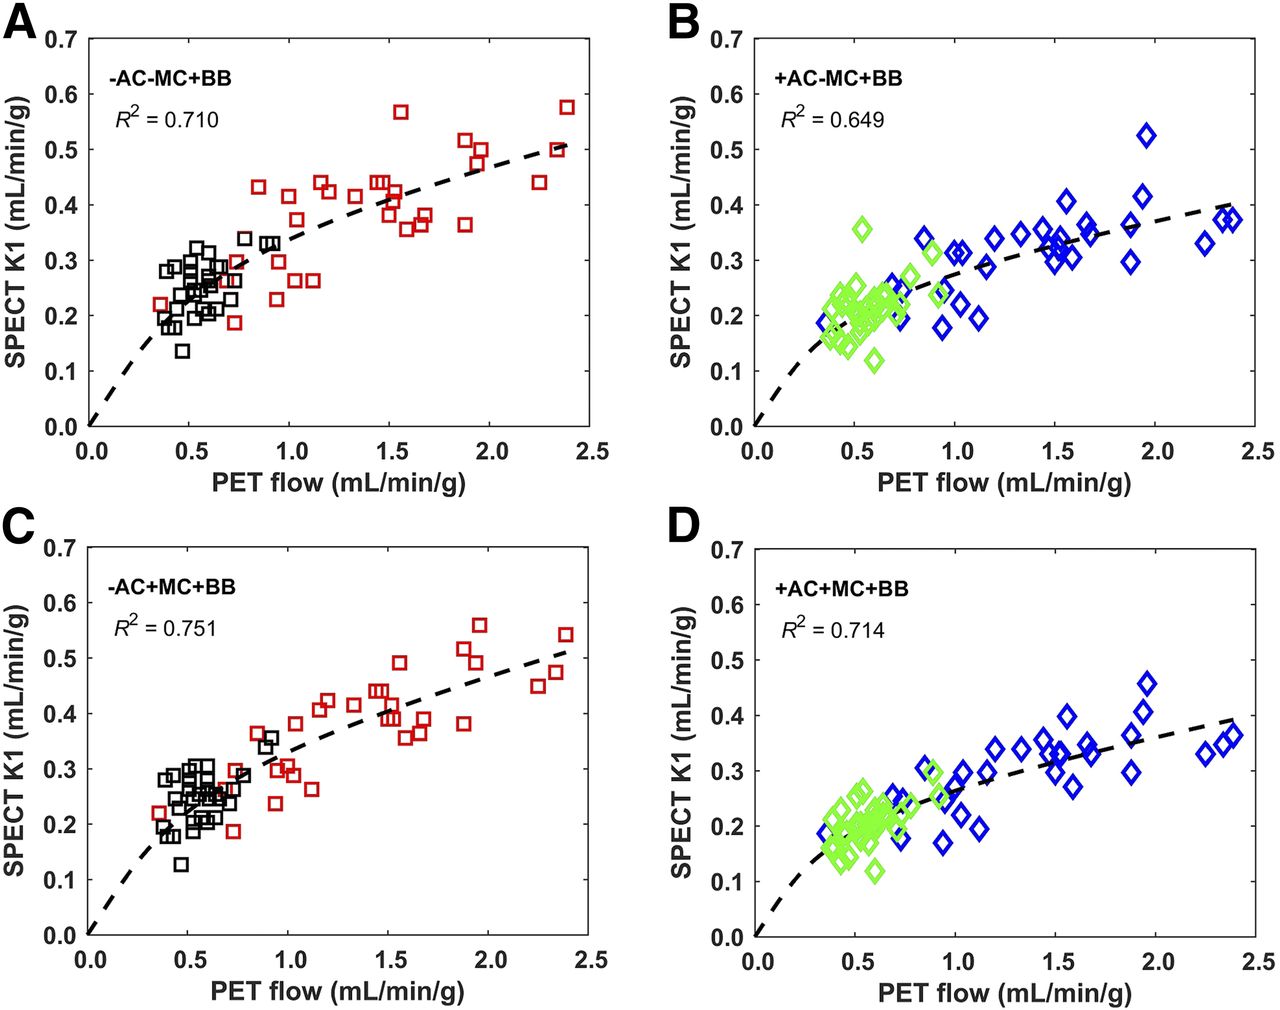
The patient characteristics and relationship between SPECT K1 and PET MBF were similar for both PET tracers (Supplemental Fig. 1; Supplemental Tables 1 and 2 [supplemental materials are available at http://jnm.snmjournals.org]), and so the data were pooled. The R2 of the Renkin–Crone model fit was between 0.61 and 0.75 for all methods (Fig. 2; Table 1) and was improved with +MC by an average of 0.05. +MC significantly increased R2 over –MC for ±AC/+BB and +AC/–BB (P < 0.001 for all), but not for –AC/–BB (P = 0.005). From the cross-validation analysis (Table 1), +MC increased the correlation of SPECT and PET MBF by an average of 0.05 over –MC; the increase was significant for ±AC/±BB (P < 0.001). +MC reduced the SD of the MBF difference in all cases (Table 1; Fig. 3; Supplemental Fig. 2).

Global SPECT K1 compared with PET MBF, incorporating tracer blood binding in the kinetic analysis. Results are for −AC/−MC/+BB (A), +AC/−MC/+BB (B), −AC/+MC/+BB (C), and +AC/+MC/+BB (D). The dashed line is mean fit to Renkin–Crone model for extraction fraction. Rest data points are in black and green, stress data points in red and blue.
Renkin–Crone Model Fitting, for Images With and Without MC, AC, and BB, and Associated Fit of SPECT to PET Global MBF

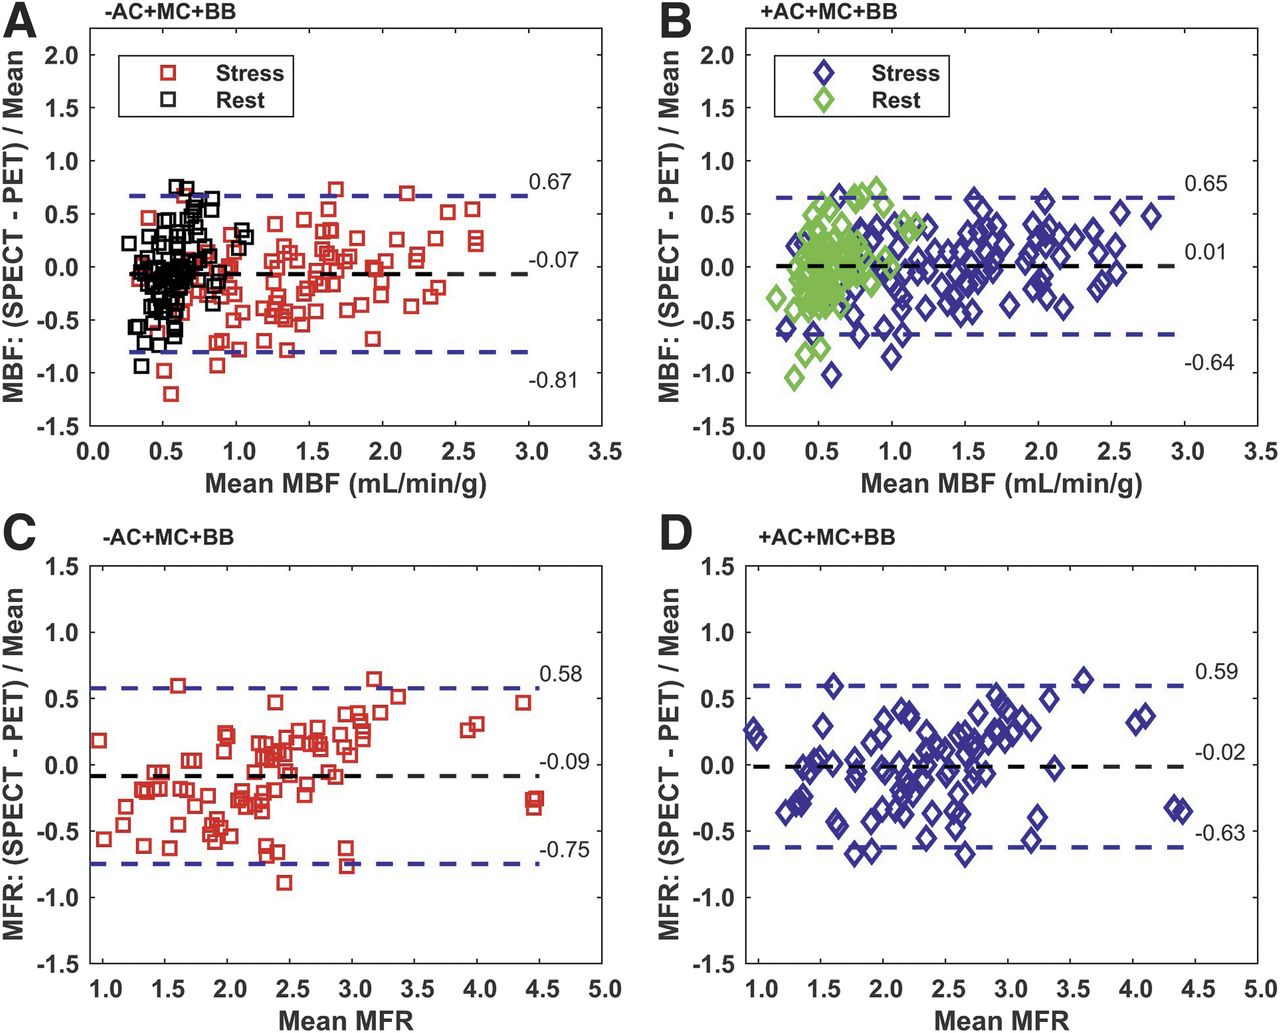
Global SPECT MBF (A and B) and MFR (C and D) compared with PET, without (−AC) (A and C) and with (+AC) (B and D) attenuation correction (n = 31 patients [MBF], n = 29 patients [MFR]). SPECT MBF values were calculated using mean of 50-repeat 2-fold cross-validation fit with a Renkin–Crone model for extraction fraction. MFR is stress MBF/rest MBF. Both motion and blood-binding corrections were incorporated in all kinetic analyses. Dashed lines indicate mean and ±1.96 SDs. For MBF, rest data points are in black and green, stress data points in red and blue.
The average increase in the R2 of the model fit due to BB was 0.06 (Table 1; Supplemental Fig. 1), and it was significant for –AC/±MC (P < 0.001) but not for +AC/±MC (P ≥ 0.007). The average increase in the correlation between SPECT and PET MBF due to BB was 0.06 and was significantly greater for all cases (±AC/±MC, P ≤ 0.001). +BB reduced the SD of the MBF difference. The change in SD was significant in all cases except +AC/−MC/−BB versus +AC/−MC/+BB (0.55 vs. 0.48, P = 0.006).
With AC, the R2 of the model fit was lower than with –AC for ±MC/+BB (P < 0.001) but greater for +MC/–BB (P < 0.001) and similar for –MC/–BB (0.63 vs. 0.61, P = 0.13). The correlations between SPECT and PET MBF were on average 0.02 worse for +AC than for –AC. –AC significantly increased the correlation for ±MC/+BB (P < 0.001) but not for ±MC/–BB (P > 0.02). +AC did not significantly change the mean or SD of the MBF difference (Fig. 3) except for the SD with −AC/+MC/+BB versus +AC/+MC/+BB (0.32 vs. 0.37, P = 0.0001).
The slopes and intercepts of the linear fits between SPECT and PET MBF were within 1 SD of 1.0 and zero, respectively, and were not significantly different (Supplemental Table 3). The changes in MBF relative differences (difference/mean) were similar to those for MBF difference (Table 1).
The global SPECT MFR from the cross-validation analysis (Fig. 3; Supplemental Fig. 2; Supplemental Table 4) had an AROC (Fig. 4) that ranged from 0.87 to 0.98 (Table 2). +MC consistently increased AROC but the change was only significant for –AC/+MC/–BB versus –AC/–MC/–BB (0.98 vs. 0.88, P < 0.001). +BB increased AROC for –AC/–MC (0.93 vs. 0.88, P < 0.001) but decreased AROC for –AC/+MC (0.95 vs. 0.98, P < 0.001) and caused no significant changes for +AC/±MC. AROC was consistently lower with +AC than –AC, with the changes all significant except for –MC/–BB (P = 0.19). Choosing an operating point that gave the highest sensitivity–specificity product yielded sensitivities between 78% and 100% and specificities between 70% and 100% (Table 2). Similar results were found for stress MBF (Supplemental Fig. 3; Supplemental Table 5).

Receiver-operating-characteristic curves for global (A) and regional (B) SPECT MFR compared with abnormal defined as PET MFR less than 2. *Significantly different AROC.
Sensitivity, Specificity, and AROC for Detecting Global PET MFR Less Than 2 with SPECT MFR for Different Correction Approaches
When regional MBF was considered, there were no statistically significant differences in the correlations between SPECT and PET for any individual pair of correction combinations (Table 3). However, in all cases, +MC had a higher correlation than the corresponding –MC (average difference, 0.06), +BB had a higher correlation than –BB (average difference, 0.07), and +AC had a higher correlation than –AC (average difference, 0.09). The highest correlation was r = 0.85, for +AC/+MC/+BB. The mean residual difference between regional SPECT MBF and PET MBF (Fig. 5) was not significantly different for any pair of correction combinations, except +AC/+MC/+BB versus –AC/+MC/+BB (0.05 vs. −0.03, P < 0.001). The SD in the fit residual consistently decreased with +MC, +BB, and +AC, with some differences reaching statistical significance (Table 3). The regional MFR values, determined on the basis of the mean Renkin–Crone model parameters (Table 1), gave consistently higher AROC with +MC and +BB, but consistently lower AROC with +AC. However, none of the differences in AROC were statistically significant. For +AC/+MC/+BB, AROC was 0.84, with a 70% sensitivity and 86% specificity. For –AC/+MC/+BB, AROC was 0.87, with a 78% sensitivity and 80% specificity.
Linear Fit of SPECT to PET Regional MBF and Resulting Sensitivity, Specificity, and AROC for Detecting Regional PET MFR Less Than 2 with SPECT MFR for Different Correction Approaches
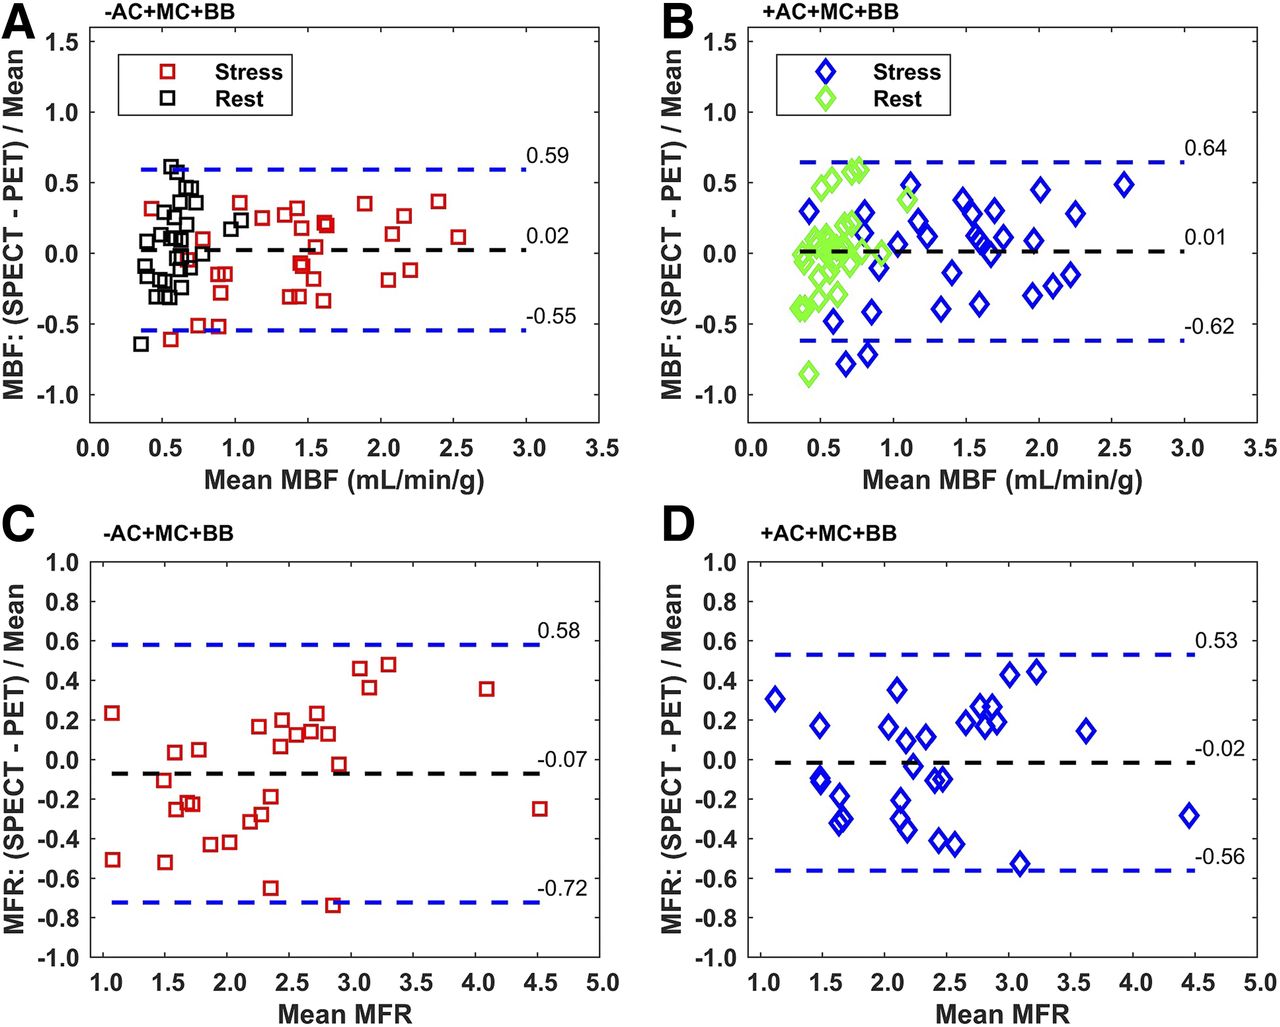
Regional SPECT MBF (A and B) and MFR (C and D) compared with PET, without (−AC) (A and C) and with (+AC) (B and D) attenuation correction (n = 180 regions [MBF], 87 regions [MFR]). Motion and blood-binding corrections are applied. Dashed lines indicate mean and ±1.96 SDs. Rest data points are in black and green, stress data points in red and blue.
DISCUSSION
Our study showed that global MBF measurements with SPECT (±AC/+MC/+BB), using a solid-state cardiac camera, correlated well (r = 0.85–0.89) with PET MBF measured in the same patients. Our results agreed with an earlier study that correlated a SPECT flow index with ammonia PET MBF (17). Our study extended the previous work by determining a suitable extraction fraction correction to convert K1 to an actual measurement of MBF. In addition, we found that global MBF accuracy was improved with MC and BB but not with AC. Our data showed a mean residual difference in SPECT and PET MBF of 0.06 ± 0.37 mL/min/g with all corrections. The sensitivity and specificity for detection of abnormal PET MFR was 100% and 80%, respectively, with an AROC of 0.95 (with −AC/+MC/+BB). Thus SPECT global MBF may provide additional clinical diagnostic and prognostic benefit compared with relative MPI, similar to PET, despite its reduced spatial resolution, sensitivity, and tracer extraction fraction. Although similar overall, there were instances of substantial difference between SPECT and PET MBF (Figs. 3 and 5). The value of SPECT MBF to the interpretation of individual cases will depend on its repeatability, which has yet to be evaluated. Evaluation of the incremental clinical value of measuring MBF and MFR with SPECT, and determination of optimal thresholds for normal measurements, will require further studies in a larger patient population.
Motion correction was found to consistently increase both the R2 of the Renkin–Crone model fit and the correlation between SPECT and PET MBF (Table 1). These results are consistent with previous PET MBF motion studies that showed errors as large as 240% in MBF (22) and for which MC improved accuracy (22,23). In our work, the reconstructed images were shifted to reduce frame-to-frame motion, but the attenuation map was not realigned to correct for motion-induced misregistration errors in the AC. Additional benefit might be obtained if the misregistration AC errors were also corrected. Cardiac and respiratory motion correction were not performed for either SPECT or PET scans, and these corrections may enhance image resolution and further improve MBF measurement accuracy.
Population-based correction for blood binding produced a consistent increase in the model fit and the correlation between SPECT and PET MBF. The Renkin–Crone model suggests a physiologic basis for the function that converts K1 to MBF. However, because the function parameters are empirically fit, the estimated function can also compensate for other factors, such as BB, inherent in the data. For example, MBF measured using time-of-flight PET with model parameters based on non–time-of-flight PET studies led to a 12% change in the MBF values (24). Recalibrating the model parameters leads to an improvement in the MBF values (25,26). The different Renkin–Crone parameters given in Table 1 reflect the incorporation of different factors such as tracer blood binding into the empiric K1-to-MBF function, and not changes in physiology. However, forcing these corrections into the form of the Renkin–Crone model may not provide as accurate a compensation as applying the corrections to the images themselves. A closer examination of cases with larger differences between the +BB and −BB results showed that the number of regions with nonphysiologic values (MFR < 0.9 or > 5) was greater, for example, with −AC/+MC/−BB (12/87) than for −AC/+MC/+BB (3/87). Exclusion of the nonphysiologic regions, such as was done in Nkoulou et al. (17), might improve the MBF and MFR correlations but also sacrifices information from those cardiac segments. There are limited human data on the Renkin–Crone parameters for tetrofosmin, but the 95% confidence intervals for the parameters in Table 1 overlap with those from the study by Shrestha et al. (10) and animal studies (13) (Supplemental Fig. 4; Supplemental Table 6).
Finally, AC was evaluated because most SPECT MPI studies are acquired without concurrent transmission imaging. Also, AC increases image noise, partly offsetting the gains in bias achieved through decreased regional heterogeneity. Different approaches to compensating for a lack of AC have been suggested: either restricting measurement to the MFR wherein the ratio compensates for regional attenuation effects (14,16), or normalizing so that resting MBF has a predefined population value (15). Our data suggest that an appropriate K1-to-MBF conversion function may allow calculation of true global MBF even in the absence of AC. Similar to studies with PET (27), our results indicated no consistent benefit to AC in the accuracy of global MBF or AROC. The myocardial tissue time–activity curve is a convolution of K1 with the arterial input function (18). Thus, because the average attenuation for the myocardium and the input function are similar, the global attenuation effects are largely cancelled out. There may, nevertheless, still be variability in regional MBF due to regional heterogeneity in the myocardial attenuation. Indeed, with regional MBF, AC consistently increased the correlation with PET MBF and consistently decreased the SD of the residuals (Table 3), suggesting that AC improves regional MBF estimation. However, because MFR is a ratio, it provides additional compensation for regional changes in attenuation and consequently, the AROC for detecting abnormal MFR from the regional analysis also shows no benefit from AC. One limitation of this study is that the CT scan used for AC was acquired during PET/CT imaging on a separate day, and this may have reduced the accuracy of the SPECT AC. A CT acquired in conjunction with the SPECT study might have improved coregistration and so increased the benefit of AC for measuring MBF, but confirming this would require further investigation.
The SPECT activity injected in this study corresponds to a patient radiation dose of 10 mSv (28). At this dose, the SPECT time–activity curves were similar in shape but noisier than the PET time–activity curves (Supplemental Fig. 5). Pig studies suggest that reducing the injected activity may be possible (29), but further human studies are needed to determine the extent to which patient dose can be reduced while maintaining an accurate MBF estimate. In addition to higher noise, tetrofosmin has a lower extraction fraction at high MBF, which reduces the contrast in K1 between normal and abnormal flow responses. Techniques that reduce the uncertainties in kinetic parameter estimation, such as the 4-dimensional reconstruction approaches proposed for dynamic imaging with conventional γ-cameras (10), might improve MBF estimation with dedicated cardiac SPECT systems, but evaluation of these algorithms will require additional studies. A further consideration in our study is that most of our subjects’ PET MBF was done with 82Rb, which, although used more commonly in the clinic, has a reduced extraction fraction at high MBF compared with ammonia. Both ammonia and 82Rb have similar diagnostic accuracy (3), but uncertainties in the PET flow measurement may have reduced the measured accuracy of the SPECT MBF. Despite a similar clinical performance between tetrofosmin and sestamibi, our results cannot be directly extended to sestamibi because we are unaware of any data confirming the extraction fraction function for sestamibi in humans. A final consideration is that the camera’s small field of view requires care in patient positioning to avoid truncation of the myocardium.
CONCLUSION
Measuring MBF and MFR in humans is feasible using a dedicated cardiac SPECT camera. Corrections for motion and tracer blood binding improved global MBF correlation and precision with PET MBF. Global MBF and detection of abnormal MFR were not significantly improved with +AC. With all corrections, SPECT global MBF and MFR differed from PET by 2% ± 32% (MBF) and 2% ± 28% (MFR).
DISCLOSURE
This study was supported by a research operating grant from GE Healthcare. R. Glenn Wells and Terrence D. Ruddy have received research grant support from GE Healthcare. Robert A. deKemp and Jennifer Renaud receive license revenues from the sale of FlowQuant™ and consult with Jubilant DraxImage Inc. No other potential conflict of interest relevant to this article was reported.
Footnotes
Published online Jun. 13, 2017.
- © 2017 by the Society of Nuclear Medicine and Molecular Imaging.
REFERENCES
- Received for publication February 1, 2017.
- Accepted for publication May 22, 2017.


Jump to section
Related Articles
Cited By...
- Precision of Myocardial Blood Flow and Flow Reserve Measurement During CZT SPECT Perfusion Imaging Processing: Intra- and Interobserver Variability
- Radiotracers to Address Unmet Clinical Needs in Cardiovascular Imaging, Part 1: Technical Considerations and Perfusion and Neuronal Imaging
- Quantitative clinical nuclear cardiology, part 2: Evolving/emerging applications
- Mars Shot for Nuclear Medicine, Molecular Imaging, and Molecularly Targeted Radiopharmaceutical Therapy
- 5-Year Prognostic Value of Quantitative Versus Visual MPI in Subtle Perfusion Defects: Results From REFINE SPECT
- Solid-State Detector SPECT Myocardial Perfusion Imaging