


Abstract
We studied the anatomic and functional changes in various brain areas during the course of Huntington's disease (HD) in a large cohort of mutation-positive individuals (n = 71) encompassing the complete range of disability (presymptomatic through stage V), and in healthy controls, for the purpose of defining both degenerative and dysfunctional brain changes in the same subjects. Methods: We used an MRI and unsupervised multiparametric segmentation procedure based on a relaxometric approach to measure in vivo brain volumes in 71 subjects with presymptomatic to advanced HD. The same population was evaluated by 18F-FDG PET to assess variations in brain glucose metabolism. To predict age at onset in unaffected mutation carriers, we considered the estimated number of years from each subject's age to manifested HD symptoms, for a given expanded triplet number. Results: Age-adjusted analyses confirmed that the 71 subjects as a group, as well as the subgroup of 24 unaffected presymptomatic subjects at risk for HD, had significantly smaller gray-matter and white-matter volumes and larger cerebrospinal fluid volumes than did controls (P < 0.0001). In the 24 presymptomatic subjects, we observed a significant inverse linear correlation between white-matter volume reduction and the estimated time to symptom onset (r2 = 0.39; P = 0.0011). Both clinically unaffected subjects at risk for HD and symptomatic patients had significantly decreased glucose uptake in the cortex (frontal and temporal lobes) and striatum (caudate and putamen). HD subjects who were followed up longitudinally showed progressive white-matter reduction in the preclinical subjects (n = 10) and decreased glucose uptake in the cortex and striatum in affected (n = 21) and preclinical (n = 10) subjects. Conclusion: White-matter volume loss may precede gray-matter atrophy and may be associated with neuronal dysfunction in early disease.
Huntington's disease (HD) is an autosomal dominant neurodegenerative disease caused by a CAG expansion mutation over 35 trinucleotide repeats (1). The number of CAG repeats is a major determinant of the age at onset of HD and other poly(CAG) diseases. For years before HD manifests unequivocally, many mutation carriers have “soft” motor signs associated with subtle behavioral and neuropsychological changes (2,3). Disease progression is weakly dependent on CAG length but is closely related to progressive neuronal loss in the striatum (4,5). Although the striatum has for long been considered the cerebral area most frequently involved in HD (6), more recent reports have highlighted widespread cortical and subcortical brain atrophy (7,8) and functional cortical brain changes (9) early in the disease course. Moreover, studies on brain metabolism in HD have suggested that progressive neuronal dysfunction may influence the clinical manifestations (10–13).
Early research on HD focused on volumetric changes in brain gray matter (GM), mostly involving the basal ganglia and cortex. More recent studies have reported cortical and striatal atrophy and changes in brain white matter (WM) (7,8,14–16). The difficulties in ascertaining and studying patients in the presymptomatic stages (HD mutation carriers) and in obtaining both structural and functional data from an identical cohort of patients have left open the key questions of whether brain atrophy and hypometabolism start before clinical symptoms and, if so, by how long they precede disease onset.
We aimed to define both degenerative and dysfunctional brain changes in a large cohort of HD subjects over time and compare the results with identical measurements in healthy controls. We used an MRI and unsupervised multiparametric segmentation procedure based on a relaxometric approach (17) to measure in vivo brain volumes in 71 subjects with presymptomatic to advanced HD. The same population was evaluated by 18F-FDG PET to assess variations in brain glucose metabolism.
MATERIALS AND METHODS
Clinical Assessment
Symptomatic Patients.
Seventy-one HD mutation carriers ranging from presymptomatic (n = 24) to advanced cases (n = 47) were enrolled in the study. The demographic characteristics of all groups, including HD subjects and healthy controls, are summarized in Table 1. All participants underwent neurologic examination, including motor, psychiatric, cognitive, and functional assessments, by the same senior neurologist with expertise in HD. Motor symptoms and behavioral and cognitive changes were assessed clinically with the unified Huntington's disease rating scale (UHDRS) (18) and Mini-Mental State Examination (MMSE) (19). The time of disease onset was defined as the time when motor clinical manifestations (extrapyramidal symptoms) first became noticeable (20). We considered nonspecific motor abnormalities or soft signs to be those that were insufficient alone to allow a definitive clinical diagnosis of HD (2,18) and did not affect the subject's independence and functional capacity. All clinical, genetic, and neuroimaging data on these patients were stored in a data bank. The disease stage was calculated according to the total functional capacity score (21). In subjects with a disease history of at least 5 y, the rate of functional decline and symptom progression was measured in loss of units per year using the total functional capacity scale (22,23). Most patients were taking benzodiazepines; some with advanced disease were receiving low doses of atypical neuroleptics (olanzapine, 2.5–10 mg, or risperidone, 1–3 mg), sometimes associated with benzodiazepines, lithium carbonate, or valproate.
Demographic and Clinical Characteristics of Subject Groups
Asymptomatic Mutation Carriers.
After predictive genetic testing, a group of 24 clinically unaffected subjects at risk for HD were informed of that risk. Using the published predictive models (20,22,24–26) we determined, on the basis of the CAG number and current age of each presymptomatic subject, the median number of years expected to elapse before symptoms of HD would develop (Fig. 1). Because neuropsychological changes may precede the onset of motor manifestations (2), we calculated the UHDRS cognitive and MMSE scores for each asymptomatic mutation carrier. All asymptomatic subjects had absence of, or minimal and nonspecific, clinical motor or behavioral manifestations (18), and their cognitive scores had remained almost unchanged over the previous 2 y. These subjects were not taking benzodiazepines or neuroleptics.
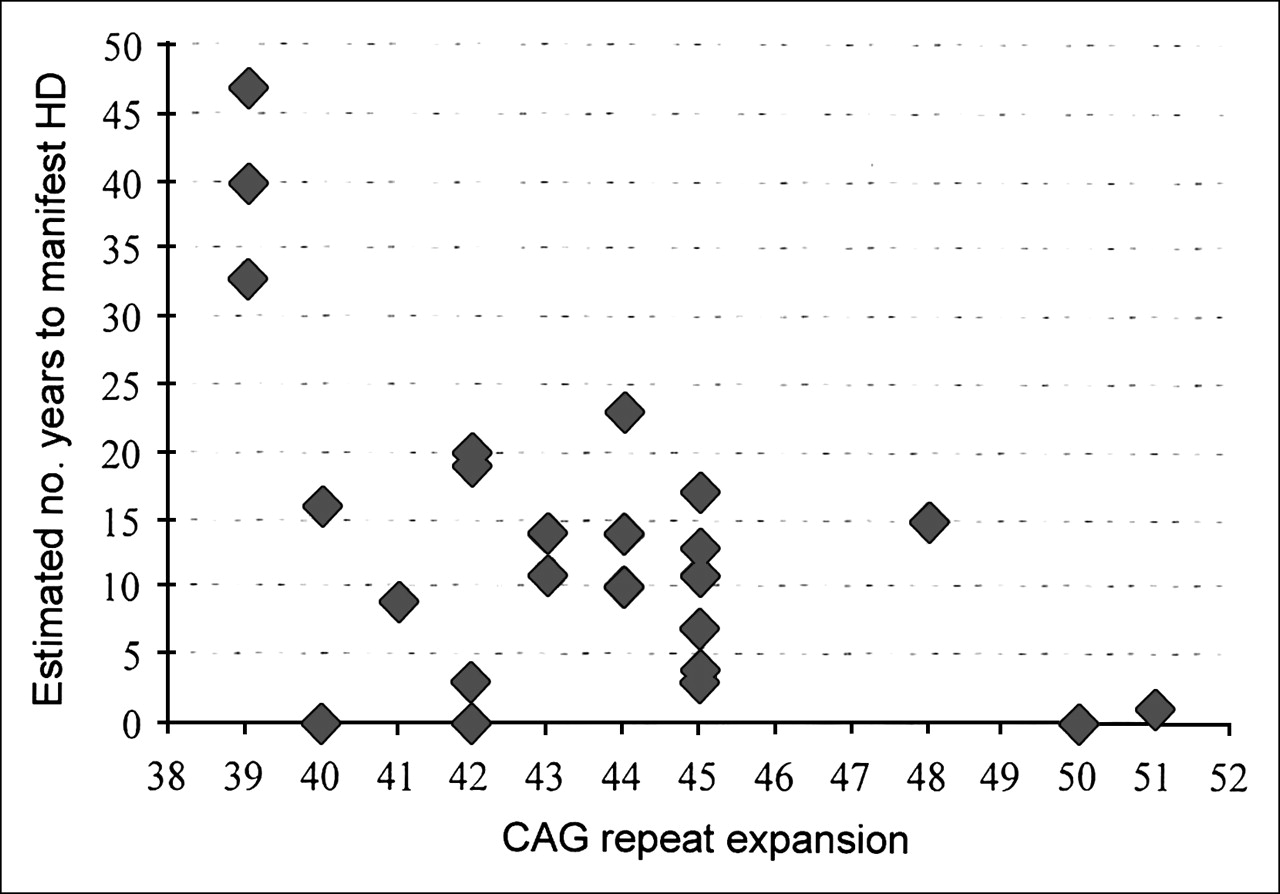
Graph of asymptomatic mutation carriers and estimated number of years until manifestation of HD symptoms. Age at onset was predicted by considering each subject's age and expected years until onset (y-axis) for a given CAG repeat expansion number (x-axis), according to published models (20,22,24–26). All subjects had an MMSE cognitive score—age and scholar corrected—within the reference range (18) and had minimal changes in UHDRS cognitive and MMSE scores after 2 y.
Genetic Analysis and Ethical Approval
For mutation analysis, genetic testing was done on blood lymphocyte DNA, and the CAG trinucleotide repeat length was assessed, after the subjects had given informed consent, as previously described (27). For predictive testing, a specific program, established according to international guidelines (28) and protocols (29,30) and approved by the local Bioethical Committee, is currently available for subjects at risk for HD. For genetic tests, predictive testing procedures, and neuroimaging studies, separate written informed consent was obtained from each subject. For subjects affected by severe intellectual decline, written informed consent was obtained from the caregiver.
Neuroimaging Procedures
Healthy Controls.
We used a neuroimaging archive that included data obtained by MRI and 18F-FDG PET from healthy controls (Table 1). MRI and 18F-FDG PET studies on healthy populations were performed using the same scanners and acquisition protocols as those used on the gene-positive subjects. We excluded from the study all subjects with suspected cardiovascular, metabolic, neurologic or psychiatric, or focal neurologic impairment.
HD Subjects.
We enrolled 96 gene-positive subjects for the study. Of these, 25 were excluded because of incompletely acquired data, leaving a population of 71 subjects available for study (Table 1). We excluded HD subjects with suspected focal neurologic impairment (as we did for the healthy controls).
HD Subjects' Follow-up.
A second MRI and 18F-FDG PET examination was performed for 10 asymptomatic mutation carriers and 21 patients at least 12 mo after the first neuroimaging assessment (Table 1). The subjects' longitudinal follow-up was part of a project assessing clinical (progression rate analysis) and neuroimaging (MRI and PET) progression of HD. The acquisition protocol included 2 interleaved sets of 15 slices covering the entire brain and obtained at a field strength of 1.5 T (Magnetom; Symphony), sampling the whole brain at 30 levels. Each of the 2 sets consisted of 2 conventional spin-echo sequences, generating 15 T1-weighted (TR/TE, 600/15) and proton density/T2-weighted (TR/TE1–TE2, 2,200/15–90) images (25-cm field of view, 256 × 256 acquisition matrix, 4-mm-thick axial slices).
MRI Segmentation Procedure and Statistical Analysis
Brain tissues were segmented with a fully automated postprocessing procedure (31). The experimental variability of this method, performed by obtaining multiple MR images from 5 healthy subjects, was smaller than 1.1% (32). For each MRI study, total intracranial volume and absolute volumes (in mL) of GM, WM, and cerebrospinal fluid (CSF), and the intracerebroventricular volume (ICV) and corresponding fractional volumes (fGM = GM/ICV, fWM = WM/ICV, and fCSF = CSF/ICV), were calculated to allow comparison of data from subjects with different head sizes. For comparison of healthy controls and subjects with the HD mutation, fGM, fWM, and fCSF were then corrected for age-related changes by adjusting both variables to the mean age of the subjects studied (41 y), according to the corresponding rates of yearly decline (0.14‰·y−1 and 0.015‰·y−1 for fGM and fWM, respectively) or of yearly increase (0.15‰·y−1 for fCSF), as measured in the database of healthy controls (31,32). Differences in fractional volumes between healthy controls and patients with HD were tested by the unpaired 2-tailed Student t test. The same differences were evaluated longitudinally in HD subjects by repeated MRI. The Spearman rank correlation coefficient was used to test for a possible relationship between clinical status (disease duration, CAG expansion, symptom progression rate) and fractional brain volumes. The linear dependence of fWM volume reduction on estimated age at onset was determined by a simple regression model. A significance level of P < 0.05 was chosen. Statistical analysis was performed with the SPSS statistical software package (SPSS Inc.).
PET Data Acquisition
All subjects underwent static 18F-FDG PET after receiving a 300-MBq injection of 18F-FDG while resting with eyes closed and ears plugged to reduce background noise. About 30 min after tracer injection, images were acquired with an ECAT EXACT 47 scanner (CTI/Siemens). After 5 min of transmission scanning with a 68Ge rod source, emission scanning was performed for 25 min in 2-dimensional mode. Emission scans were reconstructed using the backprojection method with a Shepp-Logan filter (cutoff frequency, 0.35), resulting in 47 slices with a 128 × 128 matrix (pixel size, 1.8 mm) and an interplane separation of 3.125 mm. The attenuation effects were corrected with measured transmission images.
PET Image Transformation and Statistical Analysis
PET images were converted into Analyze format using ImageJ software (http://rsb.info.nih.gov/ij/). Integrated analysis of PET studies and coregistered segmented MR images was performed with software that included a correction for partial-volume effects and a region-of-interest module (33). Partial-volume effects were corrected according to the methods of Muller-Gartner et al. (34,35). Regions of interest were defined in the normalized space of Talairach using the automated voxel-identification routine of the Talairach Daemon software (36).
The regions of interest encompassed the major GM structures (frontal, parietal, occipital, and temporal lobes; basal ganglia; and cerebellum). In order to apply this region-of-interest set to each subject's image dataset in the original space, we applied to the ROI set in the Montreal Neurological Institute space the parameters for normalization of the subject's PET image onto the PET template space of statistical parametric mapping. Data were normalized by mean global counts, and the HD subjects and healthy controls were compared using t statistics (P < 0.05), controlling for age and sex. The linear dependence of PET-normalized data on estimated age at onset was determined by a simple regression model.
RESULTS
Brain Fractional Volume Changes in Patients
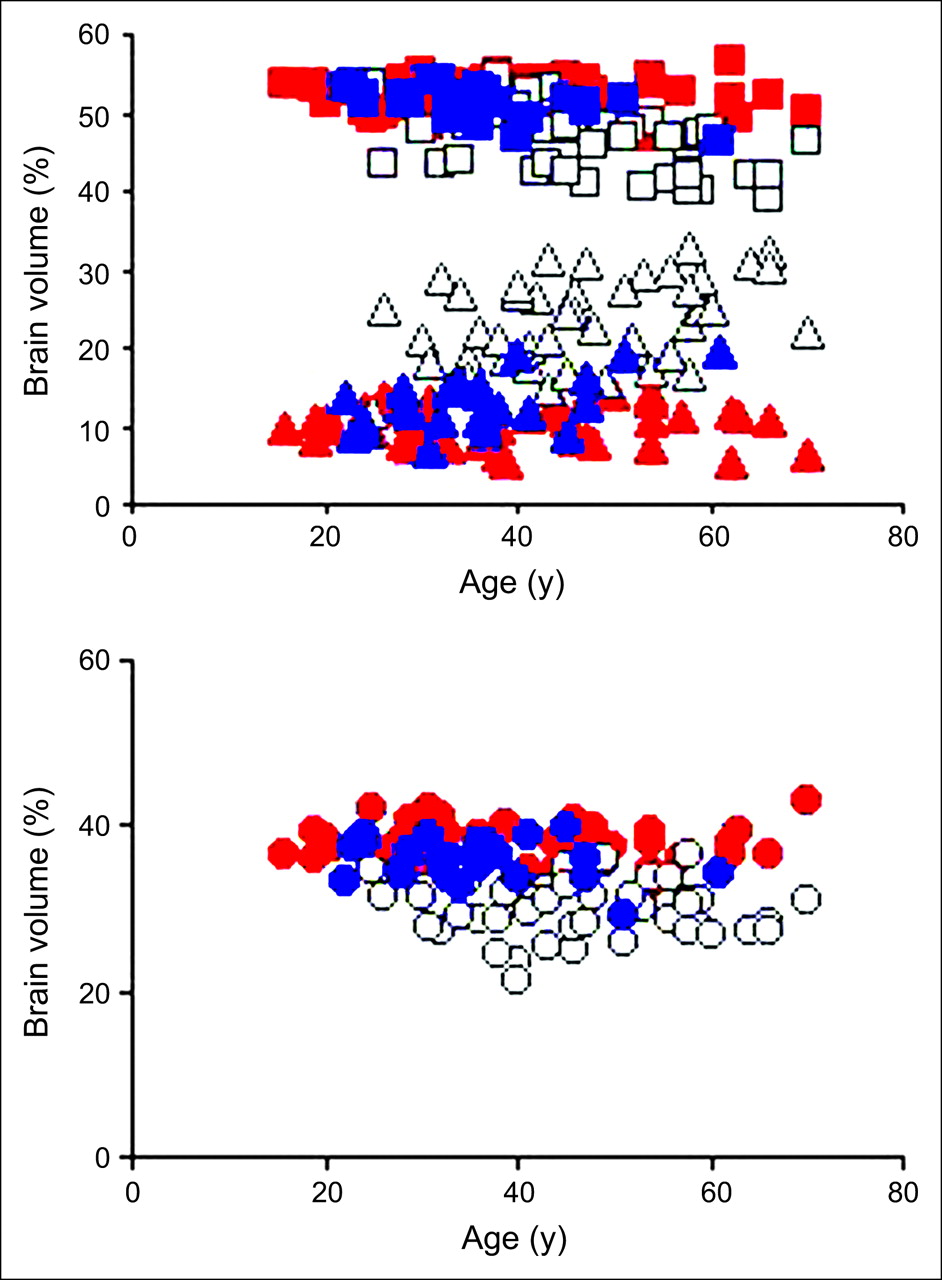
MR images showed a greater loss of fGM and fWM volumes in patients with HD than in healthy controls (Fig. 2). The plot showing the fractional variables (fGM, fWM, and fCSF) versus age in years showed a significantly larger age-related volume decrease in patients than in healthy controls (P < 0.0001 for fGM; P < 0.0001 for fWM) and a corresponding increase in fCSF volume (P < 0.0001, Figs. 3A and 3B).

Axial MR images from healthy subject (top row) and patient with symptomatic HD (bottom row). Note smaller fGM and fWM volumes in patient with HD than in healthy subject. Slices represent R1 and R2 relaxation rates and corresponding segmented images. Segmented images are coded gray for GM, white for WM, blue for CSF, green for putamen, and bright red for globus pallidus.

Scatter plot of fGM (□), fWM (○), and fCSF (▵) volumes vs. age in healthy subjects (red shapes), affected subjects (white shapes), and presymptomatic population (blue shapes). Affected subjects (n = 47) have significantly smaller fGM and fWM volumes than do healthy subjects (46.7 ± 4.0 mL vs. 52.4 ± 2.1 mL, P < 0.0001, and 30.0 ± 3.5 mL vs. 37.7 ± 2.2 mL, P < 0.0001, respectively), with corresponding increase in fCSF (23.1 ± 5.1 mL vs. 10.0 ± 2.4 mL, P < 0.0001). Presymptomatic subjects (n = 24) have significantly smaller fGM and fWM volumes than do healthy subjects (n = 54) (51.2 ± 2.2 mL vs. 52.4 ± 2.1 mL, P = 0.0506, and 35.3 ± 2.5 mL vs. 37.7 ± 2.2 mL, P < 0.0001, respectively), with corresponding increase in fCSF volume (13.5 ± 3.5 mL vs. 10.0 ± 2.4 mL, P < 0.0001).
Correlation of Volume Changes with Clinical and Genetic Markers
A significant negative correlation was found between fWM volume decrease and disease duration (P < 0.0001), and a corresponding increase was found in fCSF volume (P = 0.0013; Table 2). Changes in the fractional volumes of brain tissues correlated significantly with total functional capacity scores (P = 0.035 for fGM; P = 0.0014 for fWM; P < 0.0001 for fCSF; Table 2). A significant correlation was found between the fGM decrease and fCSF increase and symptom progression as measured by the yearly loss of total functional capacity units (P = 0.048 and 0.026, respectively; Table 2). No significant correlation was found between UHDRS motor and chorea scores and fractional volume changes or with the expanded repeat numbers.
Statistical Correlation Between Clinical Markers of Symptomatic HD Subjects and Fractional Brain Volumes
Brain Fractional Volume Changes in Asymptomatic Mutation Carriers
The group of 24 clinically unaffected presymptomatic subjects at risk for HD had significantly smaller fWM volumes and larger fCSF volumes than did healthy controls (P < 0.0001; Fig. 3). Compared with healthy controls, presymptomatic subjects showed a borderline-significant reduction of fGM volume (P = 0.0506). The fWM volume correlated inversely with the number of years between the subjects' age at the time of examination and the predicted age at disease onset (r2 = 0.39; P = 0.0011; Fig. 4), based on CAG repeat length. Conversely, the fGM volume showed no significant correlation with the predicted time until onset of symptoms in presymptomatic individuals.

Scatter plot of fractional WM volume vs. time to onset in asymptomatic HD mutation carriers. Positive linear correlation was found between WM volume loss and expected number of years until onset (r2 = 0.39; P = 0.0011).
MRI Follow-up of HD Subjects
Twenty-one symptomatic patients and 10 asymptomatic mutation carriers underwent a second MRI assessment (Table 1). The follow-up MRI scans of the symptomatic population showed no significant change in fractional volumes after a mean interval of 18.4 mo. The follow-up scans of presymptomatic subjects showed a significant decrease in fWM volumes over time after a mean interval of 16.2 mo (paired t test, P = 0.002). The same subjects had no significant loss of fGM.
18F-FDG PET
HD patients had lower 18F-FDG uptake in the frontal and temporal lobes and the striatum bilaterally than did healthy controls (Table 3). Patients in the middle-to-advanced stages of HD showed no significant correlation between 18F-FDG uptake and the clinical markers of disease and progression or between 18F-FDG uptake and CAG repeat number. Subjects in the preclinical stage of HD showed lower striatal 18F-FDG uptake than did healthy controls (P < 0.05 for caudate; P < 0.05 for putamen, Table 3). Reduced 18F-FDG uptake was detected in frontal and temporal cortex bilaterally (Table 3). The regional decrease in striatal 18F-FDG uptake correlated inversely with the number of years between the subjects' age at the time of examination and the predicted age at onset based on the CAG repeat number (r2 = 0.34 and P = 0.003 for caudate, Fig. 5A; r2 = 0.44 and P = 0.0001 for putamen, Fig. 5B).
Mean Percentage Changes in 18F-FDG Uptake in Asymptomatic and Symptomatic HD Subjects
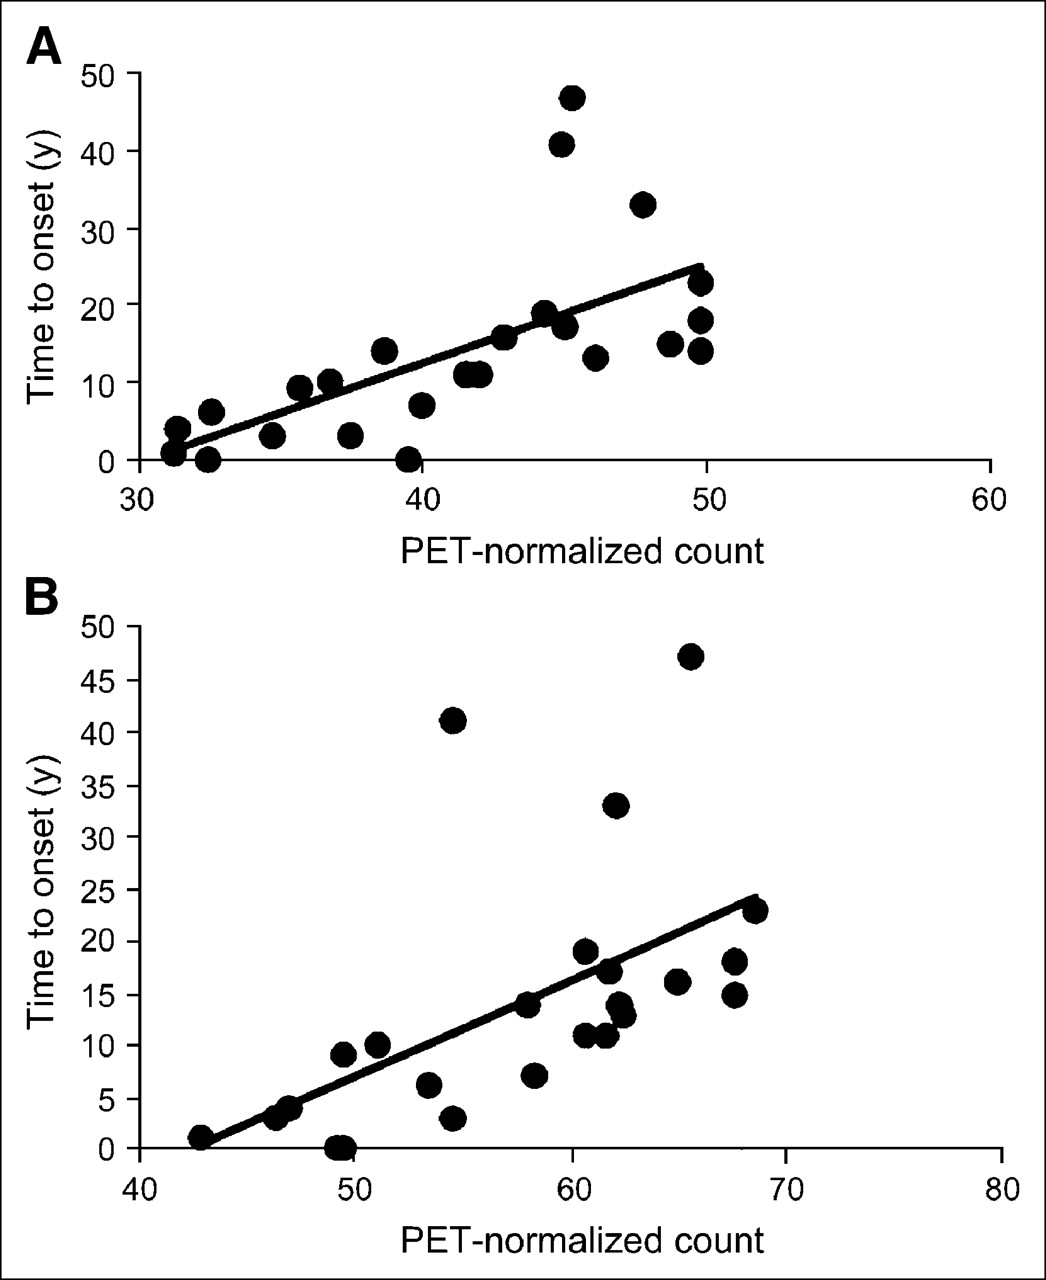
Graph showing positive linear correlation between decline in 18F-FDG uptake in caudate (A; r2 = 0.34, P = 0.003) or putamen (B; r2 = 0.44, P = 0.0001) and estimated number of years until HD onset in presymptomatic gene-positive subjects. Positive linear correlation was found between decreased striatal 18F-FDG uptake and expected years until onset.
PET Follow-up of HD Subjects
Twenty-one symptomatic patients and 10 asymptomatic mutation carriers underwent a second PET assessment (Table 1). The follow-up PET scans of HD patients showed a statistically significant decrease in 18F-FDG uptake in cortical brain areas (P = 0.0033 for frontal lobe; P = 0.017 for temporal lobe; P = 0.0031 for parietal lobe) and in striatum (P = 0.036 for caudate; P = 0.027 for putamen) (Fig. 6A). The follow-up PET scans of subjects in the preclinical stage of HD also showed a decrease in 18F-FDG uptake in cortical brain areas (P = 0.031 for frontal lobe; P = 0.027 for parietal lobe) and in striatum (P = 0.037 for caudate; P = 0.022 for putamen) (Fig. 6B).
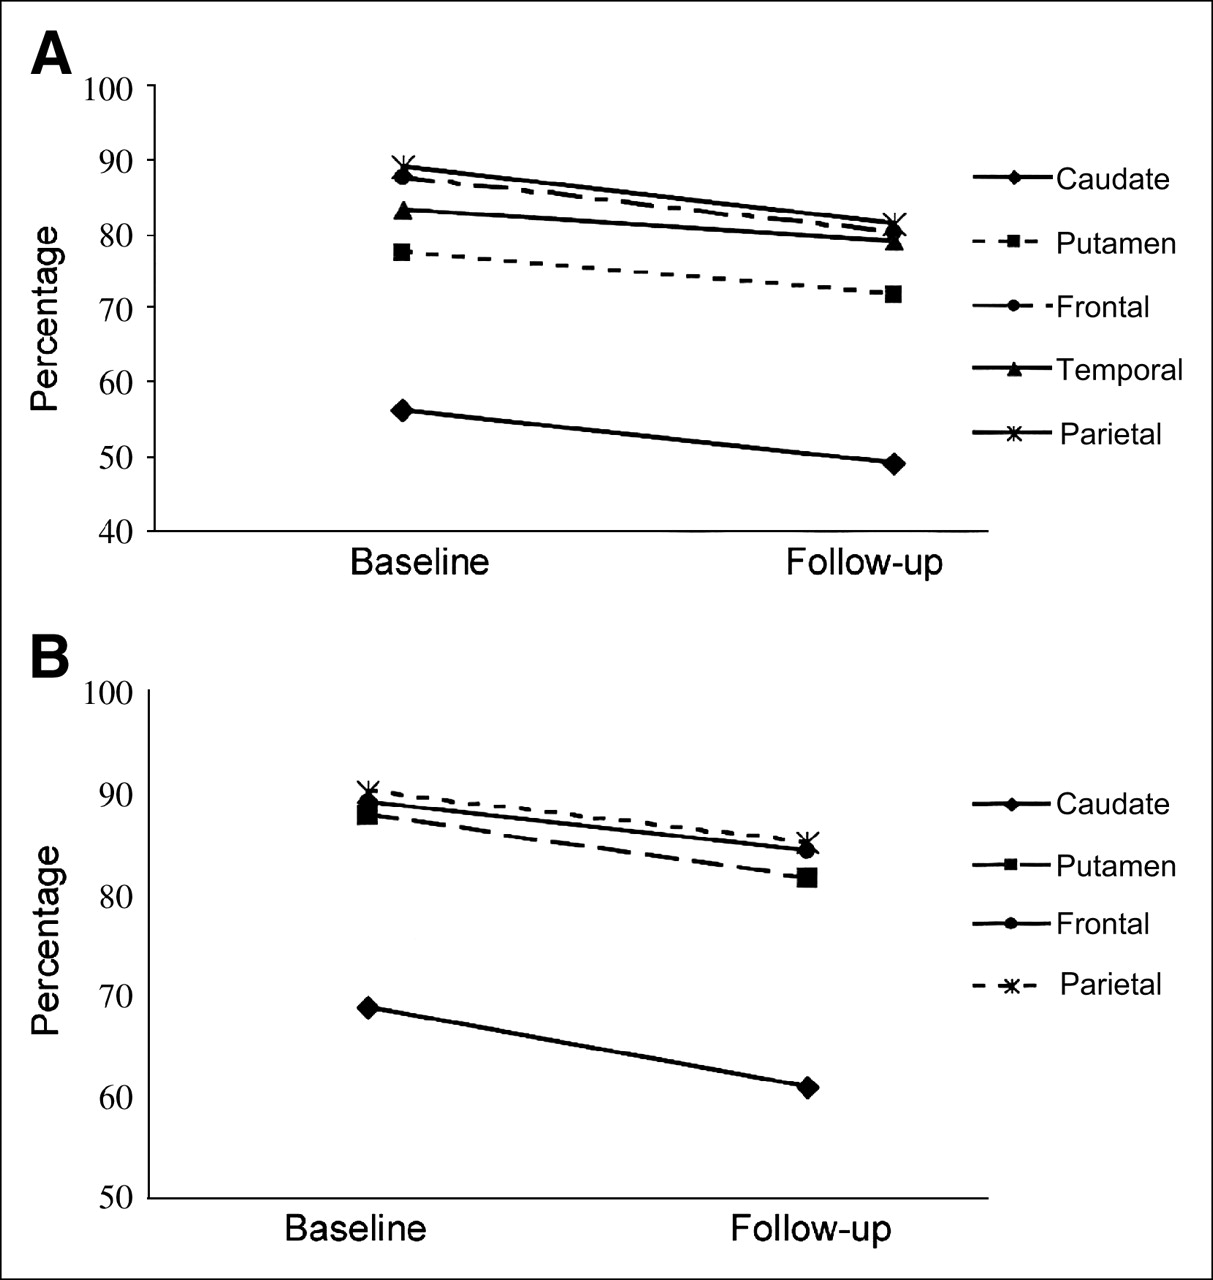
Graph showing longitudinal changes in mean 18F-FDG uptake on follow-up of symptomatic (A; n = 21) and preclinical (B; n = 10) HD populations. X-axes show baseline and follow-up evaluation times, and y-axes show mean percentage of 18F-FDG uptake in each brain region. SEs range from 0.96% to 2.65%. Symptomatic population shows longitudinal change from baseline scan in frontal (−8.3%, P = 0.003), parietal (−8.4%, P = 0.003), and temporal (−4.6%, P = 0.017) cortices and in caudate (−6.9%, P = 0.036) and putamen (−12.4%, P = 0.027). Asymptomatic mutation carriers show longitudinal change from baseline scan in frontal (−5.4%, P = 0.031) and parietal (−5.5%, P = 0.027) cortices and in caudate (−7.2%, P = 0.037) and putamen (−11.5%, P = 0.022).
DISCUSSION
In this study on a cohort of HD subjects encompassing the complete range of disability, we found neuroimaging evidence of decreased brain WM volume beginning many years before the onset of clinical HD. Our data support the hypothesis that loss of WM volume starts early in life, even before evidence of GM atrophy (Fig. 3). The significant inverse correlation between the WM volumetric loss and the estimated time to onset of clinical HD in unaffected presymptomatic subjects at risk for HD is an important new finding possibly providing a potential marker for the severity of presymptomatic neuropathologic events (Fig. 4). This possibility is supported by the reduction in WM volume over ∼16 mo in presymptomatic individuals, suggesting that this marker may be useful for monitoring early changes in brain structure in the context of future preventive therapeutic trials (in presymptomatic gene-positive individuals). At present, there are no other biomarkers for monitoring the progression of preclinical disease in HD.
Our data show brain glucose hypometabolism in the cortex and more severe deficits in the basal ganglia (Table 3; Figs. 5 and 6). These metabolic dysfunctions are early features, consistent with early structural brain changes that precede the clinical onset of HD symptoms by many years (Figs. 5 and 6).
We observed a worsening of cortical dysfunction over time in the presymptomatic subjects (Fig. 6B) (as well as in the subjects with manifest HD, Fig. 6A) consistent with recent reports on early functional and structural impairment of the brain cortex (8,9,15). These early metabolic changes and the WM changes seen on MRI may arise not only from cell death but also from neuronal dysfunction due to altered neuronal energetic metabolism and intradendritic Huntington's-protein aggregates (37–39). Neuronal dysfunction in early HD is an important possibility to consider because it has a precedent in a conditional mouse model of HD in which signs of mutant transgene expression improved after expression of the transgene had been switched off (40). Yet in a degenerative disease leading to cell death, even mild neuronal loss, possibly below the detection threshold of imaging, may perturb the neuronal circuitry and thus alter glucose metabolism.
In agreement with a previous report (41), we found that a decline in global brain volume, expressed as an increase in fCSF, was the best determinant of the rate of symptom progression (P < 0.026, Table 2), with the advanced clinical stages being associated with the greatest fCSF increases (P < 0.0001, Table 2). This model is consistent with recent findings of early, widespread brain atrophy in HD subjects with the homozygous expansion mutation, who appear to experience more rapid and severe disease progression (only after overt onset of signs and symptoms) than do subjects with the heterozygous expansion mutation (matched for CAG length) (22).
In a study of this type, it is difficult to incorporate a design that excludes the potential influence of drugs on brain metabolism in patients with advanced disease. We were not surprised to observe no significant structural modifications of the brain in our symptomatic subjects over the longitudinal follow-up period, given its shortness—approximately 18 mo.
In conclusion, the ability to assess therapeutic interventions presymptomatically would be a major advance in the management of HD, opening the way for therapy to delay the onset of symptoms. In HD and related dominant polyglutamine diseases, this strategy is theoretically possible because a simple genetic test can identify mutation carriers long before disease onset and because most patients have a family history of HD and thus can choose to undergo that genetic test (1). Our observation of WM changes preceding GM changes and the correlation between WM atrophy and time to onset in presymptomatic subjects suggest that imaging of early WM changes and of early brain hypometabolism, together with documentation of progressive preclinical striatal atrophy (5), may be valuable for assessing neuroprotective therapeutic strategies (particularly in presymptomatic individuals).
Acknowledgments
We thank Carmen Rao for image processing, Gennaro Esposito for assistance with patient care, Stefano Di Donato for fruitful comments, and the European Huntington's Disease Network and all patients and their families (Associazione Italiana Corea di Huntington-Neuromed) for kind cooperation and support. This study was supported by Siena Biotech, by the Wellcome Trust (fellowship in clinical science), and by the Italian Ministry of Health (Ricerca Finalizzata 2001 for the setting up of a tissue and data bank, Ricerca Finalizzata 2003 for an MRI and PET scanning project, and Ricerca Finalizzata D. Lgs. 502/92 and D. Lgs. 229/99 for a project on Alzheimer's disease).
References
- Received for publication August 2, 2005.
- Accepted for publication November 7, 2005.


Jump to section
Related Articles
Cited By...
- Progressively reduced cerebral oxygen metabolism and elevated plasma NfL levels in the zQ175DN mouse model of Huntingtons disease
- Longitudinal study of neurochemical, volumetric and behavioral changes in Q140 & BACHD mouse models of Huntingtons disease
- Differences in white matter detected by ex vivo 9.4T MRI are associated with axonal changes in the R6/1 model of Huntingtons Disease
- NAD homeostasis maintained by NMNAT2 supports vesicular glycolysis and fuels fast axonal transport in distal axons of cortical glutamatergic neurons in mice
- Mutation-related apparent myelin, not axon density, drives white matter differences in premanifest Huntingtons disease: Evidence from in vivo ultra-strong gradient MRI
- HTT silencing delays onset and slows progression of Huntingtons disease like phenotype: Monitoring with a novel neurovascular biomarker
- Bioenergetics in fibroblasts of patients with Huntington disease are associated with age at onset
- Brain metabolism in health, aging, and neurodegeneration
- Potential biomarkers to follow the progression and treatment response of Huntingtons disease
- Fetal striatal grafting slows motor and cognitive decline of Huntington's disease
- One-year safety and tolerability profile of pridopidine in patients with Huntington disease
- Early Alterations of Brain Cellular Energy Homeostasis in Huntington Disease Models
- Longitudinal change in regional brain volumes in prodromal Huntington disease
- Regional Distribution and Clinical Correlates of White Matter Structural Damage in Huntington Disease: A Tract-Based Spatial Statistics Study
- The progression of regional atrophy in premanifest and early Huntington's disease: a longitudinal voxel-based morphometry study
- Onset and Progression of Pathologic Atrophy in Huntington Disease: A Longitudinal MR Imaging Study
- Decreased Diffusivity in the Caudate Nucleus of Presymptomatic Huntington Disease Gene Carriers: Which Explanation?
- Impaired Ganglioside Metabolism in Huntington's Disease and Neuroprotective Role of GM1
- Functional connectivity of the prefrontal cortex in Huntington's disease