


Abstract
The σ2-receptor has been shown to be upregulated in proliferating tumors cells. The purpose of this study was to compare 3′-deoxy-3′-18F-fluorothymidine (18F-FLT) and 2 new 76Br-radiolabeled compounds that have a high affinity and selectivity for the σ2-receptor. These are 5-bromo-N-(4-(3,4-dihydro-6,7-dimethoxyisoquinolin-2(1H)-yl)butyl)-2,3-dimethoxybenzamide (compound (1)) and 5-bromo-N-(2-(3,4-dihydro-6,7-dimethoxyisoquinolin-2(1H)-yl)ethyl)-2-methoxybenzamide (compound (2)). Methods: Two σ2-receptor−binding ligands were prepared, from the corresponding tributylstannyl precursors using standard electrophilic chemistry, 76Br-compound (1) (76Br-1) and 76Br-compound (2) (76Br-2). 18F-FLT, 76Br-1, and 76Br-2 were compared using allograft tumors of the EMT-6 cell line (mouse mammary adenocarcinoma) in biodistribution studies at 5 min, 0.5, 1, and 2 h. Imaging of 76Br-1 and 18F-FLT was also performed at 2 and 1 h, respectively. Results: 76Br-1 and 76Br-2 were synthesized with yields between 50% and 70% with high specific activity. Both compounds showed uptake into the tumor with tumor-to-normal tissue ratios of 76Br-1 being greater than both 76Br-2 and 18F-FLT. Except for the liver and kidney, all ratios were greater than 1 and uptake into the tumor was shown with microPET imaging for 76Br-1. Conclusion: We were able to synthesize two 76Br-radiolabeled compounds with a high yield and specific activity that target the σ2 receptor with high affinity and selectivity. The studies presented show that both of the flexible benzamide compounds can identify EMT-6 breast tumors in vivo. 76Br-1 also has higher tumor-to-normal tissue ratios when compared with 76Br-2 and 18F-FLT. The high affinity and low nonspecific binding of 76Br-1 indicates that it can be a potential PET radiotracer for imaging solid tumors.
The σ-receptor was first proposed as a subtype of the opioid receptor in the late 1970s (1). Since that time, the classification of the σ-receptor has been shown to be a separate class of receptors. Two subtypes have been identified, σ1 and σ2 (2,3). The molecular function of these receptors has yet to be fully elucidated and the natural ligand(s) has not been identified (4,5). The σ1-receptor has been extensively studied in the central nervous system and neuroactive steroids have been suggested to be an endogenous ligand that binds to this receptor (4). The function of the σ2-receptor is currently not known but it has been linked to the regulation of cell proliferation and cell viability (4).
Although σ-receptors were initially identified in the nervous system, these receptors are found in high density in other tissues, such as the endocrine, immune, and reproductive systems (6,7). High densities were also found in the liver and kidneys (8). Of special interest to the present work was the identification of high densities of σ-receptors in tumor tissues and cell lines (9,10). Studies with a mouse mammary adenocarcinoma cell line showed that the σ2-receptor could be a possible biomarker of tumor proliferation (11,12). Cell lines were examined in vitro for expression levels of σ2-receptors when the cells were in quiescent and proliferative states. It was found that the proliferative state had a σ2-receptor concentration 8- to 10-fold higher than when in quiescence (11).
In vivo solid tumors were subsequently studied and a good correlation between the in vitro and in vivo data was found (12). This work therefore suggests that the σ2-receptor may be a good biomarker for assessing the proliferative status of solid tumors noninvasively by using high-affinity σ2-ligands in conjunction with either PET or SPECT. A number of tumor imaging studies have targeted the σ-receptor. The high-affinity ligands for the σ-receptor used in these studies have been either nonselective for the 2 subtypes or selective for the σ1-receptor (13–16).
As it was shown that the σ2-receptor is upregulated in proliferating tumor cells, a high- affinity and selective σ2-radioligand has the potential for in vivo imaging of the proliferative status of solid tumors. We recently reported a series of conformationally flexible benzamide analogs that were found to have a high affinity and selectivity for the σ2-receptor (17). Two ligands, 5-bromo-N-(4-(3,4-dihydro-6,7-dimethoxyisoquinolin-2(1H)-yl)butyl)-2,3-dimethoxybenzamide (compound (1)) and 5-bromo-N-(2-(3,4-dihydro-6,7-dimethoxyisoquinolin-2(1H)-yl)ethyl)-2-methoxybenzamide (compound (2)) (Fig. 1), were found to have greater affinities and selectivities for the σ2-receptor than any ligand reported to date.
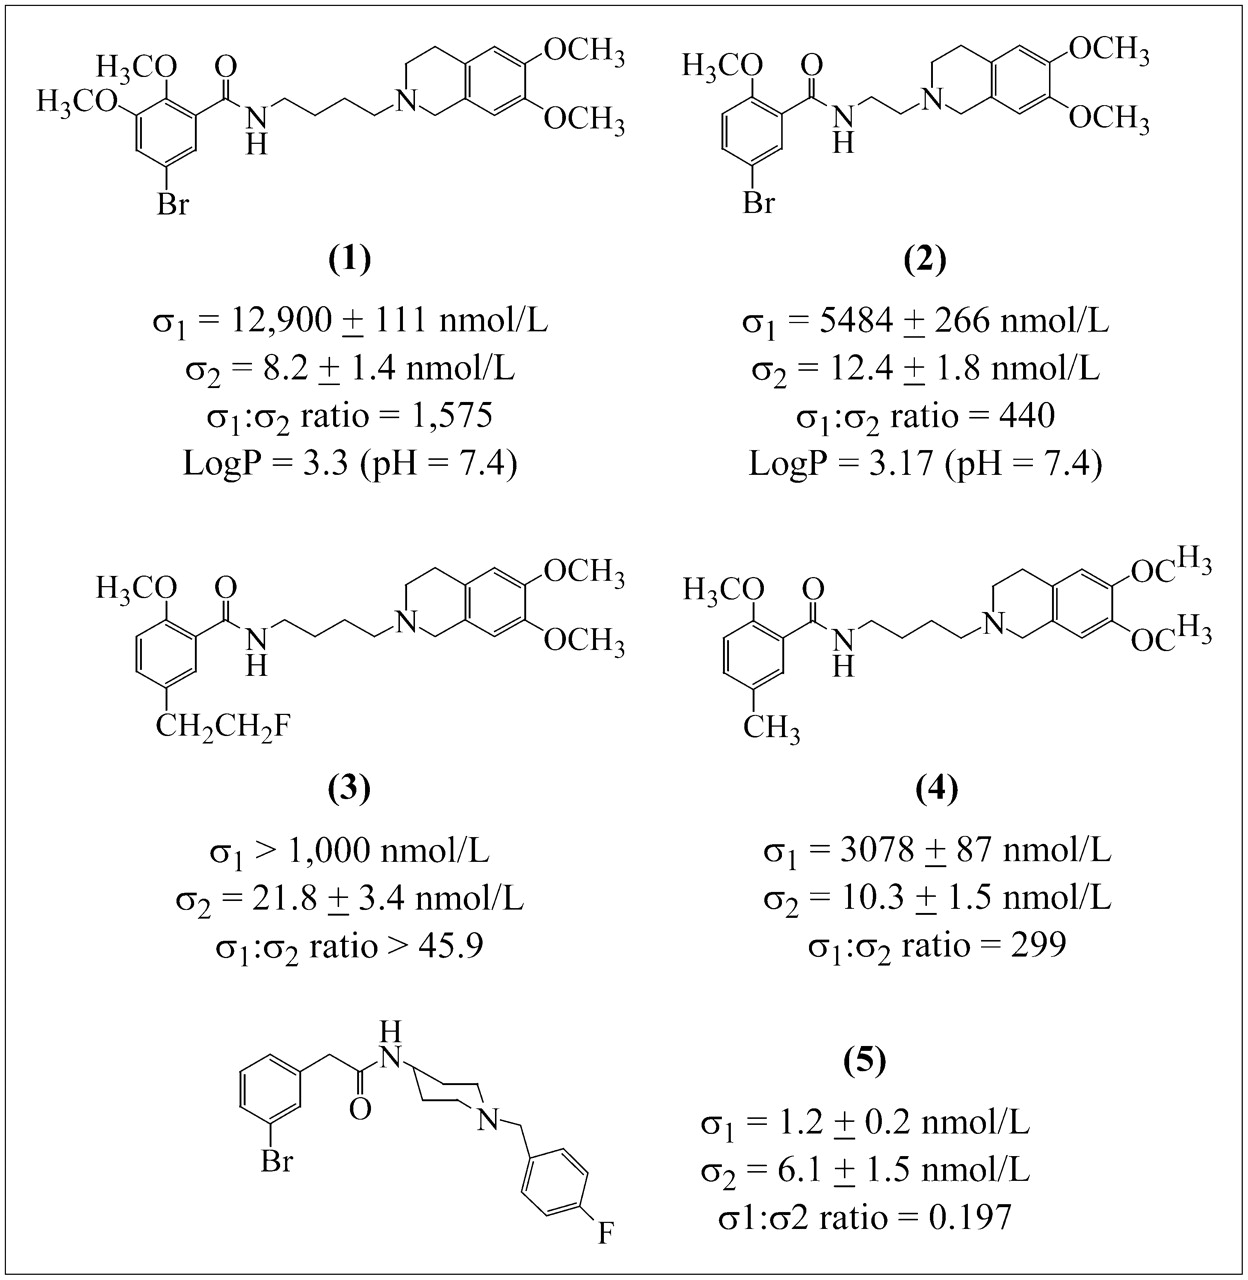
Compounds used in this work. Compounds (1) and (2) are benzamide analogs that target σ2-receptor with high affinity and high selectivity over σ1-receptor. Both were radiolabeled with 76Br for biodistribution and imaging studies. Compound (1) is 5-bromo-N-(4-(3,4-dihydro-6,7-dimethoxyisoquinolin-2(1H)-yl)butyl)-2,3-dimethoxybenzamide and compound (2) is 5-bromo-N-(2-(3,4-dihydro-6,7-dimethoxyi-soquinolin-2(1H)-yl)ethyl)-2-methoxybenzamide. Compound (3) is a fluorinated analog that was prepared for possible labeling with 18F. Compound (4) was used for Scatchard analysis to determine the nonspecific binding of 76Br-1. Compound (5) was used as a nonselective σ1/σ2 compound for blocking σ2-receptor in animal receptor−blocking studies.
In addition to exhibiting a high binding affinity for σ2-receptors, these compounds also contain a bromine atom in the C5 position of the benzamide ring. Because the Washington University Cyclotron Facility produces 76Br on a routine basis (18,19), it is possible to prepare 76Br-labeled versions of compounds (1) and (2) and evaluate their potential for imaging solid tumors.
Although the availability of 76Br is currently limited, this could change if production yields increase and improvements are made in the automation and processing of the solid targets used in the production of this radionuclide. For example, the Washington University Cyclotron Facility currently produces 76Br for shipping to research facilities around the country and has done so for several years. A key step in the expansion of the use of 76Br in the clinical setting, thereby increasing the demand for this radionuclide throughout the PET community, is the development of PET radiopharmaceuticals that can be labeled only with 76Br.
The goal of the current study was to investigate the properties of these two 76Br-labeled ligands for the in vivo imaging of solid tumors using the mouse mammary adenocarcinoma cell line EMT-6 cells. Our previous studies have demonstrated that this cell line has a high density of σ2-receptors and is suitable for evaluating new σ2-receptor−based imaging agents (20,21).
A secondary goal of the current study was to compare the 76Br-labeled σ2-receptor imaging approach with that of 18F-FLT, a nucleoside-based radiotracer that has been used in imaging tumor proliferation (22,23). 3′-Deoxy-3′-18F-fluorothymidine (18F-FLT) accumulates in proliferating tumor cells via phosphorylation by thymidine kinase-1 (TK-1), which is expressed in the S phase of the cell cycle. Although the accumulation of the 76Br-labeled radiotracers in tumor cells uses a different mechanism from that of 18F-FLT (i.e., labeling σ2-receptors that are upregulated in proliferating tumor cells vs. phosphorylation by TK-1), it is important to compare the ability of these new compounds to image tumors with the current standard of the field for imaging proliferation, 18F-FLT. Studies aimed at determining which imaging method correlates with “gold standard” measures of proliferation (e.g., bromodeoxyuridine and Ki-67 labeling) are beyond the scope of this study.
MATERIALS AND METHODS
All chemicals were obtained from Sigma-Aldrich and used without further purification unless otherwise stated. 18F-FLT was produced using a modified version of Machulla et al. (24). The nonradioactive standard for compounds (1), (2), and (4) was synthesized using the previously published method (17). Compound (5), which was used for animal blocking experiments, was synthesized according to a previously published method (14). Properties of compounds were taken from these publications, except the log P of compound (1) and compound (2), which was determined using the program ACD/log D, version 7.0 (Advanced Chemistry Development, Inc.). 1H-NMR spectra were recorded at 300 MHz on a Varian Mercury-VX spectrometer. All chemical shift values are reported in parts per million (δ).
Radiolabeled σ2-Receptor Ligand: Precursor Synthesis
Preparation of 5-Iodo-N-(4-(3,4-Dihydro-6,7-Dimethoxyisoquinolin-2(1H)-yl)Butyl)-2,3-Dimethoxybenzamide (Iodo Analog of Compound (1)).
The following procedure was used for preparation of the iodinated analog of compound (1), the key intermediate in the synthesis of the tributylstannyl precursor. A solution of 5-iodo-2,3-dimethoxybenzoic acid (25) (308.2 mg; 1.0 mmol), 4-(6,7-dimethoxy-3,4-dihydro-1H-isoquinolin-2-yl)butylamine (267.0 mg; 1.01 mmol), bis(2-oxo-3-oxazolidinyl)phosphinic chloride (309 mg; 1.21 mmol), and triethylamine (218 mg; 2.2 mmol) in dichloromethane (15 mL) was stirred at ambient temperature overnight. Stirring was continued until thin-layer chromatography (TLC) (20% methanol/80% ether) showed that the reaction was completed. Dichloromethane (50 mL) was added to the reaction solution and the mixture was washed with a saturated Na2CO3 aqueous solution (2 × 50 mL), the organic layer was dried with anhydrous sodium sulfate, and the solution was filtered and concentrated under reduced pressure. The residue was purified by silica gel column chromatography (20% methanol/80% of ether) to give the final product as oil (330 mg, 60% yield). 1H-NMR (300 MHz, CDCl3): δ 1.50–1.65 (m, 4H), 2.40–2.60 (m, 2H), 2.60–2.80 (m, 4H), 3.35–3.40 (m, 2H), 3.50–3.62 (s, 2H), 3.75–3.79 (m, 12H), 6.41 (s, 1H), 6.49 (s, 1H), 7.52 (d, 1H), 7.86 (d, 1H), 7.98 (s, 1H).
Preparation of N-(2-(3,4-Dihydro-6,7-Dimethoxy-Isoquinolin-2(1H)-yl)-Ethyl)-2-Methoxy-5-(Tributylstannyl)Benzamide.
Nitrogen gas was bubbled through a solution of 5-bromo-N-(2-(3,4-dihydro-6,7-dimethoxy-isoquinolin-2(1H)-yl)ethyl)-2-methoxybenzamide (200 mg; 0.445 mmol) in anhydrous toluene (15 mL) for 5 min. The reaction mixture was heated at 120°C (oil bath) and tetrakis(triphenyl phosphine)palladium(0) [(Ph3P)4Pd(0)] (37 mg; 0.05 eq.) and bis(tributyltin) [Sn(C4H9)3]2 (458.3 mg; 400 μL; 0.79 mmol) were added to the solution and the reaction mixture was stirred overnight at 110°C–120°C (oil bath). The reaction was continued until TLC (10% methanol/ethyl acetate) demonstrated that the starting material was consumed. Ethyl acetate (50 mL) was added into the flask, and the reaction solution was washed with saline (3 × 30 mL). The organic layer was dried over anhydrous sodium sulfate and volatiles were removed under reduced pressure. The crude product was purified on a radius flow chromatron (Harrison Research, Inc.) using 10% methanol/90% ethyl acetate as the solvent. The yield of the tributylstannyl precursor for 76Br-2 was 34%. The tributylstannyl precursor of 76Br-1 was obtained in an overall yield of 44.5% using a similar procedure.
N-(4-(3,4-Dihydro-6,7-Dimethoxyisoquinolin-2(1H)-yl)Butyl)-2,3-Dimethoxy-5-(Tributylstannyl)Benzamide.
1H-NMR (300 MHz, CDCl3): δ 0.78–1.80 (m, 31H), 2.50–2.70 (m, 4H), 2.79 (s, 2H), 3.42–3.44 (m, 2H), 3.60–3.62 (m, 2H), 3.76–3.83 (m, 12H), 6.45 (s, 1H), 6.51 (s, 1H), 7.02 (s, 1H), 7.66 (d, 1H), 7.95 (s, 1H).
N-(2-(3,4-Dihydro-6,7-Dimethoxyisoquinolin-2(1H)-yl)Ethyl)-2-Methoxy-5-(Tributylstannyl)Benzamide.
1H-NMR (300 MHz, CDCl3): δ 0.80–1.60 (m, 27H), 2.01–2.84 (m, 6H), 3.63–3.66 (m, 4H), 3.67 (s, 3H), 3.83 (s, 3H), 3.85 (s, 3H), 6.53 (s, 1H), 6.60 (s, 1H), 6,85–6.89 (d, 1H), 7.45–7.48 (m, 1H), 8.26 (s, 1H), 8.51 (s, 1H).
Radiolabeling with 76Br
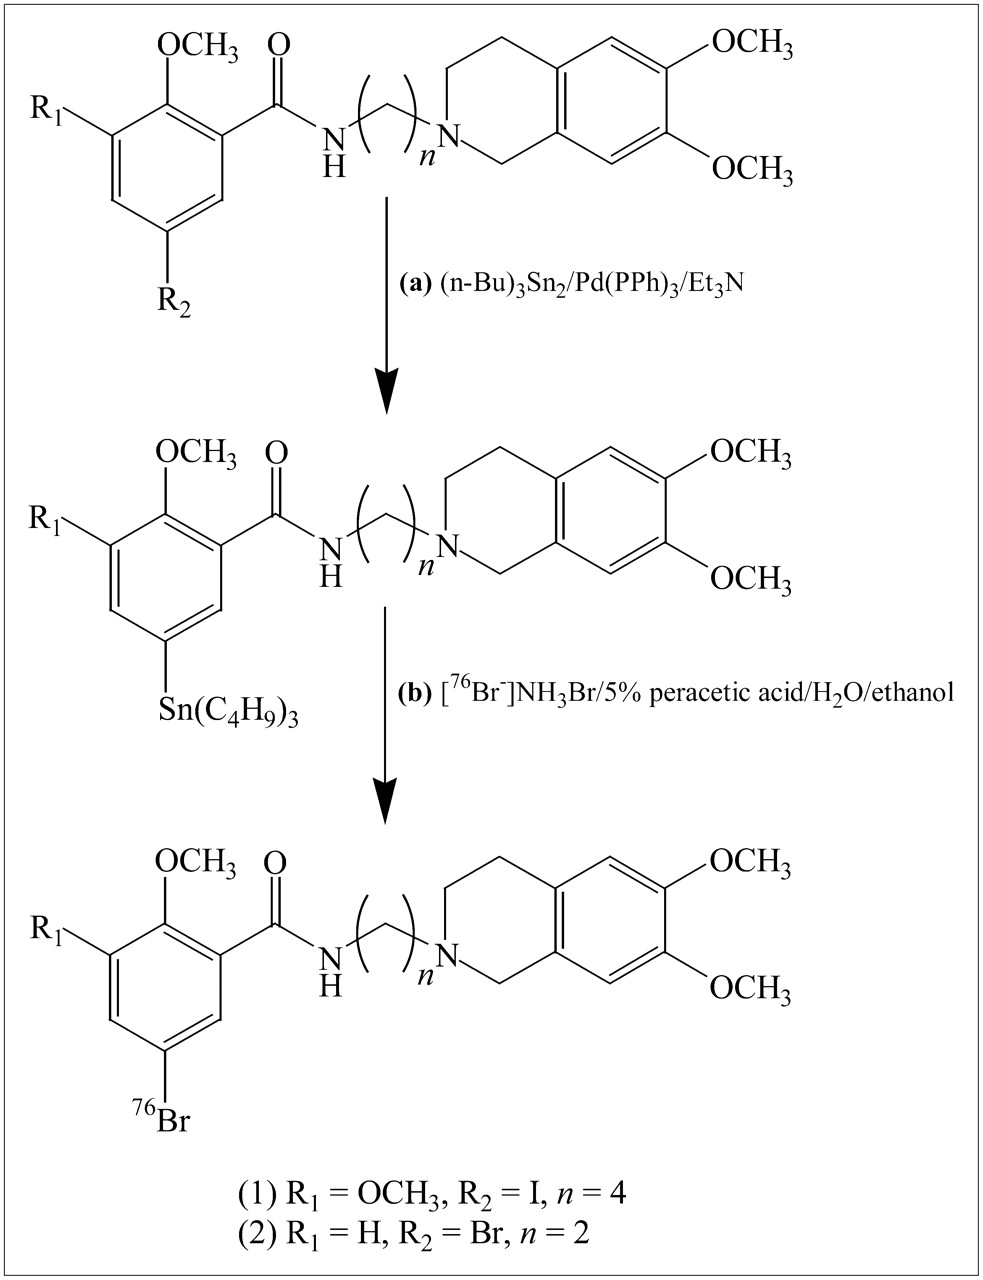
Compounds (1) and (2) were labeled with 76Br via an electrophilic destannylation reaction using the described precursors (Fig. 2). 76Br was produced at the Washington University Cyclotron Facility using an automated target system (19). 76Br was recovered via a dry distillation method that was a modified apparatus based on that of Tolmachev et al. (26). The radionuclide was obtained in 0.6 mol/L NH4OH (∼222 MBq [∼6 mCi] in 200 μL). This solution was filtered through a C-18 Sep-Pak (Maxi-Clean C18; Alltech Inc.) with quantitative recovery of the activity and blown down to dryness. The radioactivity was redissolved in Milli-Q water (Millipore Corp.) (200 μL). Twenty micrograms (in 10 μL ethanol) of the tributylstannyl precursor were added to the activity, followed by 30 μL of 32 wt % peracetic acid in dilute acetic acid. The reaction was performed at room temperature.

Generalized synthesis of 76Br-radiolabeled σ2-ligands (1) and (2).
The reaction mixture was monitored by TLC that was performed on silica gel plates with 25% methanol in dichloromethane as the solvent for compound (1) and 20% ethyl acetate in methanol for compound (2). The Rf values were 0, 0.80, and 0.63 for bromide, compound (1), and compound (2). The tributylstannyl precursors for compound (1) and compound (2) were 0.98 and 0.77.
Purification was performed with high-performance liquid chromatography (HPLC) on a reverse-phase C-18 preparatory column using 14% tetrahydrofuran and 86% 0.1 mol/L formate buffer as the eluting solvent (pH 4.5). The solvent was evaporated under vacuum and heat. The activity was redissolved in saline for in vivo and in vitro studies.
Quality control was performed on 76Br-1 and 76Br-2 using the same HPLC solvent conditions to determine the specific activity of the radiotracers on a C-18 analytic column. Because of the weak ultraviolet absorbance of 76Br-1, only a lower limit on the specific activity could be established with the standard quality control method. In a separate experiment a more accurate measurement of the specific activity was performed on a liquid chromatography/mass spectrometry (LC/MS) system using the same solvent elution as presented.
Biodistribution and microPET Studies
All animal experiments were conducted in compliance with the Guidelines for the Care and Use of Research Animals established by Washington University's Animal Studies Committee. Mature female BALB/c mice (∼2-mo old and 17–22 g; Charles River Laboratories) were implanted subcutaneously in the nape of the neck with EMT-6 mouse mammary adenocarcinoma cells (5 × 10⁵ cells in 100 μL growth media for experiments with 76Br-1 and 76Br-2 and 1 × 10⁶ cells for experiments with 18F-FLT) 7–10 d before the study date. Average tumor burden on the day of imaging was ∼0.2 cm3. Radioligands were prepared on the day of the animal studies.
Biodistribution studies with 76Br-1 and 76Br-2 were performed with 222–296 kBq (6–8 μCi) of activity in 150–170 μL of saline (<3 ng of the compounds) and 592 kBq (16 μCi) of activity was used for 18F-FLT in 180 μL of saline. The compounds were administered via tail vein injection. The animals were sacrificed at 5 min, 0.5, 1, 2, and 4 h for 76Br-1 and 76Br-2. The times for 18F-FLT were 0.5, 1, and 2 h. A blocking study was performed to verify the receptor binding of 76Br-1 using compound (5) (22 μg coinjected with 76Br-1 in 200 μL saline) as a blocking agent (14). Compound (5) has a high affinity for both σ1- and σ2-receptors and is routinely used in our laboratory for σ-receptor–blocking studies (14,20,27). Animals were sacrificed at 2 h for comparison with the nonblocked biodistribution data at the same time point (data are presented as percentage injected dose per gram of tissue [%ID/g]). The number of animals for each compound and time point are given in Tables 1–3⇓⇓.
%ID/g Values for 76Br-1 Measured in BALB/c Mice Allografted with EMT-6 Tumor Cells (n = 5)
%ID/g Values for 76Br-2 Measured in BALB/c Mice Allografted with EMT-6 Tumor Cells (n = 9)
%ID/g Values for 18F-FLT Measured in BALB/c Mice Allografted with EMT-6 Tumor Cells (n = 5)
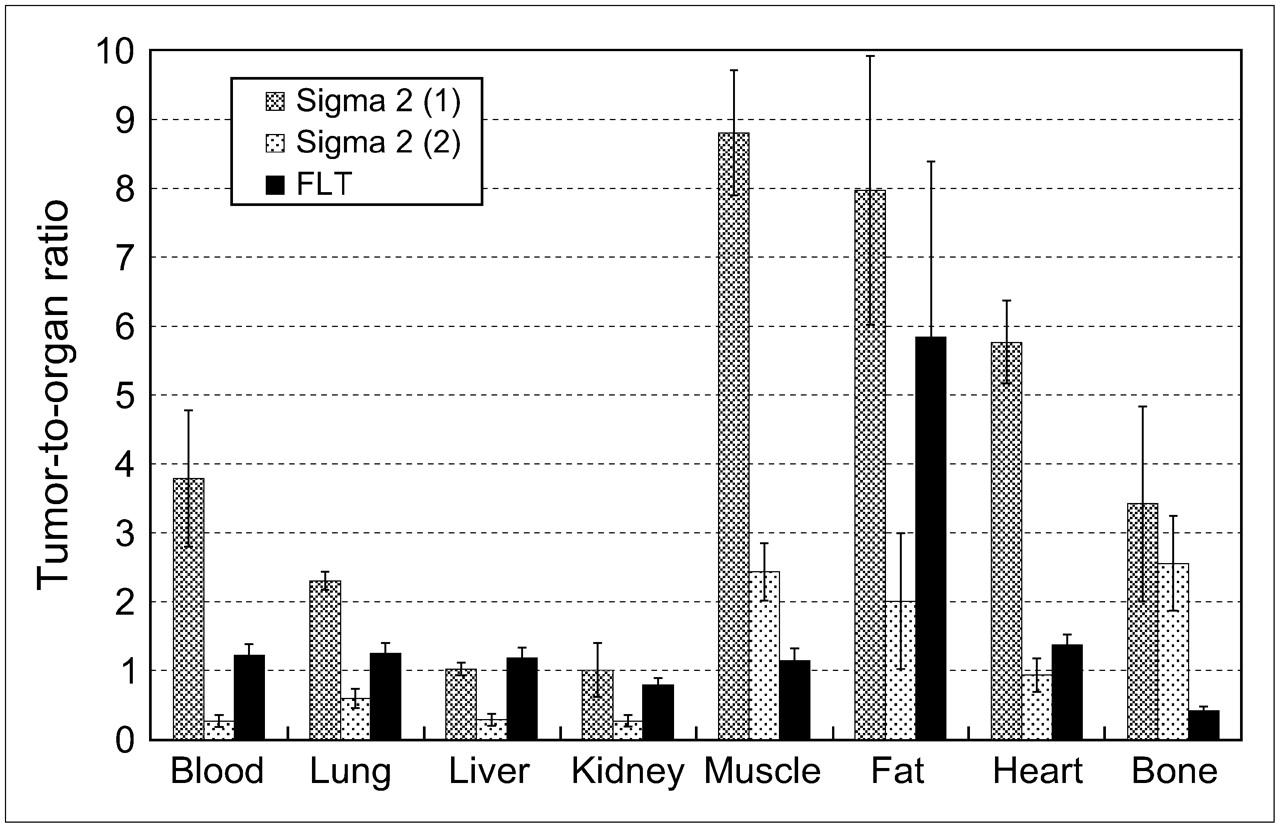
Statistical analysis was performed on the ratio data for selected organs (Fig. 3), the brain ratios, and the %ID/g analysis for blocked and nonblocked data for 76Br-1. Student t tests for blocked and nonblocked data used an α-value of 0.05, where α is the level of significance at which the critical value of the test is evaluated during computation. For all ratio data, ANOVA was performed with an α-value of 0.05 (Fig. 3). The Student t test was performed with Bonferroni adjustment using an α-value of 0.017 between ratios for the 3 compounds.

Bar chart shows comparison of ratio data between 76Br-1, 76Br-2, and 18F-FLT at 2 h. Brain is not shown because of high ratio for 76Br-1 (see text). ANOVA showed significance of tumor ratios at level of P ≤ 0.001. Cross-comparison between compounds using a Student t test showed no significance between 76Br-1 and 18F-FLT for liver, kidney, and fat and no significance between 76Br-1 and 76Br-2 for bone; all other values were significant at P ≤ 0.05. Data are presented as mean ± SD.
An imaging study was performed for 76Br-1 and 18F-FLT on a microPET-F220 (CTI-Concorde Microsystems Inc.). Three animals were imaged. The first animal was injected with 18F-FLT (18.13 MBq [0.49 mCi]). Two animals were injected with 76Br-1, in which one received a blocking dose as described. The mice received ∼9.25 MBq (∼0.25 mCi; <0.125 μg for the nonblocked study) of 76Br-1 via tail vein injection. The animals were imaged at 2 h after injection. The mouse injected with 18F-FLT was imaged at 1 h after injection. Comparison of the 1-h 18F-FLT image with the 2-h 76Br-1 image was believed to be appropriate as the biodistribution ratio data for 18F-FLT was not significantly different between 1 and 2 h. Images were reconstructed with 2-dimensional ordered-subset expectation maximization.
Scatchard Studies
Membrane Homogenate Preparation.
Membrane homogenates were prepared from ∼1 g EMT-6 tumor allografts, which were removed from tumor-bearing mice and frozen on dry ice immediately and stored at –80°C until use. Before homogenization, the tumor allografts were allowed to thaw slowly on ice. Tissue homogenization was performed at 4°C using a Potter−Elvehjem tissue grinder at a concentration of 1 g of tissue per milliliter in 50 mmol/L Tris-HCl, pH 8.0. The crude membrane homogenate was then transferred to a 50-mL centrifuge tube and resuspended to a concentration of 0.2 g of tissue per milliliter of 50 mmol/L Tris-HCl. Additional homogenization was accomplished using an Ultra-Turrax T8 polytron homogenizer (IKA Works, Inc.). The final homogenate was then centrifuged for 10 min at 1,000g, the pellet was discarded, and the supernatant was mixed by vortexing. Aliquots were stored at −80°C until use. The protein concentration of the suspension was determined using the DC protein assay (Bio-Rad) and averaged ∼10 mg of protein per milliliter of stock solution.
Scatchard Analysis.
Approximately 70 μg of membrane homogenate protein were diluted with 50 mmol/L Tris-HCl buffer, pH 8.0, and incubated with the radioligand in a total volume of 150 μL at 25°C in 96-well polypropylene plates (Fisher Scientific). The concentrations of 76Br-1 ranged from 1 to 21 nmol/L. After 60 min of incubation, the reactions were terminated by the addition of 150 μL of cold wash buffer (10 mmol/L Tris-HCl, 150 mmol/L NaCl, pH 7.4, at 4°C) using a 96-channel transfer pipette (Fisher Scientific), and the samples were harvested and filtered rapidly onto a 96-well fiberglass filter plate (Millipore) that had been presoaked with 100 μL of 50 mmol/L Tris-HCl buffer, pH 8.0, for 1 h. Each filter was washed 3 times with 200 μL of ice-cold buffer. The filters were then punched out and a Packard γ-counter (Beckman) with a counting efficiency of 29% for 76Br was used to quantitate the bound radioactivity. Nonspecific binding was determined from samples that contained 10 μmol/L of compound (4), a compound selective for σ2-receptor with high affinity (21). The direct binding equilibrium dissociation constant (Kd) and the maximum number of binding sites (Bmax) were determined by a linear regression analysis of the transformed data using the Scatchard method (28). The data from the radioligand saturation binding studies was transformed to determine the Hill coefficient, nH, defined by: where Bs is the amount of the specifically bound radioligand and L is the concentration of radioligand (29,30). nH was determined from the Hill plot of:
 versus log L.
RESULTS
Radiochemistry
TLC of the reaction mixture for both 76Br-1 and 76Br-2 showed >70% incorporation of 76Br after 5 min. Yields for 76Br-1 and 76Br-2 were 64% ± 11% (low, 47%; high, 76%; 7 reactions) and 65% ± 3% (low, 63%; high, 69%; 3 reactions) after HPLC purification, and >99.5% radiochemical purity was obtained. In a separate experiment the specific activity of 76Br-1 was measured at the end of synthesis and found to be 40.33 GBq/μmol (1,090 mCi/μmol) as measured by LC/MS. Standard quality control using a HPLC was used to determine the specific activity of 76Br-2 (89.39 GBq/μmol [2,416 mCi/μmol]).
Biodistribution Studies
The %ID/g of tissue data obtained from the biodistribution studies of 76Br-1 and 76Br-2 are shown in Tables 1 and 2. Initially, at 5 min, liver (11.0 ± 0.3 and 18.9 ± 3.1 %ID/g) and kidney (31.2 ± 2.9 and 49.7 ± 5.9 %ID/g) uptake of 76Br-1 and 76Br-2 was high because of both rapid excretion and the high density of σ-receptors in these organs. The uptake values for 76Br-2 at 2 h were 3.7 ± 0.8, 3.9 ± 0.6, and 1.0 ± 0.3 %ID/g for liver, kidney, and tumor, respectively. At 2 h, 76Br-1 had uptake values of 1.7 ± 0.1, 1.8 ± 0.5, and 1.7 ± 0.2 %ID/g for the liver, kidney, and tumor, respectively.
A blocking study performed at 2 h for 76Br-1 showed a decrease in the liver and tumor uptake to 1.4 ± 0.1 and 0.98 ± 0.19 %ID/g. The Student t test comparing the nonblocked data with the blocking data showed this difference to be significant (P ≤ 0.005). The value for the blocked kidney was 1.3 ± 0.3, which is not significant (P ≥ 0.005). Table 3 shows the results of the biodistribution study using 18F-FLT. For all organs except the spleen and bone, the %ID/g values decreased from 30 min to 2 h.
The tumor-to-normal tissue ratios for the 3 compounds studied are presented at the 2-h time point (Fig. 3). The tumor-to-brain ratios are not shown because of the large ratio for 76Br-1 (32.4 ± 3.6); 18F-FLT and 76Br-2 had tumor-to-brain ratios of 7.66 ± 1.13 and 6.30 ± 1.33, respectively. 18F-FLT displayed tumor-to-normal tissue ratios of ∼1.0 or less with the exception of the tumor-to-brain ratio (value above) and the tumor-to-fat ratio, which was 5.84 ± 2.55 (Fig. 3). 76Br-1 had the highest tumor-to-normal tissue ratios for all organs except liver, which is attributed to the high density of σ2-receptors in this organ.
ANOVA of tumor-to-normal tissue ratios revealed that the difference in the 3 compounds studied was significant. However, the ANOVA does not reveal pairwise differences between the 3 radiotracers. Therefore, a Student t test was run to determine the level of significance between the tumor-to-normal tissue ratios of each radiotracer. Tumor-to-normal tissue ratios for 76Br-1 were found to be significantly different from that of 76Br-2 and 18F-FLT for tumor-to-blood, tumor-to-lung, tumor-to-muscle, tumor-to-heart, and tumor-to-brain ratios (P ≤ 0.05). No significance was found for the tumor-to-liver, tumor-to-kidney, and tumor-to-fat ratios between 76Br-1 and 18F-FLT. No significance was found for the tumor-to-brain ratio between 76Br-2 and 18F-FLT and for the tumor-to-bone ratio between 76Br-1 and 76Br-2.
Imaging Studies
Coronal slices for 18F-FLT at 1 h after injection, 76Br-1 nonblocked, and 76Br-1 under σ-receptor−blocking conditions at 2 h are presented (Fig. 4). The outline of the upper torso of a mouse was overlaid on the images to give a sense of the positioning of the animal. The tumors are visible with both tracers (18F-FLT and 76Br-1) and the position of tumors within the animal was confirmed by palpation.
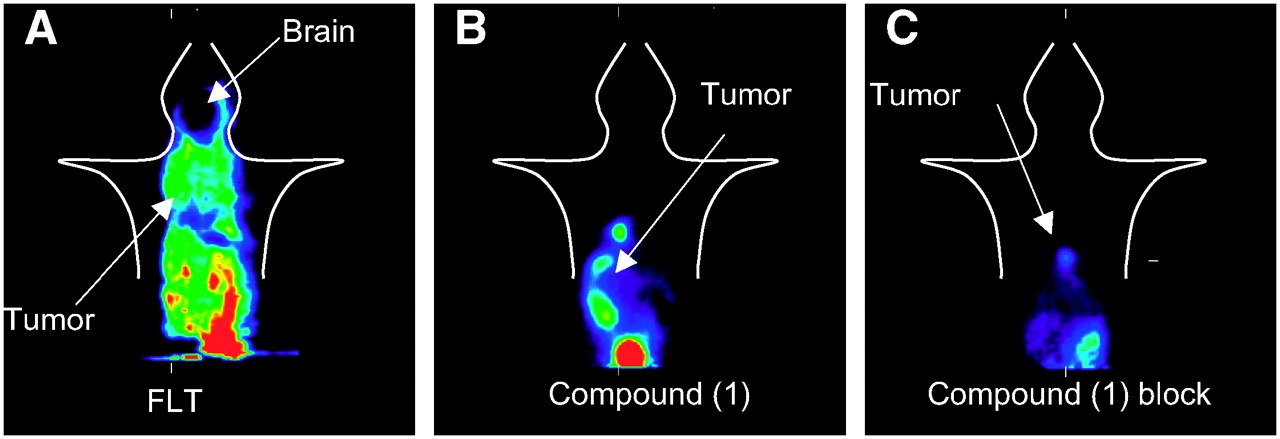
microPET image of 3 BALB/c mice implanted with EMT-6 cells and imaged with 18F-FLT (A), 76Br-1 nonblocked (B), and 76Br-1 with a blocking dose of compound (5) (C). Animals were imaged in supine position. Arrows in the images point to the tumor and in the case of FLT a second arrow points to the brain.
The animal receiving a receptor-blocking dose of compound (5) (Fig. 4C) showed decreased uptake of 76Br-1 compared with the nonblocked animal (Fig. 4B). The uptake of 76Br-1 in the microPET image also was greater at the site of the tumor when the receptor-blocked animal was compared with the nonblocked animal. There was also a greater contrast of the tumor-to-background tissues when the nonblocked animal with 76Br-1 was compared with the animal injected with 18F-FLT. As determined in the biodistribution studies, the enhanced imaging properties of 76Br-1 over 18F-FLT were evident. A uniform uptake of 18F-FLT was seen throughout the animal except in the brain.
Scatchard Analysis
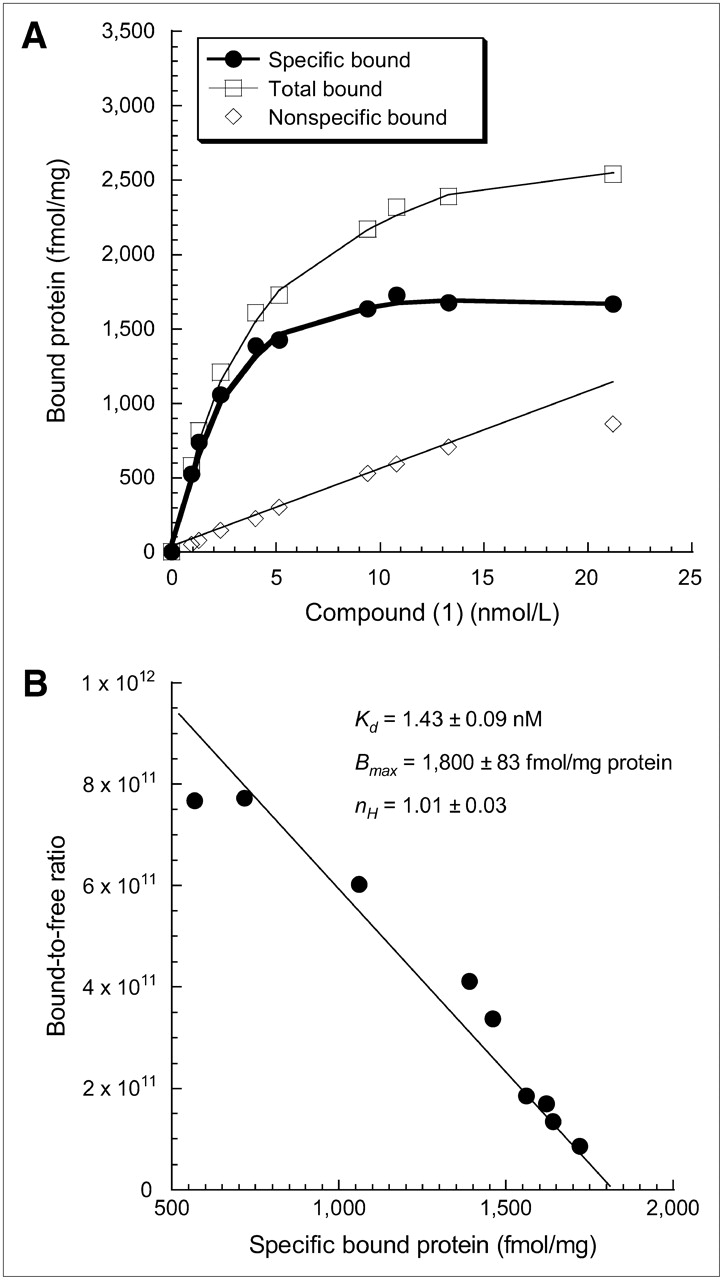
Direct saturation binding studies were performed using 76Br-1 with membrane homogenates of EMT-6 mouse breast tumor allografts. The saturation curves and Scatchard plots are presented here (Fig. 5). The Kd and Bmax values of the receptor-radioligand binding of 76Br-1 were 1.43 ± 0.09 nmol/L and 1,800 ± 83 fmol/mg protein, respectively. The mean Hill slope (nH) value was found to be close to unity.

Scatchard analysis of 76Br-1 binding to σ2-receptors in membrane homogenates from EMT-6 mouse breast tumor allografts. (A) Representative saturation binding experiments that show total binding, nonspecific binding, and specific binding. (B) Scatchard plots that were used to determine Kd, Bmax, and nH values. Results are presented as mean ± SE of triplicate experiments.
DISCUSSION
Previous work has shown that conformationally flexible benzamides are potentially useful for imaging the proliferative status of breast tumors using EMT-6 allografts as a model system (20). This work was performed by radiolabeling the benzamides with 11C, a PET-based radionuclide having a relatively short half-life (t½ = 20.4 min). However, benzamide compounds that incorporate longer-lived isotopes such as 18F (t½ = 109.8 min) and 76Br (t½ = 16.2 h) are needed if this imaging strategy is translated to clinical PET studies, which require distribution to PET scanner facilities that do not have in-house isotope production capabilities.
Our initial attempt was to prepare an 18F-labeled analog of the conformationally flexible benzamide derivatives developed in our group. However, we found that substituting the C5 position of the benzamide aromatic ring with a 2-fluoroethyl moiety, a method commonly used in the development of 18F-labeled radiotracers, resulted in a dramatic reduction in affinity for the σ2-receptor (i.e., compound (3) in Fig. 1). Because compounds (1) and (2) have a Br atom in the parent structure, a σ2-receptor−based PET radiotracer containing a longer-lived radionuclide could be readily obtained by simply preparing the corresponding 76Br-labeled versions of compounds (1) and (2). The goal of the current study was to prepare 76Br-1 and 76Br-2 and evaluate their potential for imaging breast tumors using a mouse mammary adenocarcinoma as a model system.
The 76Br-radiolabeled compounds 76Br-1 and 76Br-2 were prepared using standard electrophilic halogenation of the corresponding tributylstannyl precursor in a simple 1-step reaction (reaction (b) in Fig. 2). The synthesis and subsequent HPLC purification gave a high yield (average, >50%) and high radiochemical purity (>99.5%) of the 2 σ2-receptor compounds. Specific activities of the 2 compounds were also found to be high (>37 GBq/μmol [>1,000 mCi/μmol]).
For both 76Br-1 and 76Br-2, there was rapid washout of the radiotracer from nontarget organs and a good retention in the tumor. There was also a rapid clearance from the liver and kidney until 2 h, at which time the %ID/g was quite comparable with the tumor uptake. Because both liver and kidney have been shown to have a high density of σ2-receptors (8), the prolonged retention of 76Br-1 and 76Br-2 in these organs is likely due to the labeling of σ2-receptors. This was also confirmed in our σ-receptor−blocking studies. 76Br-1 was found to have a high amount of uptake in the liver and kidneys. As it is known that these organs express σ-receptors, this was not unexpected (8). Because of this high uptake, this ligand may not be a good radiotracer for imaging tumors in the abdominal cavity.
76Br-1 had the highest tumor-to-normal tissue ratios at the 2-h time point compared with 76Br-2 and 18F-FLT (Fig. 3). It is interesting to note that the uptake of both 76Br-1 and 76Br-2 into the tumor is lower than the uptake of 18F-FLT from 30 min to 2 h and that the clearance was much faster for both 76Br-1 and 76Br-2 compared with 18F-FLT. Even though there was clearance of the 76Br-labeled radiotracers from the tumor, there was a faster clearance of the radiotracers from normal tissues, which resulted in an increase in the tumor-to-normal tissue ratios for both 76Br-1 and 76Br-2 over time (data not presented). Given that a high target-to-background ratio is important for in vivo imaging, the higher tumor-to-normal tissue ratios obtained with 76Br-1 may be more optimal for tumor imaging than the high tumor uptake and lower tumor-to-normal tissue ratios obtained with 18F-FLT. This was also confirmed in the microPET studies, which showed a better visualization of the tumor with 76Br-1 than what was observed with 18F-FLT (Fig. 4).
It is well known that FLT does not cross the blood–brain barrier (BBB). This highlights another advantage of imaging with the σ-receptor. The log P values for compounds (1) and (2) are 3.3 and 3.17, which indicates that they should be able to cross the BBB. This can be seen in the biodistribution data—that is, there was rapid uptake at 5 min (1.6 %ID/g) but fast clearance so that at 2 h there was little activity in the brain (0.053 %ID/g). It should also be noted that the tumor-to-brain ratio was quite high for 76Br-1 (tumor-to-brain ratio = 32.4 ± 3.6 at 2 h). Because it has been shown that rat and human gliomas have a high density of σ2-receptors, 76Br-1 may be a useful radiotracer for imaging brain gliomas (9,10).
The longer half-life of 76Br also enabled us to conduct Scatchard studies to further characterize the binding of this ligand to σ2-receptors. The results of the direct binding assays showed that 76Br-1 had a low level of nonspecific binding. It should be noted that the Kd value from the Scatchard studies revealed 76Br-1 to have a higher affinity for σ2-receptors than that reported previously (17). The earlier study reported a competitive binding equilibrium dissociation constant (Ki) obtained from indirect competitive binding assays using 3H-1,3-di-ortho-tolyguanidine as the radioligand and rat liver membranes as the tissue source of σ2-receptors. The Scatchard data reported here are from a direct binding assay and were obtained in membrane homogenates obtained from allografts from EMT-6 cells, which yielded a more accurate binding affinity for this ligand for σ2-receptors expressed in tumors. The results of the Hill transformation showed that the receptor binding of 76Br-1 displayed a single site and noncooperative binding.
CONCLUSION
The results of this study show that both 76Br-1 and 76Br-2 have a high uptake in tumors in vivo using EMT-6 breast tumors as a model system. The high liver uptake of this radiotracer will likely prevent imaging tumors in the abdominal cavity. The high affinity and low nonspecific binding indicate 76Br-1 has the potential to be a valuable probe for evaluating the σ2-receptor status of solid tumors in vivo (11,12). 76Br-1 gave higher tumor-to-normal tissue ratios than 76Br-2 and 18F-FLT, and 76Br-1 has potential for imaging breast tumors in vivo with PET. Because the tumor-to-normal tissue ratios in the lung, head and neck, and brain are quite high, it may be possible to image lung, head and neck, and brain tumors using this imaging strategy.
Acknowledgments
The authors thank John A. Engelbach, Nicole M. Fettig, Lynne Jones, Jerrel Rutlin, and Lori Strong for animal handling and microPET imaging. Funding was received from the Department of Defense Breast Cancer Research Program (grant DAMD 17-01-0446) and the Department of Energy (grant DEFG02-84ER-60218). The National Cancer Institute (NCI) provided additional funding (grants R24 CA86307, F32 CA88487-01, and R33 CA102869-01). The NCI Cancer Center Support Grant (P30 CA91842) supports the Small-Animal Imaging Core of the Alvin J. Siteman Cancer Center at Washington University and Barnes-Jewish Hospital in St. Louis, MO.
References
- Received for publication October 4, 2005.
- Accepted for publication March 6, 2006.


