


Visual Abstract

Abstract
Quantitative dynamic PET with compartmental modeling has the potential to enable multiparametric imaging and more accurate quantification than static PET imaging. Conventional methods for parametric imaging commonly use a single kinetic model for all image voxels and neglect the heterogeneity of physiologic models, which can work well for single-organ parametric imaging but may significantly compromise total-body parametric imaging on a scanner with a long axial field of view. In this paper, we evaluate the necessity of voxelwise compartmental modeling strategies, including time delay correction (TDC) and model selection, for total-body multiparametric imaging. Methods: Ten subjects (5 patients with metastatic cancer and 5 healthy volunteers) were scanned on a total-body PET/CT system after injection of 370 MBq of 18F-FDG. Dynamic data were acquired for 60 min. Total-body parametric imaging was performed using 2 approaches. One was the conventional method that uses a single irreversible 2-tissue-compartment model with and without TDC. The second approach selects the best kinetic model from 3 candidate models for individual voxels. The differences between the 2 approaches were evaluated for parametric imaging of microkinetic parameters and the 18F-FDG net influx rate, Ki. Results: TDC had a nonnegligible effect on kinetic quantification of various organs and lesions. The effect was larger in lesions with a higher blood volume. Parametric imaging of Ki with the standard 2-tissue-compartment model introduced vascular-region artifacts, which were overcome by the voxelwise model selection strategy. Conclusion: The time delay and appropriate kinetic model vary in different organs and lesions. Modeling of the time delay of the blood input function and model selection improved total-body multiparametric imaging.
- image processing
- PET
- radiotracer tissue kinetics
- compartmental modeling
- parametric imaging
- total-body dynamic PET
PET allows for dynamic scanning to monitor the spatiotemporal distribution of a radiotracer in the living body. With tracer kinetic modeling (e.g., compartmental models or graphical methods (1)), dynamic PET allows quantification of kinetic parameters in regions of interest (ROIs) and voxelwise (i.e., parametric imaging) (2,3). PET parametric imaging has the potential to improve tumor contrast, derive meaningful biologic measures of tracer transport and binding, and enable quantitative assessment of tumor response to cancer treatment as compared with SUV (4). As the axial length of conventional PET scanners commonly ranges from 15 to 30 cm, clinical studies using dynamic PET have typically been limited to a restricted axial field of view that can cover only single organs or specific tumor locations. Whole-body implementation of parametric imaging has been pursued using conventional PET scanners but is limited mainly to the simplified Patlak graphical method (5–7), which is computationally efficient but does not explore the full potential of kinetic modeling for multiparametric imaging.
The advent of PET scanners with an extended long axial field of view, such as the uEXPLORER (United Imaging) (8–10), the PennPET Explorer (11,12), and the Quadra (Siemens) (13), is providing a paradigm shift in dynamic imaging. The longest of these has an axial field of view of 194 cm, providing not just unprecedented photon detection sensitivity but also simultaneous dynamic imaging and parametric imaging of the entire body (9,14). Image-derived input function (IDIF) can also be obtained from the left ventricle or the aorta. Metastatic lesions that are widely separated can now be imaged at the same time with total-body PET. The objective of this work was to conduct a pilot clinical study to test the feasibility of multiparametric imaging with compartmental modeling in total-body dynamic PET.
A typical approach to PET parametric imaging is to apply a single model to all voxels in the image (6,14,15). This approach can be appropriate for conventional single-organ parametric imaging but becomes insufficient for total-body parametric imaging in which organ- and tissue-appropriate models are required. In this work, we evaluated a voxelwise compartmental modeling strategy for total-body PET multiparametric imaging.
MATERIALS AND METHODS
Total-Body Dynamic PET/CT Image Acquisition
Ten subjects, including 5 patients with metastatic genitourinary cancer and 5 healthy volunteers, were recruited into this study at the University of California (UC) Davis Medical Center. Prior Ethics Committee and Institution Review Board approval and written informed consent were obtained. Patients were enrolled and scanned before the initialization of targeted therapy or immunotherapy. All subjects fasted for at least 6 h before the study.
PET/CT imaging was performed on the uEXPLORER total-body system at the UC Davis EXPLORER Molecular Imaging Center. Each subject had a total-body CT scan from head to toe with arms down, followed by a 60-min dynamic PET scan using an injection of approximately 370 MBq (10 mCi) of 18F-FDG. List-mode data were acquired and binned into 29 frames: 6 × 10 s, 2 × 30 s, 6 × 60 s, 5 × 120 s, 4 × 180 s, and 6 × 300 s. Each frame was reconstructed into an image of size 150 × 50 × 486 with 4 × 4 × 4 mm voxels using the vendor implementation of the time-of-flight ordered-subset expectation maximization algorithm with 4 iterations and 20 subsets. Standard corrections, including normalization, attenuation correction, dead-time correction, decay correction, random correction, and scatter correction, were all applied (10).
Compartmental Modeling and Parametric Imaging
Lesion Selection and ROI Placement
For each scan, ROIs were placed in various organs and on suspected lesions to extract regional time–activity curves. Up to 5 target lesions (maximum, 2 per organ) were identified per scan. The lesion ROIs were defined using 41% of the SUVmax (at 60 min after injection) in each lesion (16). An additional ROI was placed in the ascending aorta using both early-frame and late-frame images as guidance to extract an IDIF, which is denoted by  . Lesion were delineated using AMIDE software (17).
Compartmental Models
The commonly used irreversible 2-tissue-compartment (2T) model (Fig. 1A) (1) was used to model the dynamic 18F-FDG PET data. The corresponding ordinary differential equation of this 2T model is… (Eq. 1)where
  is the 18F-FDG concentration in the plasma,
  is the concentration of free 18F-FDG and
  is the concentration of metabolized tracer in the tissue space at time t. The constant
  is the rate of 18F-FDG delivery from the plasma to the tissue space in units of mL/min/cm3 (18);
  (min−1) is the rate constant of tracer exiting the tissue space;
  (min−1) is the rate constant of 18F-FDG being phosphorylated. This irreversible model assumes that the dephosphorylation process is negligible (i.e.,
  ). The total concentration of 18F-FDG in the extravascular space is…
 (Eq. 2)

Compartmental modeling of 18F-FDG. (A) 2T model and reduced 1T and 0T models. (B) Graph of time courses of 18F-FDG in vascular and extravascular spaces that constitute total tissue time–activity curve. a.u. = arbitrary units.
where  and
and  is the impulse response function defined by…
 (Eq. 3)The macro parameters
  (net influx rate) and
  (initial volume of distribution) can be calculated by (5,19)…
 (Eq. 4)The total radioactivity that can be measured by PET is modeled as the sum of the time courses of 18F-FDG in the vascular and extravascular spaces (Fig. 1B):
 (Eq. 5)where
  (mL/mL) is the fractional blood volume and
  represents the whole blood.
Modeling of Voxelwise Time Delay in IDIF
A time delay exists between where the IDIF is extracted and the arrival of the radiotracer in the tissue of interest. Within the limited axial field of view of conventional PET scanners, the time delay effect has been commonly neglected because of the short distance between an IDIF and tissue ROIs, especially if the temporal resolution is low (e.g., 20–40 s per frame). Accounting for the time delay has conventionally been considered necessary only for fast kinetics when relatively high temporal sampling is used (20,21). A recent example was shown by Feng et al. (22) for fast total-body imaging of early 18F-FDG kinetics. In our work, whereas the dynamic scan used a standard temporal resolution (10 s/frame), we noted the long distance between the ascending aorta and distant lesions, as well as potentially high vascular contributions in some lesions. Hence, the time delay effect is explicitly modeled in the blood input to each voxel by… (Eq. 6)with the time delay parameter
  to be jointly estimated with other kinetic parameters though the time–activity curve fitting of a voxel. We postulate that time delay correction (TDC) has a higher impact on kinetic quantification if the fractional blood volume,
  , is larger in the tissue, because the increased fraction of the vascular time course in turn influences the estimate of the extravascular time course,
  , as projected from Figure 1B.
Fitting Optimization and Setting
A measured time–activity curve,  , is fitted with the model time–activity curve,
  , using a nonlinear least-square formulation:
 (Eq. 7)where
  denotes the residual sum of squares of the curve fitting. θ is the unknown parameter set. For the irreversible 2T model,
  .
.  is the midpoint of the mth frame in a total of M frames, and
  is the weight for frame m. Given our interest in both Ki and K1, a uniform weight was used as suggested by prior studies (23–25) (also demonstrated in Supplemental Fig. 1; supplemental materials are available at http://jnm.snmjournals.org).
The classic Levenberg–Marquardt algorithm with 50 iterations was used to solve the optimization problem in a similar way to our other work (26) and was implemented using C/C++ programming. The initial values of κ and  were set to
  and 0.01, respectively. The lower bound was zero and the upper bound was
  and 1.0, respectively. The time delay,
  , was jointly estimated by a grid search with the lower and upper bounds set to −10 and 50 s, respectively.
Voxelwise Model Selection
Conventionally for simplicity, parametric imaging uses a single kinetic model (e.g., the irreversible 2T model) for all voxels. In total-body parametric imaging, a wide physiologic heterogeneity may exist within the field of view. In addition to the 2T model, we also considered the 1-tissue-compartment (1T) model and zero-tissue-compartment (0T) model (Fig. 1A; Table 1). The 0T model is more suitable for those voxels containing only blood. The 1T model is equivalent to the 2T model with  , implying that the phosphorylation process can be neglected when k3 is small and the data are noisy. The 0T model is a special case of the 1T model with
  . The best model was chosen for each voxel j from a set of candidate models (0T, 1T, and 2T in Table 1) according to the minimum Akaike information criterion (AIC),
 (Eq. 8)where
  denotes the AIC of model order l (
 ) for fitting the time--activity curve at voxel j. The AIC with correction for a small number of frames is calculated by (27)…
 (Eq. 9)
Models Used for Dynamic 18F-FDG PET Kinetic Modeling
where RSS is calculated using Equation 7 for a specific model and n denotes the total number of unknown parameters in the model. A lower AIC value indicates a better model (27).
Parametric Imaging with Kernel Smoothing
Voxelwise implementation of compartmental modeling leads to the generation of parametric images of tracer kinetics, which usually suffer from high noise in voxels. The kernel method (28) was applied here as postreconstruction smoothing to reduce noise in the dynamic images, a process that is also equivalent to nonlocal means smoothing (28). Fundamentally, it rests on deriving, for each patient dataset, a kernel matrix built from 4 consecutive composite frames of 5, 15, 20, and 20 min, respectively. For each voxel, k-nearest neighbors with k (number of nearest neighbors) = 50 was constructed in a cubic 9 × 9 × 9 voxel space. More details of the method have been previously published (28). The same kernel matrix was also applied to the parametric images for further noise suppression.
Statistical Analysis
Statistical data were analyzed mainly for demonstrating the impact of TDC and model selection. To evaluate the effect of TDC, linear regression analysis and a group comparison were performed for different kinetic parameters of lesions using the paired Student t test and Wilcoxon signed-rank test. A P value of less than 0.05 was considered statistically significant. For assessing the impact of model selection, artifacts in the Ki parametric images were identified visually in blood regions. AIC was calculated to indicate a potential overfitting of the blood time–activity curves.
RESULTS
Patient Characteristics and Image Data
Table 2 lists the characteristics of the study subjects. All dynamic scans of the 5 healthy subjects and 5 cancer patients were successful. Nineteen lesions were identified on the SUV images of the cancer patients. Supplemental Figure 2 shows the dynamic 18F-FDG PET images and regional time–activity curves for 2 patients with cancer. The 2 patients shared a similar time–activity curve shape for the brain and liver, but the time–activity curves of the lesions were very different.
Subject Characteristics
Effect of Time Delay Correction (TDC)
Figure 2 shows the results of applying TDC by joint estimation to fit lesion time–activity curves using the 2T model. The TDC resulted in an improvement in fitting the lesion time–activity curve, particularly in the early phase where the peak is. The improved fit is further evidenced by a statistical quality evaluation using AIC in the lesions (Fig. 2B). A lower AIC was achieved by the TDC in most lesions. The individual lesion Ki values by the 2 approaches are shown in Figure 2C. Generally, Ki became higher after TDC. The percentage change in Ki and K1 was further plotted against the fractional blood volume vb in Supplemental Figure 3. As vb increased, the difference in the 2 approaches became larger for both Ki and K1.

Graphs of time delay and its impact on lesion time–activity curve fitting and kinetic quantification. (A) Fitting of liver lesion time–activity curve with no TDC and with time delay jointly estimated. (B) AIC difference between 2T models with and without TDC for time–activity curve fitting in 19 lesions. (C) Comparison of Ki values for individual lesions. a.u. = arbitrary units.
Table 3 summarizes the kinetic results estimated by the 2 approaches (i.e., with and without TDC) in all lesions. The time delay was 7 ± 5 s (range, −2 to 18 s), which is significantly different from zero as indicated by the small P value of the statistical tests. TDC led to a much higher  and appreciably lower K1 estimates (P < 0.002). Although the mean and SD of Ki in the pooled analysis had only a small difference between the 2 approaches, the paired statistical tests show TDC had a statistically significant effect (P ≤ 0.0005) on Ki estimation, as reflected by the pairwise changes shown in Figure 2C and Supplemental Figure 3. The impact on V0 was also statistically significant (P < 0.02).
Mean and SD of Lesion Kinetic Parameters Estimated by 2T Model With and Without TDC
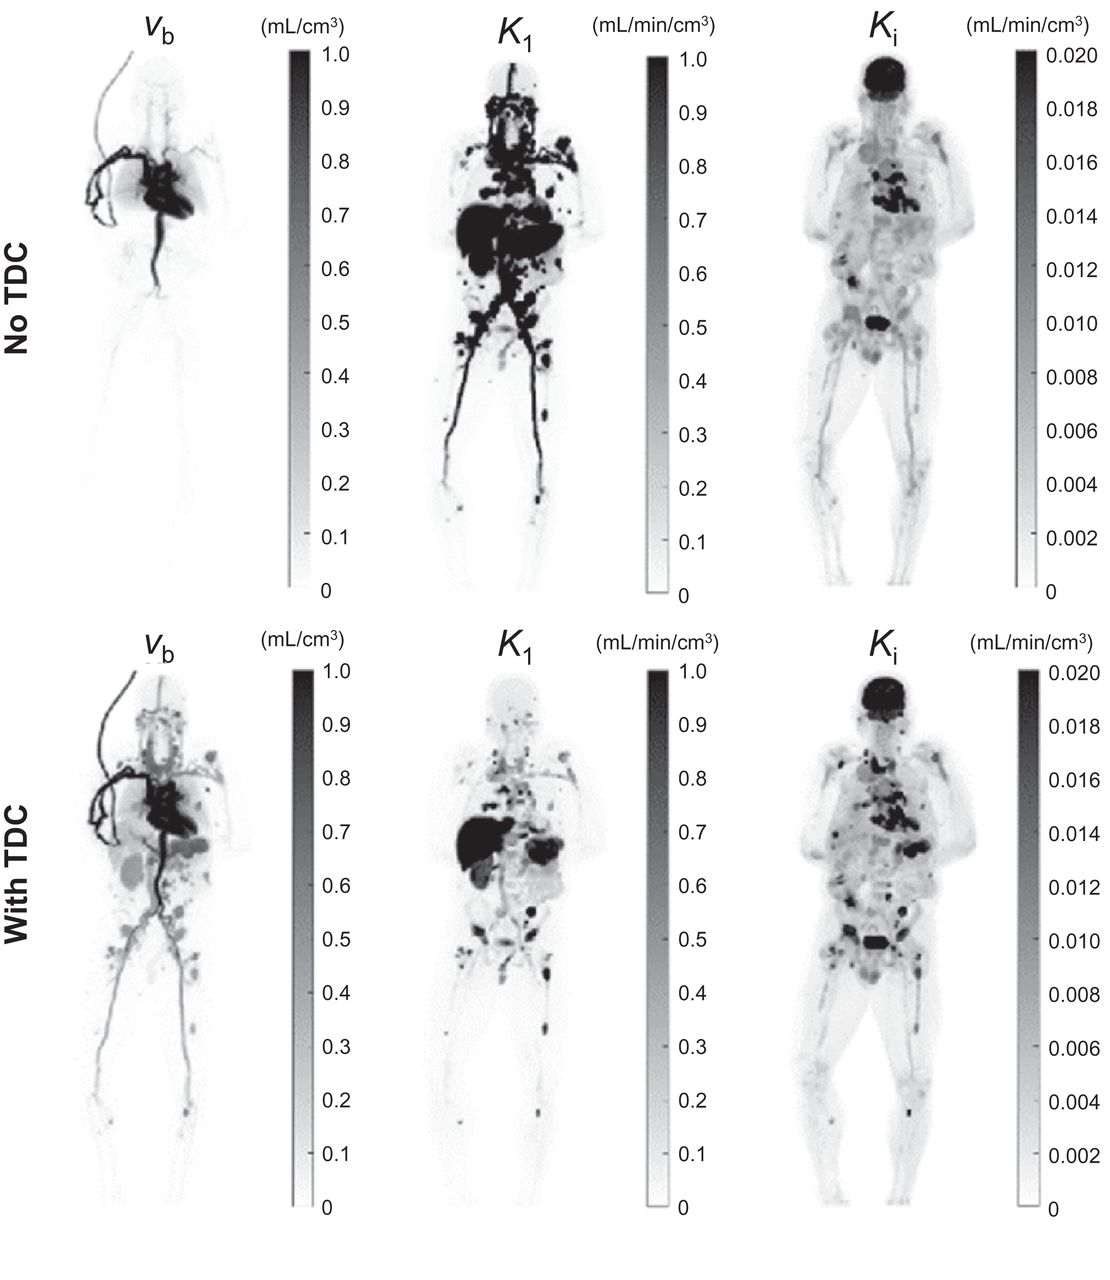
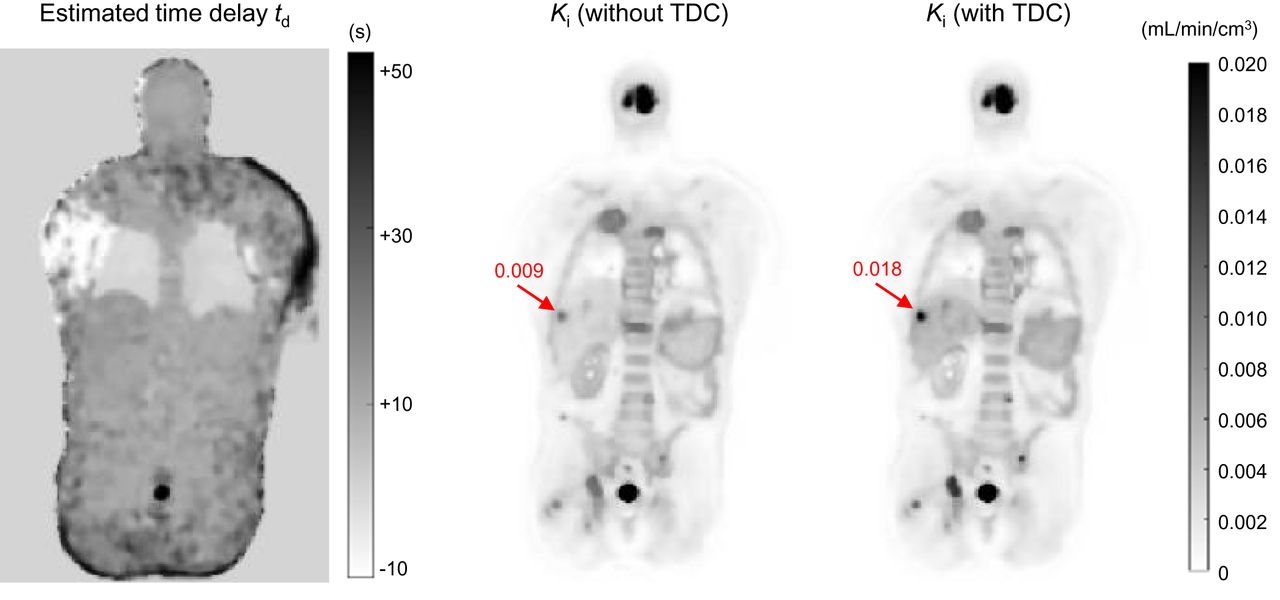
Examples of parametric images of different kinetic parameters are shown in Fig. 3 for 1 cancer patient. Without TDC, the vb image did not show all the vasculature, especially in the legs, where the time delay was large. The K1 image became clearer after the TDC because the vasculature disappeared in this image. Fig. 4 further shows the estimated time delay map and Ki images. Lesions were less visible with low Ki values if no TDC was implemented; most lesions were enhanced, with a higher value after TDC.

Demonstration of parametric imaging using 2T model with and without TDC for cancer patient. Shown are maximum-intensity-projection maps for vb, K1, and Ki.

Coronal plane of estimated time delay td map and Ki parametric images with and without TDC for cancer patient. Arrows point to liver lesion.
Effect of Voxelwise Model Selection
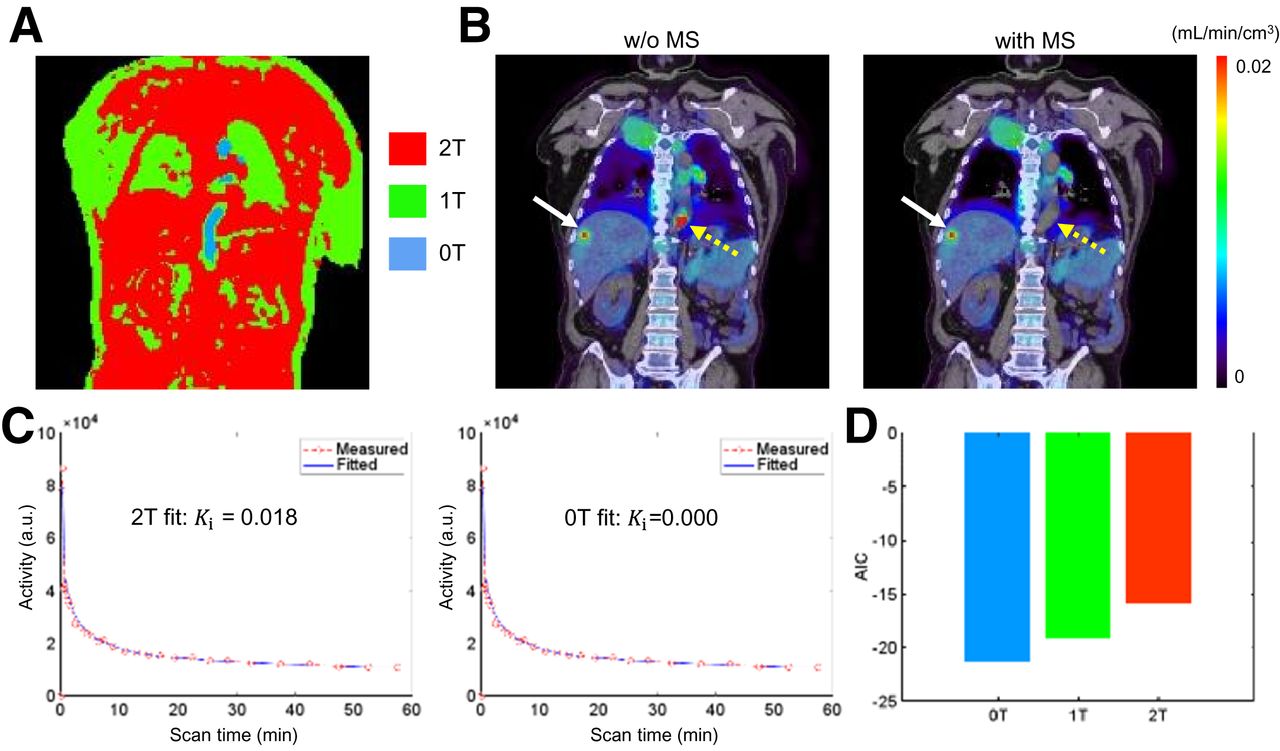
Figure 5A shows the map of the model order (0T, 1T, and 2T) selected for individual voxels for a cancer patient scan. Most body parts, such as soft tissues, followed the 2T model, whereas the lungs and skin favored the 1T model according to AIC. Vascular regions (e.g., the heart chambers and arteries) followed the 0T model. All lesions followed the 2T model. The parametric image of Ki generated using a single 2T model (Fig. 5B) contains a suggestive hot spot of a high Ki value. It disappeared after applying voxelwise model selection. Figure 5C demonstrates that both the 2T and the 0T models fitted the time–activity curve well but that the resulting Ki values were very different (0.018 vs. 0.0 mL/min/cm3). The AICs of different fits by the 0T, 1T, and 2T models are compared in Figure 5D. It indicates that the 0T model was best for fitting the blood time–activity curve, whereas the 2T model overfitted the time–activity curve and resulted in a falsely high value of Ki.

Evaluation of impact of model selection (MS). (A) Distribution map of different kinetic models (0T, 1T, and 2T). (B) Parametric image of Ki (overlaid on CT images) by 2T model with and without (w/o) voxelwise MS. Solid arrows point to potential lesions, and dashed arrows point to blood voxels in descending aorta. (C) Blood time–activity curve fitted with 2T and 0T models. (D) AIC values of 3 models (0T, 1T, and 2T). a.u. = arbitrary units.
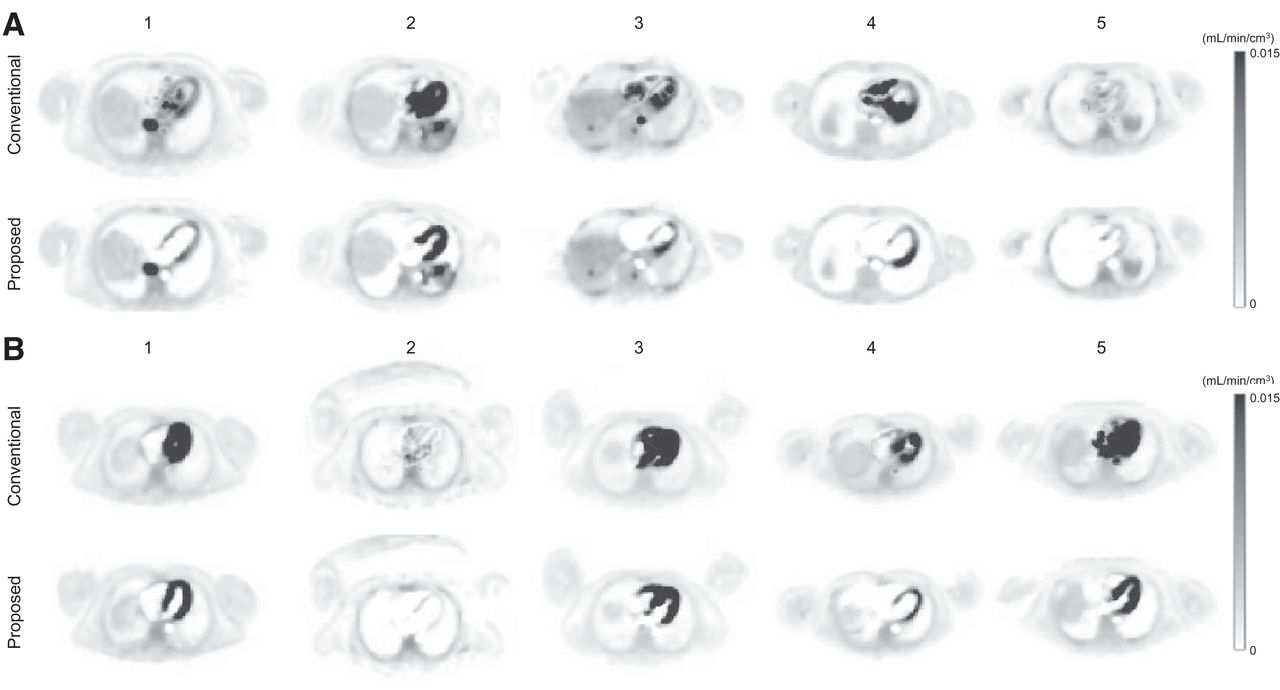
Figure 6 compares the conventional single 2T model (with TDC) with the proposed method (with model selection and TDC) for parametric imaging of Ki at the level of the heart in all 10 subjects. The conventional method resulted in artificially high Ki values in some voxels containing primarily blood. The myocardium was also difficult to visualize in each patient scan. In comparison, the proposed method largely removed those artifacts, and appropriate model selection led to clear visualization of the myocardium in all subjects.

Comparison of 18F-FDG Ki parametric images generated by conventional 2T model (with TDC) and proposed approach that includes model selection and TDC in 5 patients with cancer (A) and 5 healthy subjects (B).
Demonstration of Multiparametric Images
With the improved voxelwise modeling strategy, we show parametric images for a range of kinetic parameters, including vb, K1, Ki, and V0, for 1 cancer patient in Figure 7 and for 1 healthy subject in Supplemental Figure 4. The SUV images at 60 min after injection are also included. Although the Ki and SUV images share similar information in most patients, the vb, K1, and V0 images demonstrate very different spatial patterns in the body, thus providing information complementary to that provided by SUV. Supplemental Figure 5 demonstrates that parametric images can potentially be more useful than SUV for liver tumor imaging and brain tumor imaging.

Comparison of standard SUV image with parametric images of 18F-FDG influx rate Ki, fractional blood volume vb, 18F-FDG delivery rate K1, and volume of distribution V0 images of cancer patient. Shown are maximum-intensity-projection maps.
DISCUSSION
In this paper, we have evaluated a voxelwise strategy for total-body 18F-FDG PET parametric imaging using compartmental modeling. TDC through joint estimation during time–activity curve fitting was found to be significant (Fig. 2) and had a high impact on quantification and parametric imaging of vb and K1 (Table 3; Fig. 3). The impact on Ki was of lesser extent when vb was small but became higher as vb increased (Fig. 4; Supplemental Figure 3). Dispersion correction was not explicitly included in this study, but the incorporation of vb may partly account for the potential dispersion effect (29). The vb values of lesions estimated in this study were relatively high (0.23 ± 0.18 mL/cm3), as likely reflects that most patients had clear cell renal cell carcinoma, which tends to be highly vascular (30). It is also perhaps because vb is more like a method parameter than being quantitative, given that it also accounts for the dispersion effect.
Our study also found that the standard 2T model led to artificially high values in the Ki image in those voxels containing primarily blood. This effect was caused by overfitting of the time–activity curves that better follow the 0T model or 1T model, as indicated by the AIC comparison (Fig. 5). We addressed this problem by applying voxelwise model selection using AIC. The method led to clear visualization of the myocardium, whereas the standard model did not (Fig. 6). The AIC-based model selection is driven by a statistical fit quality evaluation and cannot be overinterpreted physiologically. For example, the choice of 1T over 2T does not indicate the nonexistence of phosphorylation but suggests that k3 can be neglected when the data are noisy. As an alternative to AIC, other approaches are also possible by applying sparsity constraints to kinetic parameters or using sparse spectral analysis (31). In addition, factor analysis (32) and mixture models (33) could also be advantageous to explore in total-body parametric imaging (34).
As the first step for demonstrating a workable modeling strategy, we considered only the irreversible 2T model. This model is appropriate when the dephosphorylation process is negligible during the 1-h dynamic scan time. However, the reversible 2T model (with k4 > 0) can be more appropriate for kinetic quantification of organs such as the liver (35) and myocardium (36). The liver and lungs also receive dual blood supplies and require modeling of their dual-blood input function for accurate kinetic quantification. These aspects were not addressed in this study. Motion correction may also further improve the quantification performance. Implementation of these more complex models in total-body parametric imaging is a part of our ongoing effort.
The focus of this paper was mainly on the methodologic implementation for multiparametric imaging using compartmental modeling. Because of the page limit, the benefits of parametric images have not been directly compared with the SUV images (other than Supplemental Fig. 5) and with the parametric images determined from the linear Patlak plot (5,14,37). In general, multiparametric imaging with compartmental modeling not only generates Ki and V0 but can also provide other microkinetic parameters, including vb and K1 (Fig. 7), that go beyond what the Patlak method can offer. Exploring the potential benefits of these multiparametric images will be reported in future work.
This study had several other limitations. The temporal sampling rate for early dynamic scanning was relatively limited (10 s/frame) but was a reasonable choice based on our preliminary study as shown in Supplemental Figure 6. Within this context, the time delay td is mainly a method parameter that is coarsely estimated. Optimal sampling (trade-off between temporal resolution and voxel noise level) and the effect on kinetic quantification remain to be further investigated. In addition, the number of studied subjects was relatively small, and the study did not have a reference or outcome measure to evaluate the impact of kinetic quantification. The studied cancer type was also limited to genitourinary cancer. It will be worth evaluating the proposed kinetic modeling strategies in other cancers. Future studies will take these aspects into account.
CONCLUSION
We successfully conducted total-body PET multiparametric imaging using compartmental modeling for the dynamic 18F-FDG PET data acquired on the uEXPLORER system in both healthy subjects and cancer patients. TDC led to improved lesion time–activity curve fitting, physiologically more consistent vasculature in the vb image, and a generally higher Ki in lesions, especially when vb was large. Voxelwise model selection reduced artifacts in the Ki parametric images and led to clearer visualization of the myocardium. Both the modeling of time delay of the blood input function and model selection are necessary for accurate total-body multiparametric imaging.
DISCLOSURE
UC Davis has a revenue-sharing agreement with United Imaging Healthcare. Ramsey Badawi, Simon Cherry, and Guobao Wang are investigators on a research grant funded by United Imaging Healthcare. This work is supported in part by NIH grants K12 CA138464 and R01 CA206187, UC Cancer Research Coordinating Committee grant CRN-19-585008, and a pilot grant from the Cancer Therapeutics Program in the UC Davis Cancer Center (NIH grant P30CA093373). No other potential conflict of interest relevant to this article was reported.
KEY POINTS
QUESTION: Is it feasible to perform multiparametric imaging with compartmental modeling in total-body dynamic PET of cancer?
PERTINENT FINDINGS: Voxelwise modeling of the time delay of the blood input function and model selection are necessary for accurate total-body multiparametric imaging.
IMPLICATIONS FOR PATIENT CARE: Total-body dynamic PET can enable single-tracer multiparametric imaging, which may be further explored to improve tumor detection and treatment response assessment.
ACKNOWLEDGMENTS
We acknowledge the contributions of team members in the EXLORER Molecular Imaging Center, UC Davis.
Footnotes
Published online Nov. 18, 2021.
- © 2022 by the Society of Nuclear Medicine and Molecular Imaging.
REFERENCES
- Received for publication June 3, 2021.
- Accepted for publication November 8, 2021.
In this issue


Jump to section
Related Articles
Cited By...
- Quantitative Total-Body Imaging of Blood Flow with High-Temporal-Resolution Early Dynamic 18F-FDG PET Kinetic Modeling
- Is Long-Axial-Field-of-View PET/CT Cost-Effective? An International Health-Economic Analysis
- Total-Body Parametric Imaging Using Relative Patlak Plot
- Quantitative Accuracy Assessment of the NeuroEXPLORER for Diverse Imaging Applications: Moving Beyond Standard Evaluations
- Quantitative Total-Body Imaging of Blood Flow with High Temporal Resolution Early Dynamic 18F-Fluorodeoxyglucose PET Kinetic Modeling
- Total-Body Dynamic Imaging and Kinetic Modeling of [18F]F-AraG in Healthy Individuals and a Non-Small Cell Lung Cancer Patient Undergoing Anti-PD-1 Immunotherapy
- Quantitative PET imaging and modeling of molecular blood-brain barrier permeability
- Mapping 18F-FDG Kinetics Together with Patient-Specific Bootstrap Assessment of Uncertainties: An Illustration with Data from a PET/CT Scanner with a Long Axial Field of View
- High-Temporal-Resolution Kinetic Modeling of Lung Tumors with Dual-Blood Input Function Using Total-Body Dynamic PET
- Total-Body PET/CT Applications in Cardiovascular Diseases: A Perspective Document of the SNMMI Cardiovascular Council
- Total-body Dynamic Imaging and Kinetic Modeling of 18F-AraG in Healthy Individuals and a Non-Small Cell Lung Cancer Patient Undergoing Anti-PD-1 Immunotherapy
- Total-Body Perfusion Imaging with [11C]-Butanol
- Total-Body Multiparametric PET Quantification of 18F-FDG Delivery and Metabolism in the Study of Coronavirus Disease 2019 Recovery
- Quantitative Perfusion Imaging with Total-Body PET
- Facial Anonymization and Privacy Concerns in Total-Body PET/CT
- Fully Automated, Fast Motion Correction of Dynamic Whole-Body and Total-Body PET/CT Imaging Studies
- Facial Anonymization and Privacy Concerns in Total-Body PET/CT
- First Total-Body Kinetic Modeling and Parametric Imaging of Dynamic 68Ga-FAPI-04 PET in Pancreatic and Gastric Cancer
- High-Temporal-Resolution Lung Kinetic Modeling Using Total-Body Dynamic PET with Time-Delay and Dispersion Corrections
- Total-Body Multiparametric PET Quantification of 18F-FDG Delivery and Metabolism in the Study of COVID-19 Recovery
- Theranostic Digital Twins: An Indispensable Prerequisite for Personalized Cancer Care
- Exploring Vessel Wall Biology In Vivo by Ultrasensitive Total-Body PET
- Blanching Defects at Pressure Points: Observations from Dynamic Total-Body PET/CT Studies