


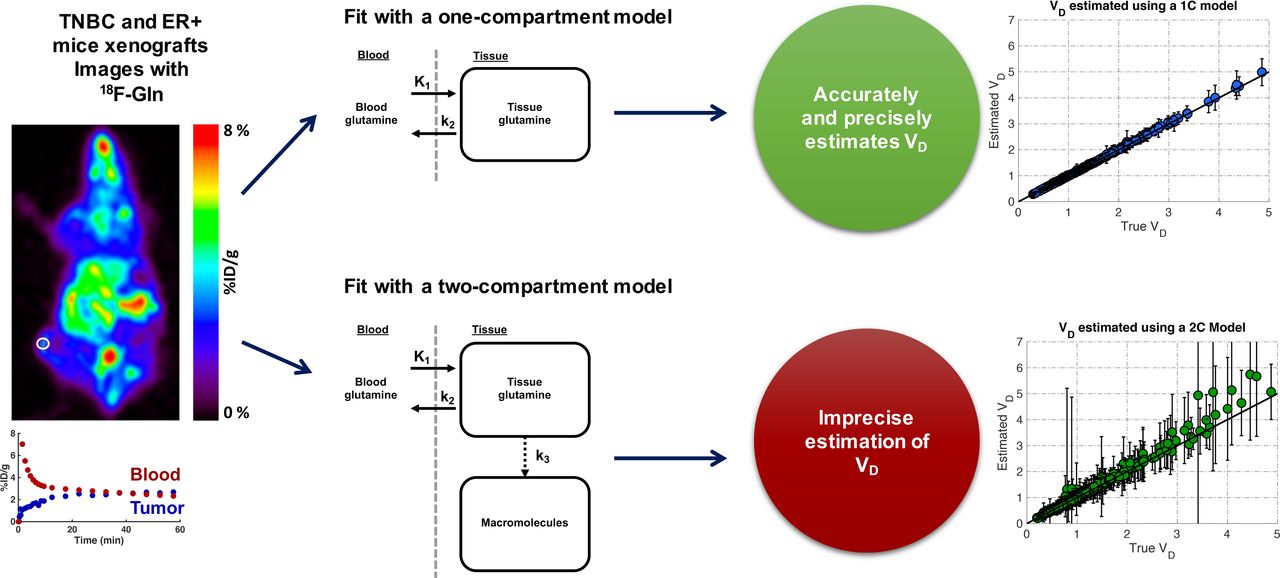
Visual Abstract

Abstract
The PET radiotracer 18F-(2S,4R)4-fluoroglutamine (18F-Gln) reflects glutamine transport and can be used to infer glutamine metabolism. Mouse xenograft studies have demonstrated that 18F-Gln uptake correlates directly with glutamine pool size and is inversely related to glutamine metabolism through the glutaminase enzyme. To provide a framework for the analysis of 18F-Gln-PET, we have examined 18F-Gln uptake kinetics in mouse models of breast cancer at baseline and after inhibition of glutaminase. We describe results of the preclinical analysis and computer simulations with the goal of model validation and performance assessment in anticipation of human breast cancer patient studies. Methods: Triple-negative breast cancer and receptor-positive xenografts were implanted in athymic mice. PET mouse imaging was performed at baseline and after treatment with a glutaminase inhibitor or a vehicle solution for 4 mouse groups. Dynamic PET images were obtained for 1 h beginning at the time of intravenous injection of 18F-Gln. Kinetic analysis and computer simulations were performed on representative time–activity curves, testing 1- and 2-compartment models to describe kinetics. Results: Dynamic imaging for 1 h captured blood and tumor time–activity curves indicative of largely reversible uptake of 18F-Gln in tumors. Consistent with this observation, a 2-compartment model indicated a relatively low estimate of the rate constant of tracer trapping, suggesting that the 1-compartment model is preferable. Logan plot graphical analysis demonstrated late linearity, supporting reversible kinetics and modeling with a single compartment. Analysis of the mouse data and simulations suggests that estimates of glutamine pool size, specifically the distribution volume (VD) for 18F-Gln, were more reliable using the 1-compartment reversible model than the 2-compartment irreversible model. Tumor-to-blood ratios, a more practical potential proxy of VD, correlated well with volume of distribution from single-compartment models and Logan analyses. Conclusion: Kinetic analysis of dynamic 18F-Gln-PET images demonstrated the ability to measure VD to estimate glutamine pool size, a key indicator of cellular glutamine metabolism, by both a 1-compartment model and Logan analysis. Changes in VD with glutaminase inhibition support the ability to assess response to glutamine metabolism-targeted therapy. Concordance of kinetic measures with tumor-to-blood ratios provides a clinically feasible approach to human imaging.
Malignant cells reprogram pathways of energy metabolism for accelerated growth (1), providing opportunities for imaging and targeted treatment. Dysregulated glucose metabolism has been leveraged for PET imaging with 18F-FDG, a tracer that has shown broad clinical applicability, in clinical oncologic imaging (2). A growing body of research suggests that dysregulated cellular metabolism extends beyond increased glucose consumption (3). Complementary to glucose, cancers may consume glutamine, the most abundant amino acid in plasma (4). Glutamine has numerous cellular metabolic fates. It can serve as an alternative energy substrate to glucose and as a source for building carbon skeletons and for nitrogen metabolism and biosynthesis (5–8). Numerous oncogenes and tumor suppressor genes have been implicated in the control of glutamine metabolism, most notably upregulation of the MYC oncogene (7).
Oncogene-dependent reliance on glutamine is a cancer vulnerability that has been exploited for therapeutic gain. The first step in glutaminolysis, conversion of glutamine to glutamate via the glutaminase enzyme, represents a prime target to inhibit the entire pathway, and several inhibitors have been developed (9–11). The glutaminase inhibitor CB-839 (Calithera Biosciences) has demonstrated antiproliferative activity in cell lines with accelerated glutamine metabolism, including triple-negative breast cancer (TNBC) cell lines (11,12). Sensitivity of breast cancer cell lines to CB-839 correlated with glutaminase activity and baseline glutamate-to-glutamine cellular concentration ratio, an indirect measure of glutaminase activity (11,12). The generally increased glutaminase activity and susceptibility of TNBC to CB-839 has supported clinical trials of this agent in patients with TNBC. In both treatment-naïve and pretreated cohorts, partial responses were achieved in some, but not all, patients (13,14). The variable activity of CB-839 between cell lines and nonuniform radiologic response in TNBC patients suggests a need for a biomarker to predict and monitor CB-839 efficacy. Cellular studies suggest that glutamine pool size at baseline and after CB-839 could be used as a surrogate to measure cellular glutamine metabolism (11,12) and, by extension, serve as a biomarker for targeted glutaminase therapy.
The PET radiotracer 18F-(2S,4R)4-fluoroglutamine (18F-Gln) has been developed as an in vivo measure of tumor glutamine metabolism (15), and uptake has been seen in a variety of cancers (16–19). 18F-Gln uses the same cellular transporters as native glutamine but is minimally metabolized (12,17,20). In cell uptake studies and early animal data, 18F-Gln generally washes out from cells over time, suggesting reversible transport (12,20). These properties make 18F-Gln an ideal radiotracer for measuring glutamine pool size. Indeed, 18F-Gln tumor-to-blood ratios demonstrated a strong positive correlation with glutamine pool size as measured by 1H MR spectroscopy (12). However, the optimal method for PET image analysis has not been established for this experimental radiotracer. In this paper, we model the kinetics of 18F-Gln observed in 2 breast cancer xenografts in mice, using both graphical and compartmental analyses to estimate parameters relevant to glutamine transport and cellular pool size. On the basis of our previously published preclinical data (12), we hypothesize that the distribution volume (VD) of 18F-Gln is a marker of tumor glutamine pool size that can be used to infer levels of tumor glutaminolysis. On the basis of the known biology of 18F-Gln, a 2-compartment model with a small amount of trapping should best model the data. However, we hypothesize that the rate of trapping will be difficult to estimate, which in turn will affect the estimation of glutamine pool size, the kinetic parameter of interest. For quantification, computer simulations were used to study the mathematic properties of the model, with the goal of building a foundation for quantitative interpretation of 18F-Gln in human studies.
MATERIALS AND METHODS
Mouse Models
Human breast cancer xenografts were established in mice as previously described (12). Briefly, xenografts from HCC1806 (TNBC cell line) and MCF-7 (receptor-positive breast cancer cell line) were implanted in NCR athymic nu/nu mice subcutaneously. The glutaminase activity in these cell lines has been shown to be high for the HCC1806 xenograft and low for the MCF-7 xenograft (11). Tumors were allowed to grow to an adequate size as measured by calipers on the skin before each PET scan (baseline, 270–1,057 mm3; after treatment, 210–1,374 mm3). The glutaminase inhibitor CB-839 was supplied through a generous material transfer agreement by Calithera Biosciences. CB-839 was dissolved in the vehicle solution and administered via oral gavage (200 mg/kg twice daily). Control mice received the same volume of vehicle solution without CB-839 added. Four to 6 doses of CB-839 or vehicle solution were administered. The posttreatment scan was performed at least 4 h after the last CB-839 administration to allow for adequate absorption. This short treatment course was given to ensure a metabolic effect of glutaminase inhibition without changes in overall tumor volume that could confound image interpretation, as documented in prior studies (12).
Six HCC1806 xenografts and 6 MCF-7 xenografts were analyzed. Each subtype includes 3 CB-839–treated and 3 vehicle solution–treated mice. Two mice were scanned at baseline and after vehicle solution treatment and then were subsequently treated with CB-839 and scanned. The post-vehicle treatment scan was used as the baseline for the post–CB-839 scan.
18F-Gln Radiosynthesis
18F-Gln was synthesized as previously described (15,21). Radiochemical purity was greater than 90%. Specific activity was greater than 4,847 MBq/mol; the detection limit was less than 5 μg/mL.
18F-Gln PET Studies
A dedicated small-animal PET scanner was used for all studies (A-PET, a prototype of the Philips Mosaic HP; Philips, Amsterdam, NE), with technical parameters and performance characteristics as detailed previously (22). The spatial resolution is 2.3 mm, and the 3-dimensional row-action maximum-likelihood algorithm (23) was used for reconstruction into 1 mm3 isotropic resolution. Images were decay-corrected; scatter and attenuation correction was not used, in view of the small size of a mouse. The mice were sedated during imaging via oxygen containing 1.5% isoflurane, inhaled through a nose cone at a rate of 1 L/min.
All mice were scanned using the following dynamic protocol. PET imaging was initiated immediately before a tail vein injection of 11.1–12.95 MBq (300–350 μCi) of 18F-Gln. The first 10 min of dynamic imaging was performed in list mode and parsed into 15 frames (6 × 10 s, 9 × 60 s). The remaining 50 min of PET data were collected in sinogram mode in 10 frames of 300 s each.
18F-Gln Imaging Analysis
MIM, version 6.7.10, was used to view PET images and draw volumes of interest (VOIs). To delineate VOIs for tumor time–activity curves, a search area was manually drawn on the last 5-min frame to include the tumor and exclude nearby structures with high physiologic uptake (e.g., liver). The location of the peak VOI found in MIM (i.e., a 16-voxel spheric VOI where the mean counts were maximized within the search area) was used to draw the VOI in MATLAB (The MathWorks), and time–activity curves were constructed from mean values in the VOI. This method of selecting the VOI was based on PERCIST (24) and adapted for mouse imaging while allowing us to exclude the photopenic centers of the tumors. Additionally, MATLAB appropriately weights voxels that are only partially covered by the spheric VOI. Time–activity curves were corrected for frame duration and scaled to units of percentage injected dose per gram as described in prior work by Zhou et al. (12). These measures were also used to calculate tumor-to-blood ratios.
Compartmental Model
A 2-compartment model with irreversible trapping and a single blood input was used (Fig. 1). K1 denotes the transport rate constant from blood to tissue. k2, the reverse of K1, represents the rate constant of reversible transport from the tissue compartment back to blood. Lastly, k3 represents the rate constant of tracer trapping, presumed to be due to the incorporation of tissue glutamine into macromolecules such as peptides. This model was based on observations that 18F-Gln is transported into and out of cells similarly to glutamine but is minimally metabolized; therefore, the metabolite 18F-glutamate is not included in the model, and the reversible compartment for 18F-Gln is considered to reflect the cellular glutamine pool size. The hypothesis underlying our model is therefore that 18F-Gln VD in the reversible compartment provides an estimate of cellular glutamine concentration, which is the desired marker of glutaminase activity and inhibition. There is a possibility that a small fraction of 18F-Gln is incorporated into macromolecules (12), indicating the need for a second compartment in the model and the parameter k3 to account for this minor effect. k3 is denoted with a dashed arrow in the model. In a 2-compartment model, the VD of the reversible compartment is  . For a single-compartment model (i.e., setting k3 = 0), the VD equation reverts to
  .
.

Proposed compartment model of 18F-Gln.
We previously noted some prior reports of 18F-Gln–to–18F-glutamate metabolism. Gas chromatography–mass spectroscopy cellular studies reported that minimal metabolism of 19F-glutamine was observed (17). 18F-glutamate (8%–9% of total activity) was seen in the supernatant of mouse and rat tumor extracts on high-performance liquid chromatography analysis at 1 h (20). An alternative compartment model has been proposed for 18F-Gln that hypothesizes significant metabolism of 18F-Gln to 18F-glutamate (19). Our prior studies on breast cancer mouse models demonstrated that at least 85% of the radioactivity in the supernatant of tumor tissue was in the form of 18F-Gln and that only 9%–14% of activity was from metabolites (12). Much of the 18F-glutamate may be related to blood metabolites that arise from degradative organs such as liver and kidney, as 82%–87% of blood radioactivity was in the form of 18F-Gln and less than 16% was from metabolites (12). We therefore consider alternative models that include the possibility of tumor tissue metabolism to 18F-glutamate as well as transport of 18F-glutamate as a blood metabolite to tissue (Supplemental Fig. 1; supplemental materials are available at http://jnm.snmjournals.org). However, since metabolism of 18F-Gln to 18F-glutamate appears to be minimal in most reported studies, we focus our analysis largely on the model illustrated in Figure 1.
Kinetic Parameter Estimation
The tumor and blood time–activity curves derived above were input into PMOD, version 3.7 (PMOD Technologies, LLC). Image-derived arterial input functions served as the input to the model for all analyses, and raw data obtained from image analysis were fit empirically to a linear function until the peak of the input curve. After the peak, a sum of 3 exponentials was fit to the data as implemented in PMOD to reduce input noise, as has been performed in several other similar studies (25). For compartmental analysis, model parameters were estimated using the Levenberg–Marquardt least-squares minimization algorithm as implemented in PMOD. Graphical analysis of blood and tumor time–activity curves was performed using Patlak and Logan analyses (26,27), also as implemented in PMOD. For Logan plot analysis, VD was estimated as the slope of the line of  versus
  , where Cplasma is the blood plasma TAC, Ctissue is the tumor TAC, and dt is the differential with respect to time.
Model Characterization: Sensitivity Function
To test the mathematic behavior of the model, we based our further analysis on idealized uptake curves from a representative TNBC mouse and a representative estrogen receptor–positive (ER+) mouse, each treated with CB-839. The Akaike information criterion as calculated by PMOD was used to compare compartmental models (28). To characterize the kinetic models and performance in parameter estimation, sensitivity functions were calculated for each parameter using PMOD. In addition, the parameter identifiability matrices were estimated to determine the ability to independently estimate parameters (K1, K1/k2, and k3) for the model (29).
Assessment of Parameter Estimation Performance Using Simulated Curves with Added Poisson Noise
To measure the precision and bias of estimated parameters, time–activity curves from each of the 2 representative mice were fit using a 1-compartment model, a reversible 2-compartment model, and an irreversible 2-compartment model in PMOD. Radioactive delay, frame duration, and decay were applied to the time–activity curves to calculate counts collected in the tumor, and Poisson noise was added to each datapoint to generate 1,000 noise realizations (λ= counts, σ ). These curves were fit in PMOD using the corresponding compartmental model to assess the robustness of kinetic parameter estimation.
We then extended the simulation to use measured kinetic parameters from all imaged mice. Parameters were input into Stella, a model integration program (version 1.9.1; ISEE Systems), to generate 250 time–activity curves for a 1-compartment model and an irreversible 2-compartment model. Poisson noise was added to these curves, as described above, to generate 100 noise realizations per curve, and all time–activity curves were fit in PMOD. Finally, to determine the effect of ignoring k3 on VD estimation, idealized curves from Stella were used to model a 2-compartment model with variable levels of trapping.
Statistical Analysis
Pearson correlation coefficients were calculated for pairwise comparisons between VD estimates for each model. R2 values were calculated to evaluate the fit of graphical analyses and the correlation between VD for different models and tumor-to-blood ratios.
RESULTS
Blood and Tissue Time–Activity Curves
Representative blood and tissue time–activity curves are shown in Figure 2, along with the final frame imaged. At baseline, TNBC xenografts with inherently high glutaminase activity demonstrated low 18F-Gln uptake compared with an ER+ xenograft with inherently low glutaminase activity (Fig. 2). On glutaminase inhibition with CB-839, there was increased radiotracer uptake in the TNBC tumor reflecting an increase in glutamine pool size, which was expected with the inhibition of glutaminolysis. In the ER+ tumor xenograft, only a minimal increase in radiotracer uptake was observed after glutaminase inhibition, reflecting known low glutaminase activity in this breast cancer subtype.

Static images of TNBC and ER+ tumor xenografts and response to glutaminase inhibition (post–CB-839 image is right-hand image of each pair). Tumor and blood time–activity curves demonstrate adequate temporal sampling of radiotracer uptake over time. Spheric VOIs used are drawn on each tumor. %ID = percentage injected dose.
Compartmental Analysis of Xenograft Data
The 2 representative mice with typical time–activity curves (Fig. 2) were then selected for mathematic investigation of radiotracer uptake. Both a single-compartment model and a double-compartment model with trapping were investigated. The 1-compartment fit is shown in Figures 3A and 3C, and the 2-compartment fit is shown in Figures 3B and 3D. The blood fraction was fixed at 5% for these models and not estimated. A blood fraction of 5% is within the range of estimated values from a prior mouse xenograft study (30) and similar to the 4% blood fraction used in prior studies of 18F-FDG in locally advanced breast cancer in humans (31).

Single-compartment model fit (A and C) and double-compartment model fit (B and D) of same representative time–activity curves for ER+ and TNBC mice before treatment. Double-compartment fit separately shows time course of both reversible and trapped compartments. %ID = percentage injected dose.
The single-compartment model for the ER+ tumor underestimates 18F-Gln uptake at later time points, unlike the 2-compartment model, which includes the possibility of retained tracer in a nonreversible compartment. The 2-compartment model estimates k3 at 0/min for the TNBC mouse and 0.006/min for the ER+ mouse data, for which 27% of the total radioactivity is estimated to be contained in the nonreversible compartment at 60 min. This estimate is higher than the 10% ± 4% of radiotracer incorporated into the pellet versus supernatant of tumor extracts in prior work (12), perhaps because of the difficulty of estimating a small k3, as supported by simulation data below. This finding, and the relatively low values of k3 found across all animals studied, suggest that such a term could be omitted.
The Akaike information criterion of the TNBC mouse data fit using a single-compartment model was 60.9, more favorable than the 63.5 found using a 2-compartment model; the penalty of fitting an extra term in the 2-compartment model more than offset the slightly improved goodness of fit by the 2-compartment model. The Akaike information criteria for the ER+ tumor data fit using a single- and double-compartment model were nearly equal, at 34.4 and 33.8, respectively, noting the discrepancy between k3 estimates for the 2-compartment model for ER+ tumors and measured data as described above. The benefits of omitting the second compartment are further supported by examining the accuracy and precision estimates of estimating k3 as described below.
Graphical Analysis of Xenograft Data
Analyses using Patlak and Logan graphical approaches are shown in Figure 4. The Logan plots (Figs. 4A and 4C) demonstrated late linearity, consistent with minimal radiotracer trapping and largely reversible tracer exchange between the tumor and the blood. R2 values for the fits of the TNBC and ER+ mouse data were 0.997 and 0.999, respectively, reflecting good-quality linear fits. In contrast, the Patlak plot demonstrates poor fits, arguing against irreversible radiotracer trapping; an R2 of 0.91 and 0.83 for the TNBC and ER+ mouse data, respectively, was obtained using fewer data points than the Logan fit. Graphical analyses support the use of the VD as calculated by the slope of the best fit line in the Logan graphical analysis as a measure of glutamine pool size. The applicability of Logan analysis is consistent with the suitable fits of the single-compartment model.

Logan graphical analysis (A and C) and Patlak graphical analysis (B and D) of same representative time–activity curves for ER+ and TNBC mice before treatment.
Model Characterization Sensitivity and Identifiability Analysis
The sensitivity function for the 2 mice fit using an irreversible 2-compartment model (Supplemental Fig. 2) suggests that both models are most sensitive to K1 early after injection, more sensitive to K1/k2 at intermediate time points, and most sensitive to k3 at late time points. The identifiability matrix (Supplemental Table 1) for the 2-compartment model suggests that K1 and K1/k2 can be estimated independently but that K1/k2 and k3 have a high covariance (−0.97) and cannot be estimated independently, suggesting that errors in k3 estimation will propagate into VD, and supports the exclusion of k3 in the model.
Effect of Glutaminase Therapy on Volume of Distribution and Tumor-to-Blood Ratios
After glutaminase inhibition, VD increased in TNBC xenografts, but not consistently in MCF-7 xenografts or vehicle solution–treated TNBC tumors (Fig. 5). Of the 4 TNBC tumors treated with CB-839, 3 had an increase in VD (18%, 42%, and 89%), whereas 1 had a decrease after treatment. This study was not powered to detect an increase in VD after glutaminase inhibition in any subgroup. One of the 4 mice had a baseline VD markedly elevated above the others, indicative of less glutaminolysis and atypical of TNBC. Previously, we showed a 4.3-fold increase in glutamine pool size by MRS in TNBC xenografts after glutaminase inhibition. Given a 2.5-fold increase in plasma glutamine concentration with glutaminase inhibition, an increase in tumor-to-blood ratio and a VD of 4.3/2.5 = 1.7 would be expected (12). Additionally, variability in PET signal response to CB-839 supports differential glutaminase inhibition in breast cancer subtypes and supports the need for a biomarker to measure glutamine metabolism.

Changes in volume of distribution, as estimated by a 1-compartment model, for both TNBC and ER+ mice who underwent treatment of tumor xenografts with GLS inhibitor (left) or placebo (right). VEH = vehicle solution.
Simulation of Parameter Estimation
Simulations (Fig. 6A) revealed that the precision and accuracy in recovering the true VD was better for the 1-compartment model than for either 2-compartment model. The reversible 2-compartment model (Supplemental Fig. 1B) cannot accurately or precisely estimate VD and was not further studied. The average bias in the median VD and the %SD of the interquartile range (Supplemental Eq. 1) were markedly improved for the 1-compartment model compared with the irreversible 2-compartment model (bias, <0.5% vs. 1.6–12.9%; %SD, 7.73%–20.2% vs. 19.4%–54.3%), demonstrating the robustness of the 1-compartment model in contrast to the poor performance of the 2-compartment model.

(A) Comparison of estimation of volume of distribution for 1- and 2-compartment models after adding Poisson noise to time–activity curves and fitting each noise realization with corresponding model. Boxes reflects 25th, 50th, and 75th percentiles of data, and whiskers are extent of data after outlier removal (1.5 × interquartile range, where interquartile range = 75th–25th percentiles). Diamonds show true VD before noise is added to fit curve. True value for ER+ mouse before treatment is essentially infinite because of near-zero k4. (B) Comparison of true vs. estimated VD for 1- and 2-compartment models with trapping, where diagonal line is line of identity. 1C = 1-compartment; 2C = 2-compartment.
Simulations that used kinetic parameters from all mice (Fig. 6B) clearly demonstrated more precise recovery of the true VD when estimated using a 1-compartment model, in agreement with simulations in Figure 6A. The average %SD, calculated as %SD = SD/mean for each data point, was 9.7% ± 3.4% for the 1-compartment model and 33% ± 30% for the 2-compartment model with trapping.
The accuracy and precision of the individual recovered kinetic parameters (K1 and k3) in the simulations described above are shown in Supplemental Figure 3. K1 was better estimated using the 1-compartment model. k3 estimation with an irreversible 2-compartment model had a large bias and %SD, resulting in overestimation of activity in the trapped compartment (Fig. 3D). Additionally, errors in k3 propagated to errors in VD.
Comparison of VD and Tumor-to-Blood Ratios
For all imaged mice, VD estimates were compared with tumor-to-blood ratios (Fig. 7), which serve as a proxy of VD obtained from static images, using the final time point. Strong correlations were seen between tumor-to-blood ratios versus VD estimated by Logan plots or a single-compartment model but not a double-compartment model. This finding underscores the inaccuracy of using a 2-compartment model to estimate VD and thus glutamine pool size.

Comparison of volume of distribution of 18F-Gln by compartmental and graphical analysis, as well as tumor-to-blood ratios. 1C = 1-compartment; 2C = 2-compartment.
Alternative Compartmental Models
We considered alternative compartmental models (Supplemental Figs. 1B and 1C) that included the possibility of reversible 18F-Gln metabolism to 18F-glutamate in tumor tissue. These models, specifically model 1B, were able to fit the data well, but nearly 50% of fits resulted in a near-zero k4 or k3, or a k4 so large (∼8 min−1) that the ratio of k3/k4, the VD of 18F-glutamate, is essentially zero. The other half of fits resulted in rates of washout from the reversible compartment (k4 or k4 + k5) that were comparable in magnitude to the k3 metabolism rate (i.e., k3/k4 = 1.06 ± 1.08). This implies a small VD for 18F-glutamate comparable to 18F-Gln; however, in the glutaminolytic TNBC cells, 18F-glutamate would be retained in a large intracellular pool of glutamate in cells actively metabolizing glutamine to glutamate (11,32). Liquid chromatography–tandem mass spectrometry studies on HCC-1806 TNBC tumors demonstrated a tumor glutamate concentration approximately 5 times greater than the tumor glutamine concentration (11), implying that the VD of glutamate (i.e., k3/k4) should be 5 times the VD of glutamine (5–10 mL/cm3, given a glutamine VD of 1–2 mL/cm3). Thus, models that include finite tumor metabolism of 18F-Gln to 18F-glutamate do not appear to fit the observed tracer kinetic data in the mouse models and the known high concentration of glutamate in glutaminolytic cells.
We also tested a model that included transport of 18F-glutamate, as a labeled metabolite in the blood, to tumor tissue (Supplemental Fig. 1D). We divided the arterial input curve into principal components of 18F-Gln and 18F-Glu based on sampled blood data (12). We estimated K1′ and k2′ (glutamate kinetic parameters) at 10% of their respective glutamine counterparts (K1 and k2). As shown in Supplemental Figure 4, the contribution of PET signal from tissue 18F-Glu was largely linear over time and accounted for a small component of the total PET signal at later time points. This small 18F-Glu component (8%) could account for underestimates of the model curve of a single-compartment model at later time points. The relatively small contribution of glutamate suggests that it can likely be ignored, particularly at earlier time points.
DISCUSSION
Our study provides a theoretic framework for kinetic analysis of 18F-Gln in mouse xenografts of human breast cancer. Previous work showed a linear relationship between 18F-Gln tumor-to-blood ratios and tumor glutamine concentration and demonstrated an increase in glutamine pool size after targeted glutaminase inhibition of TNBC mice but not ER+ mice (12). On the basis of radiotracer biology, a 2-compartment irreversible model should fit the data well; however, the small value of k3 is difficult to estimate accurately and leads to spurious estimates of VD of 18F-Gln. Thus, a 1-compartment model is favored and correlates well with changes in glutamine pool size after glutaminase inhibition. The distinctive kinetics of 18F-Gln necessitate specific model and image analysis approaches distinct from those used for other cancer tracers such as 18F-FDG (33), and this paper establishes a new imaging paradigm for this novel radiotracer that is now being used in several clinical trials.
We first demonstrated that dynamic time–activity curves and the images recapitulated the previously described patterns of uptake (12). That is, 18F-Gln uptake late after injection was lower in TNBC than ER+ models, inversely related to glutaminase activity in those cell lines (11). 18F-Gln uptake increased in the highly glutaminolytic tumor (TNBC) after glutaminase inhibition but not in the low-glutaminase ER+ lines (12). This behavior was accurately captured by the 18F-Gln VD, which estimates the cellular glutamine pool size, supporting the utility of this measure as a pharmacodynamic measure of glutaminase inhibitor therapy.
On the basis of the biochemistry of glutamine and the imaging analog, 18F-Gln, a 1-compartment reversible model and a 2-compartment irreversible model were investigated in 2 representative mice. The second compartment in the 2-compartment model represents incorporation of 18F-Gln into macromolecules, likely peptides. The 2-compartment model overestimated the percentage of radiotracer incorporated into macromolecules in an ER+ mouse compared with data from prior tumor extract studies (12), suggesting error in estimating k3. The TNBC model, with inherently high glutaminase expression, had negligible trapping. Sensitivity analysis of the 2-tissue-compartment model with irreversible trapping demonstrated relative insensitivity of the model to k3, other than late after injection, suggesting that this parameter could not be estimated accurately (Supplemental Fig. 2). Simulations provided additional support for omitting k3 from the final model. Graphical analysis supported the use of a reversible model, in this case the single-compartment model. Thus, analysis of xenograft model data, model performance characteristics, and model simulations support the use of a 1-compartment model to estimate the key 18F-Gln parameter, VD.
The strong correlation between tumor-to-blood ratios and VD of a single-compartment model and slope of a Logan plot (Fig. 7) suggests that static protocols could be considered for human imaging and should be a focus of early human studies. However, ignoring tracer trapping in the 1-compartment model could bias VD estimation for modest levels of trapping, as shown in simulation without added noise (Supplemental Fig. 5). This bias can be mitigated by imaging at earlier time points (e.g., 20–30 min), which should be examined in human imaging studies.
Our proposed model and results are consistent with other preclinical and early clinical studies. Schulte et al. showed that the pharmacologic inhibition of glutamine transport in a TNBC mouse model resulted in reduced early uptake and decreased late retention, with kinetics consistent with our 1-compartment model (34). 18F-Gln-PET has been explored as a measure of glutamine metabolism in early clinical trials. 18F-Gln uptake was seen in a variety of cancers: paraganglioma, breast, colon, lung, pancreas, neuroendocrine, glioma, and thyroid (16–19). Downsloping time–activity curves in these human tumors support reversible kinetics. Preliminary analysis of a patient from this trial demonstrated the plausibility of a 1-compartment model based on good agreement of VD between the Logan fit and the 1-compartment fit (Supplemental Fig. 6). The application of the framework established here in mouse xenografts can be applied to human 18F-Gln imaging. Although the biology in human tumors may vary from the mouse xenografts and warrants use of a slightly altered kinetic model, the methodologies developed in this paper will permit testing of these hypotheses (16). Further analysis of human studies is warranted.
We examined alternative compartment models that included the possibility of tumor metabolism of 18F-Gln to 18F-glutamate suggested by others (19), based on observation of defluorination of 18F-Gln in human studies (16) and some enzymatic studies demonstrating metabolism of 18F-Gln to 18F-glutamate (35). Although these models were able to fit our mouse data, the estimated parameters grossly underestimated the size of the tumor glutamate pool, as measured in prior studies, including our studies in TNBC mouse models (11,12). It is possible that kinetics differ in humans, although our early human data show a good fit for our 1-compartment model (Supplemental Fig. 6). We also examined the small impact of labeled metabolites, which may explain the inability of the 1-compartment model to fit the later portion of some observed curves. This impact on the estimate of 18F-Gln VD appears to be small but should be studied carefully in human data.
There are several limitations to broad application of this small-animal imaging study. Although 2 cell lines were used in this study, we believe these results are generalizable to other cell lines given the mechanism of uptake and lack of metabolism of the radiotracer. Subcutaneously implanted tumors may have intrinsic biologic properties different from those of human breast tumors, precluding direct translation. For example, cellularity is not a factor in mouse xenografts but may complicate the interpretation of VD in humans, possibly necessitating a normalization factor. Future studies using other cell lines (especially TNBC), mouse models, and human imaging should address these limitations.
VOI analysis of mouse images varies greatly across studies, but our method, which was based on PERCIST, was designed to reproducibly draw a spheric VOI over the tumor. Our method ensured that the search area would not erroneously cover the mouse liver or knee and that the photopenic center of the tumor would not be included in the VOI. Time–activity curves were then scaled to percentage injected dose per gram using the total counts in the final image, as opposed to the total injected dose. Although this method is not standard, it does not affect our results since both the blood and the tumor time–activity curves are image-derived and thus similarly scaled for kinetic analysis. Additionally, we fit the image-derived blood time–activity curve to a triexponential to reduce noise, as is typical for human imaging, as opposed to direct blood sampling of the mouse. The image-derived blood curve is more representative of human imaging and better represents estimation of VD in human trials.
Mouse imaging estimates of time–activity curves are less accurate than human time–activity curves, partly because of differences in uptake, especially for estimates of the blood input function. An image-derived blood input function was used without metabolite correction. Minimal metabolism of 18F-Gln in the blood supports such an input function (12), though others have used corrected input functions (19,36). Peripheral metabolism of 18F-Gln to 18F-glutamate may further confound the interpretation of 18F-Gln uptake in tumors, but as noted, the effect appears to be small and may be able to be ignored, particularly at earlier time points. Finally, our modeling work is specific to 18F-Gln and cannot be applied to 11C-Gln, which has a much more complex kinetic model and is under preliminary investigation (37).
Our compartment model assumed no tumor metabolism of 18F-Gln to 18F-glutamate, based on our prior mouse model studies (12). However, on the basis of the defluorination of 18F-Gln observed in human studies (16), as well as some enzymatic studies demonstrating metabolism of 18F-Gln to 18F-glutamate (36), other groups have hypothesized that there might be tumor metabolism of 18F-Gln by glutaminase and proposed a 2-compartment reversible model (Supplemental Fig. 1B) (19). However, parameter estimates obtained from the model with 2 reversible compartments were not compatible with the large glutamate pool size observed in glutaminolytic tumors by a variety of methods (11,12,32). Rapid metabolism of 18F-glutamate by alanine aminotransferase with resultant defluorination and efflux of the label from the tumor cell (Supplemental Fig. 1C) (19,35) also yields estimates of glutamate pool size that are much smaller than reported and therefore thought to be a less likely explanation for the observed kinetics.
CONCLUSION
This work found 18F-Gln uptake in breast xenograft models to be largely reversible, consistent with the hypothesis that 18F-Gln exchanges with the intracellular glutamine pool. Using a combination of traditional modeling and simulations, we determined that a 1-compartment model best estimated VD and that robust estimates of VD can also be found using Logan graphical analysis or tumor-to-blood ratios at 60 min after injection. This study establishes a theoretic framework for analyzing further human 18F-Gln-PET imaging studies, which have recently begun. The pairing of 18F-Gln with glutaminase inhibitors to select and monitor oncologic patients represents a prime opportunity to use molecular imaging to guide metabolically targeted cancer therapy.
DISCLOSURE
Work presented here is partially supported by the following grants: NIH KL2-TR001879, NIH R01-CA211337, Susan G. Komen SAC130060, and NIH R21-CA198563. Calithera provided CB-839. No other potential conflict of interest relevant to this article was reported.
KEY POINTS
QUESTION: What kinetic model best estimates the uptake of 18F-Gln dynamic data and captures relevant biology?
PERTINENT FINDINGS: A 1-compartment model accurately and precisely estimated the VD of 18F-Gln, a proxy for glutamine pool size. Other models were less robust and did not reflect known glutamine biology.
IMPLICATIONS FOR PATIENT CARE: The VD from a 1-compartment model captures relevant glutamine biology and will be studied in ongoing clinical studies of 18F-Gln in human breast cancer.
ACKNOWLEDGMENTS
We thank Eric Blankmeyer for assisting with animal imaging and Tiffany Rodriguez for analyzing the human imaging study.
Footnotes
Published online December 4, 2020.
- © 2021 by the Society of Nuclear Medicine and Molecular Imaging.
REFERENCES
- Received for publication June 5, 2020.
- Accepted for publication October 19, 2020.


Jump to section
Related Articles
Cited By...
- 18F-Fluciclovine PET Imaging of Glutaminase Inhibition in Breast Cancer Models
- First-in-Human PET Imaging and Estimated Radiation Dosimetry of L-[5-11C]-Glutamine in Patients with Metastatic Colorectal Cancer
- Kinetic and Static Analysis of Poly-(Adenosine Diphosphate-Ribose) Polymerase-1-Targeted 18F-Fluorthanatrace PET Images of Ovarian Cancer