


Abstract
We evaluated the kinetics of 18F-sodium fluoride (NaF) and reassessed the recommended dose, optimal uptake period, and reproducibility using a current-generation PET/CT scanner. Methods: In this prospective study, 73 patients (31 patients with multiple myeloma or myeloma precursor disease and 42 with prostate cancer) were injected with a mean administered dose of 141 MBq of 18F-NaF. Sixty patients underwent 3 sequential sessions of 3-dimensional PET/CT of the torso beginning approximately 15 min after 18F-NaF injection, followed by whole-body 3-dimensional PET/CT at 2 h. The remaining 13 prostate cancer patients were imaged only at 2 and 3 h after injection. Twenty-one prostate cancer patients underwent repeated baseline studies (mean interval, 5.9 d) to evaluate reproducibility. Results: The measured effective dose was 0.017 mSv/MBq, with the urinary bladder, osteogenic cells, and red marrow receiving the highest doses at 0.080, 0.077, and 0.028 mGy/MBq, respectively. Visual analysis showed that uptake in both normal and abnormal bone increased with time; however, the rate of increase decreased with time. A semiautomated workflow provided objective uptake parameters, including the mean standardized uptake value of all pixels within bone with SUVs greater than 10 and the average of the mean SUV of all malignant lesions identified by the algorithm. The values of these parameters for the images beginning at approximately 15 min and approximately 35 min were significantly different (0.3% change per minute). Differences between the later imaging time points were not significant (P < 0.01). Repeated baseline studies showed high intraclass correlations (>0.9) and relatively low critical percentage change (the value above which a change can be considered real) for these parameters. The tumor–to–normal bone ratio, based on the maximum SUV of identified malignant lesions, decreased with time; however, this difference was small, estimated at approximately 0.16%/min in the first hour. Conclusion: 18F-NaF PET/CT images obtained with modest radiation exposures can result in highly reproducible imaging parameters. Although the tumor–to–normal bone ratio decreases slightly with time, the high temporal dependence during uptake periods less than 30 min may limit accurate quantitation. An uptake period of 60 ± 30 min has limited temporal dependence while maintaining a high tumor–to–normal bone ratio.
There is renewed clinical interest in the use of sodium fluoride (18F-NaF) as a bone scanning agent. Reasons for this resurgence include recent periodic worldwide shortages of 99mTc (needed for conventional bone scanning agents) and the improved sensitivity and quantitative potential of 18F-NaF PET/CT, compared with 99mTc-based conventional bone scans. The current dosing regimens, uptake periods, and reproducibility measurements are founded on decades-old data, based on older PET equipment. There is a critical need to reassess these recommendations in light of current advances in technology and the added drive to develop quantitative imaging to monitor patient response to therapy. Initial uptake of NaF is dependent on blood flow and exposed bone surface area (1). The diffusion of NaF into the bone leads to a slow exchange of fluoride ions with hydroxide ions of the hydroxyapatite crystals, eventually forming fluoroapatite, a process that begins rapidly but takes many days to weeks to complete. Given the relatively short half-life of 18F-NaF, only the early stages of this process, namely blood flow and the entrance of fluoride ions into the bound water shell initiating integration into the bone, are imaged. With its rapid bone uptake and blood clearance, the axial skeleton can be visualized less than an hour after injection. However, understanding the kinetics of this uptake is important for image quantitation and reproducibility. If scanning is performed during a period of rapid bone uptake, it will have a higher temporal dependence than if it is performed during slow or stable uptake. The uptake plateau has been previously studied, using less sensitive and lower-resolution scanners, with inconsistent results, ranging from 1 to 5h after injection (1,2), and thus, there is a need to reconsider dose, uptake kinetics, and reproducibility in light of modern technology.
We evaluated the kinetics of 18F-NaF using a current-generation PET/CT scanner to reassess the recommended dose of 18F-NaF, characterize the uptake period, and maximize its potential for quantitation.
MATERIALS AND METHODS
Patient Population and Study Design
This protocol was approved by the National Cancer Institute Institutional Review Board and the Radiation Safety Committee of the National Institutes of Health, and all patients gave written informed consent to participate. In this prospective study, 73 patients, including 31 with multiple myeloma or myeloma precursor disease and 42 with prostate cancer (with or without known bone involvement), were injected with 111–203 MBq (mean, 141 MBq) of 18F-NaF. Approximately 15 min after injection, all 31 of the myeloma patients and 29 of the prostate cancer patients underwent 3 sequential 3-dimensional PET/CT scans of the torso (mid ear to upper thigh) over 60 min, followed by whole-body (vertex to toes) 3-dimensional PET/CT at 2 h after intravenous injection. The remaining 13 prostate cancer patients were imaged only at 2 and 3 h after injection. A subset of 21 prostate cancer patients underwent duplicate baseline scanning within a 2-wk period (mean, 5.9 d; range, 2–9 d) to evaluate reproducibility. Imaging was performed on a Gemini TF system (Philips Health Care). The average patient age was 65 y (age range, 45–80 y). For simplicity, we will refer to the imaging time points as 1, 2, 3, 4, and 5, corresponding to the mean postinjection times (in minutes, including all patients) of 12.4 ± 2.9, 34.9 ± 3.7, 57.6 ± 4.8, 123.5 ± 11.2, and 189 ± 16.7 (mean ± SD). Low-dose CT transmission scans were obtained (120 kVp, 60 mAs, 0.75-s rotation time, 1.438 pitch, and axial slice thickness of 5 mm) for attenuation correction and localization. Emission PET images were obtained at 2 min per bed position, with 22 slices in bed overlap. The PET images were reconstructed using the Gemini TF’s (3) default reconstruction algorithm (BLOB-OS-TF: a 3-dimensional ordered-subset iterative time-of-flight reconstruction technique using 3 iterations, 33 subsets, and a voxel size of 4 × 4 × 4 mm). Imaging review and analysis were performed using MIM 5.2 (MIM Software).
Dosimetry
Radiation dosimetry estimates were calculated from 4-time-point torso, non–decay-corrected PET data from 8 representative patients (4 from the prostate group and 4 from the myeloma group) using OLINDA 1.1 (Vanderbilt University) (4). Representative volumes of interest (VOIs) were drawn in areas of homogeneous uptake in the visualized solid organs and left atrium (used as a blood-pool surrogate). The data for bone and bone marrow were taken from a small, homogeneous VOI in the center of a normal vertebra. The time–activity curves were integrated over time, resulting in concentration integrals for each solid organ. These were multiplied by the corresponding standard man organ mass and the density of the respective tissues. These were normalized to the injected activity, resulting in the number of disintegrations per injected activity, which, having units of time, is often referred to as the residence time. VOIs were drawn encompassing all activity within the gut (stomach and intestines), the urinary bladder, and the entire field of view. The fractional urinary excretion was calculated to be the area under the urinary bladder time–activity curve divided by the total activity in a whole-body contour created on the initial 3 serial torso images (the patient remained on the table and without voiding during this period). Renal clearance half-time was taken to be the whole-body clearance over the same time frame. The voiding bladder model (using a 4-h void time) in OLINDA 1.1 was used. The exclusion of the lower extremities from this calculation likely resulted in a small overestimation of urinary excretion, potentially artifactually increasing the bladder dose estimate and slightly decreasing the bone and bone marrow dose. The fraction of activity in the gut was calculated similarly and used as the input for the International Commission on Radiological Protection (ICRP) gastrointestinal tract model (5).
Image Analysis
A semiautomated workflow was created using MIM 5.2 to enable bone segmentation on CT images, followed by lesion thresholding based on standardized uptake value (SUV). All SUVs reported are based on body weight. The parameters of this analysis are arbitrary and are used to serve as the basis for a standardized comparison of images at each time point. Specifically, bones were segmented on the CT using a threshold of more than 150 Hounsfield units. The raw bone VOI was then cleaned, removing all noncontiguous fragments less than 100 mL. The resultant VOI was transformed to the PET images, and an SUV threshold of 10 was applied (i.e., all pixels with SUV ≥ 10 were included in the VOI). Encroachment of the bladder on the pelvic bones was manually removed. The volume and mean SUV were recorded for this SUV10 thresholded VOI. This VOI was then split into individual components, and all individual volumes less than 3.4 mL (likely noise) were removed from the analysis. All images were evaluated by experienced nuclear medicine physicians. Malignant foci, diagnosed by location, distribution, and correlative imaging, were identified. The mean SUV of a VOI located within noninvolved bone (a vertebral body when available) was taken to represent normal bone background. The parameters used in this analysis included the mean SUV of a VOI, including all bony areas with SUV ≥ 10 (SUV10mean); the total bone volume with SUV ≥ 10 (SUV10vol); the total 18F-NaF bone activity with SUV ≥ 10 (SUV10act), defined as the product of the SUV10mean and SUV10vol; the average SUV10mean of all malignant lesions with SUV greater than 10 (mSUV10mean); the SUV10max of all malignant lesions with SUV ≥ 10 (mSUV10max); the total 18F-NaF activity (mSUV10act) in all of the malignant lesions with SUV ≥ 10 (an estimate of total metastatic burden), defined as the sum of the 18F-NaF activity in all of the bone lesions classified as malignant; and the normalization of mSUV10max and mSUV10act to normal bone background (mSUV10max:bkg and mSUV10act:bkg). Time–activity curves for each parameter were created. A listing of the parameter abbreviations used is included in Table 1.
Definition of PET Parameters
Statistical Analysis
Because of the skewed distribution of each imaging parameter response, all the statistical analyses were performed on natural log-transformed data. Imaging data from a single baseline study in 42 patients with prostate cancer were used to assess the uptake kinetics of 18F-NaF. The paired t test was used to test the mean difference of SUV (log scale) at the same location on 2 consecutive images. The percentage rate of change per minute was calculated at each time point. Because of an insufficient number of malignant lesions identified at time point 5, a comparison between imaging time points 4 and 5 for malignant uptake parameters was not performed. A similar analysis was performed for the myeloma group (n = 31).
A subset of prostate cancer patients (n = 21) underwent 2 baseline imaging sessions. Each imaging parameter was measured at each imaging time and was fitted to a variance component model (6), which decomposed the total source variation into 2 components: 1 attributable to individual sample (patient-to-patient variation) and the other attributable to repeated imaging in each patient. The 2 variance components, denoted by τ2 (patient–patient variation [interpatient reproducibility]) and σ2 (variation due to repeated imaging [intrapatient reproducibility]), were used to assess the reproducibility of each imaging parameter at each imaging time point. Intraclass correlation (ICC) (7,8), defined as
For the prostate cancer patients who underwent repeated baseline studies, the critical percentage difference (CPD) was calculated for each parameter at each imaging time. CPD is the maximal acceptable difference of SUV of 2 repeats measured at the same imaging time. Differences in SUV larger than the CPD are considered significant—that is, not due to noise. CPD is defined as
RESULTS
Biodistribution and Dosimetry
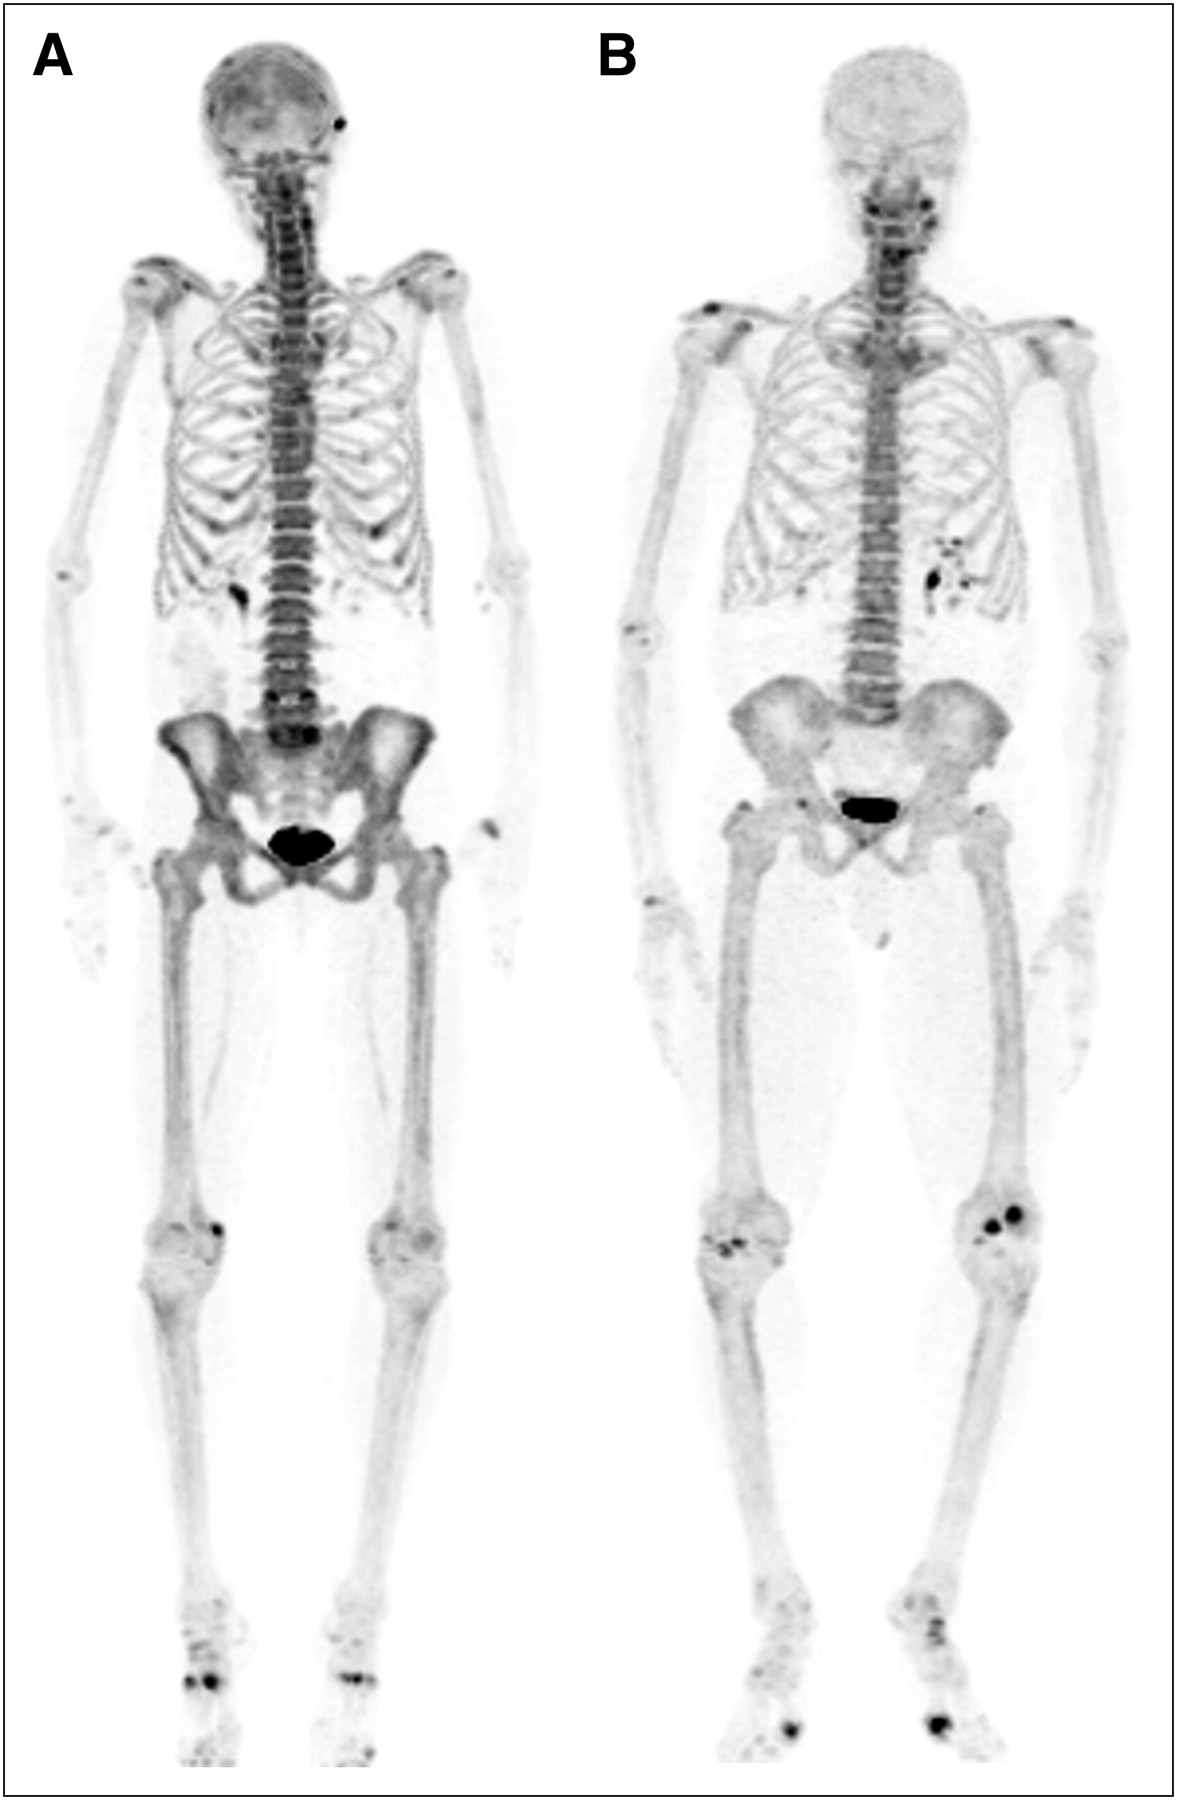
The small amount of administered 18F-NaF dose, 111–185 MBq, and modest increase in scan time per bed position (to 2 min), was sufficient to provide diagnostic PET images (Fig. 1). For illustration, the background (muscle) mean SUV plus 2 SDs and normal bone mean SUV minus 2 SDs for a myeloma patient injected with 192 MBq and a prostate cancer patient injected with 114 MBq are presented in Table 2. The resultant normal bone–to–background ratios were high: 17.6 and 11.7 for the myeloma and prostate patients, respectively.
Comparison of Bone-to-Background Uptake with Respect to Injected Dose

(A) Whole-body coronal maximum-intensity-projection image of myeloma patient who received 188.7 MBq (5.2 mCi) of 18F-NaF. (B) Whole-body coronal maximum-intensity-projection image of prostate cancer patient who received 118.4 MBq (3.1 mCi) of 18F-NaF. Both patients weighed 73 kg and were imaged at 2 h after injection. Images are scaled equally. Although overall uptake is higher in myeloma patient, abnormal foci of uptake are readily seen on images of both patients.
Most of the injected dose localized within the bones (Figs. 1 and 2). On average, 15.3% ± 4.9% of the whole-body activity was excreted into the urinary bladder. The mean ± SD biologic urinary extraction half-life was 1.37 ± 0.01 h. The number of disintegrations per injected activity (residence time) for select organs are included in Table 3. The estimated effective dose (ED) was 0.017 mSv/MBq, with the following organs receiving the highest doses: urinary bladder (0.080 mGy/MBq), the osteogenic cells (0.077 mGy/MBq), and the red bone marrow (0.028 mGy/MBq) (Table 4).
Listing of Mean Cumulative Activity per Injected Dose (Residence Times) for Selected Organs
Human Radiation Dosimetry Estimates for Select Organs
Comparison of Multiple Uptake Parameters at Multiple Imaging Time Points in Patients with Prostate Cancer
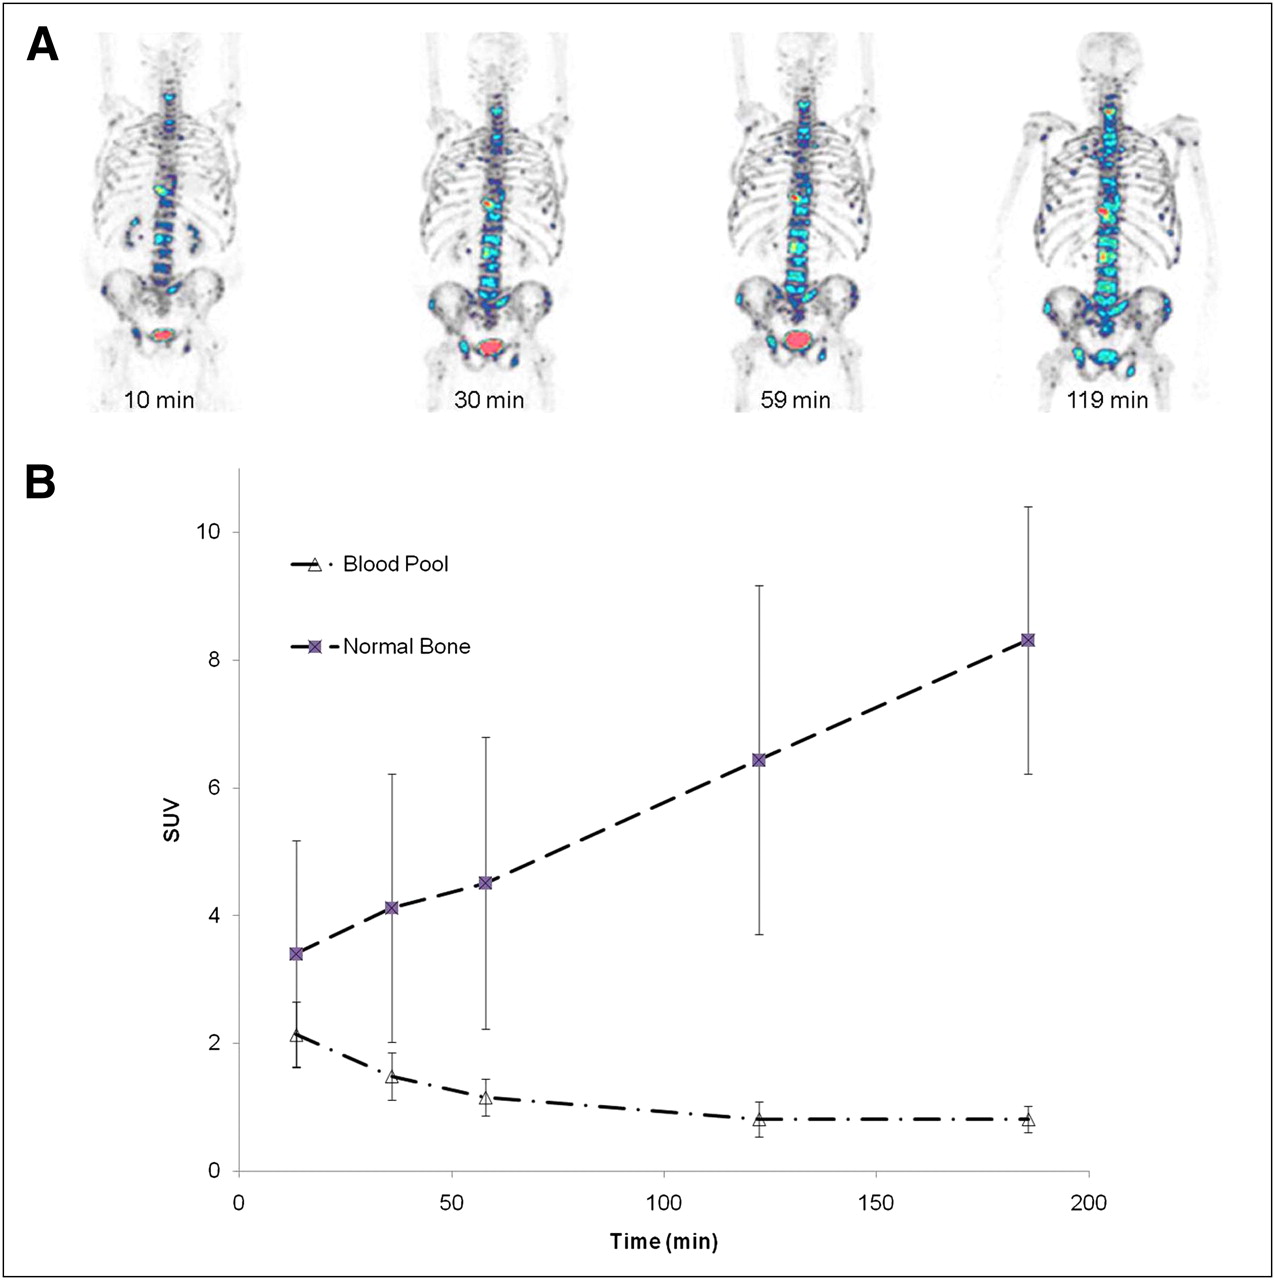
Although blood-pool clearance is rapid, uptake in normal and abnormal bone increases with time. (A) 18F-NaF PET images of 63-y-old man with adenocarcinoma of prostate. Images were acquired at 12, 30, 57, and 119 min after injection of 121 MBq (3.26 mCi) of 18F-NaF. Images are normalized such that all activity with SUV greater than 10 appears in STEP-10 color scale (in which each color change represents a 10% change in SUV). Visibility of lesions increases with time. (B) Average time–activity curves for blood pool and normal bone in patients with prostate cancer.
18F-NaF Reproducibility and Temporal Dependence
Visually, the uptake of 18F-NaF increased with time in both normal and abnormal bone (Fig. 2). The overall 18F-NaF uptake in abnormal bone, as measured by SUV10mean and SUV10act, initially increased with time, followed by a plateau. In prostate cancer patients, considering only the malignant lesions, the maximum SUV (mSUV10max), and mean SUV (mSUV10mean) (Fig. 3A) and total activity (mSUV10act) also increased with time. Figure 3B shows 18F-NaF uptake in individual patients with malignant lesions. Although the average has a relatively large SD, the consistent shape of each individual patient’s curve indicates that this variability is due to differential uptake in the individual patients’ tumors, not large changes of tumor uptake over time. Figure 3C shows the decrease in tumor to background over time, with the highest ratio present on the initial images.
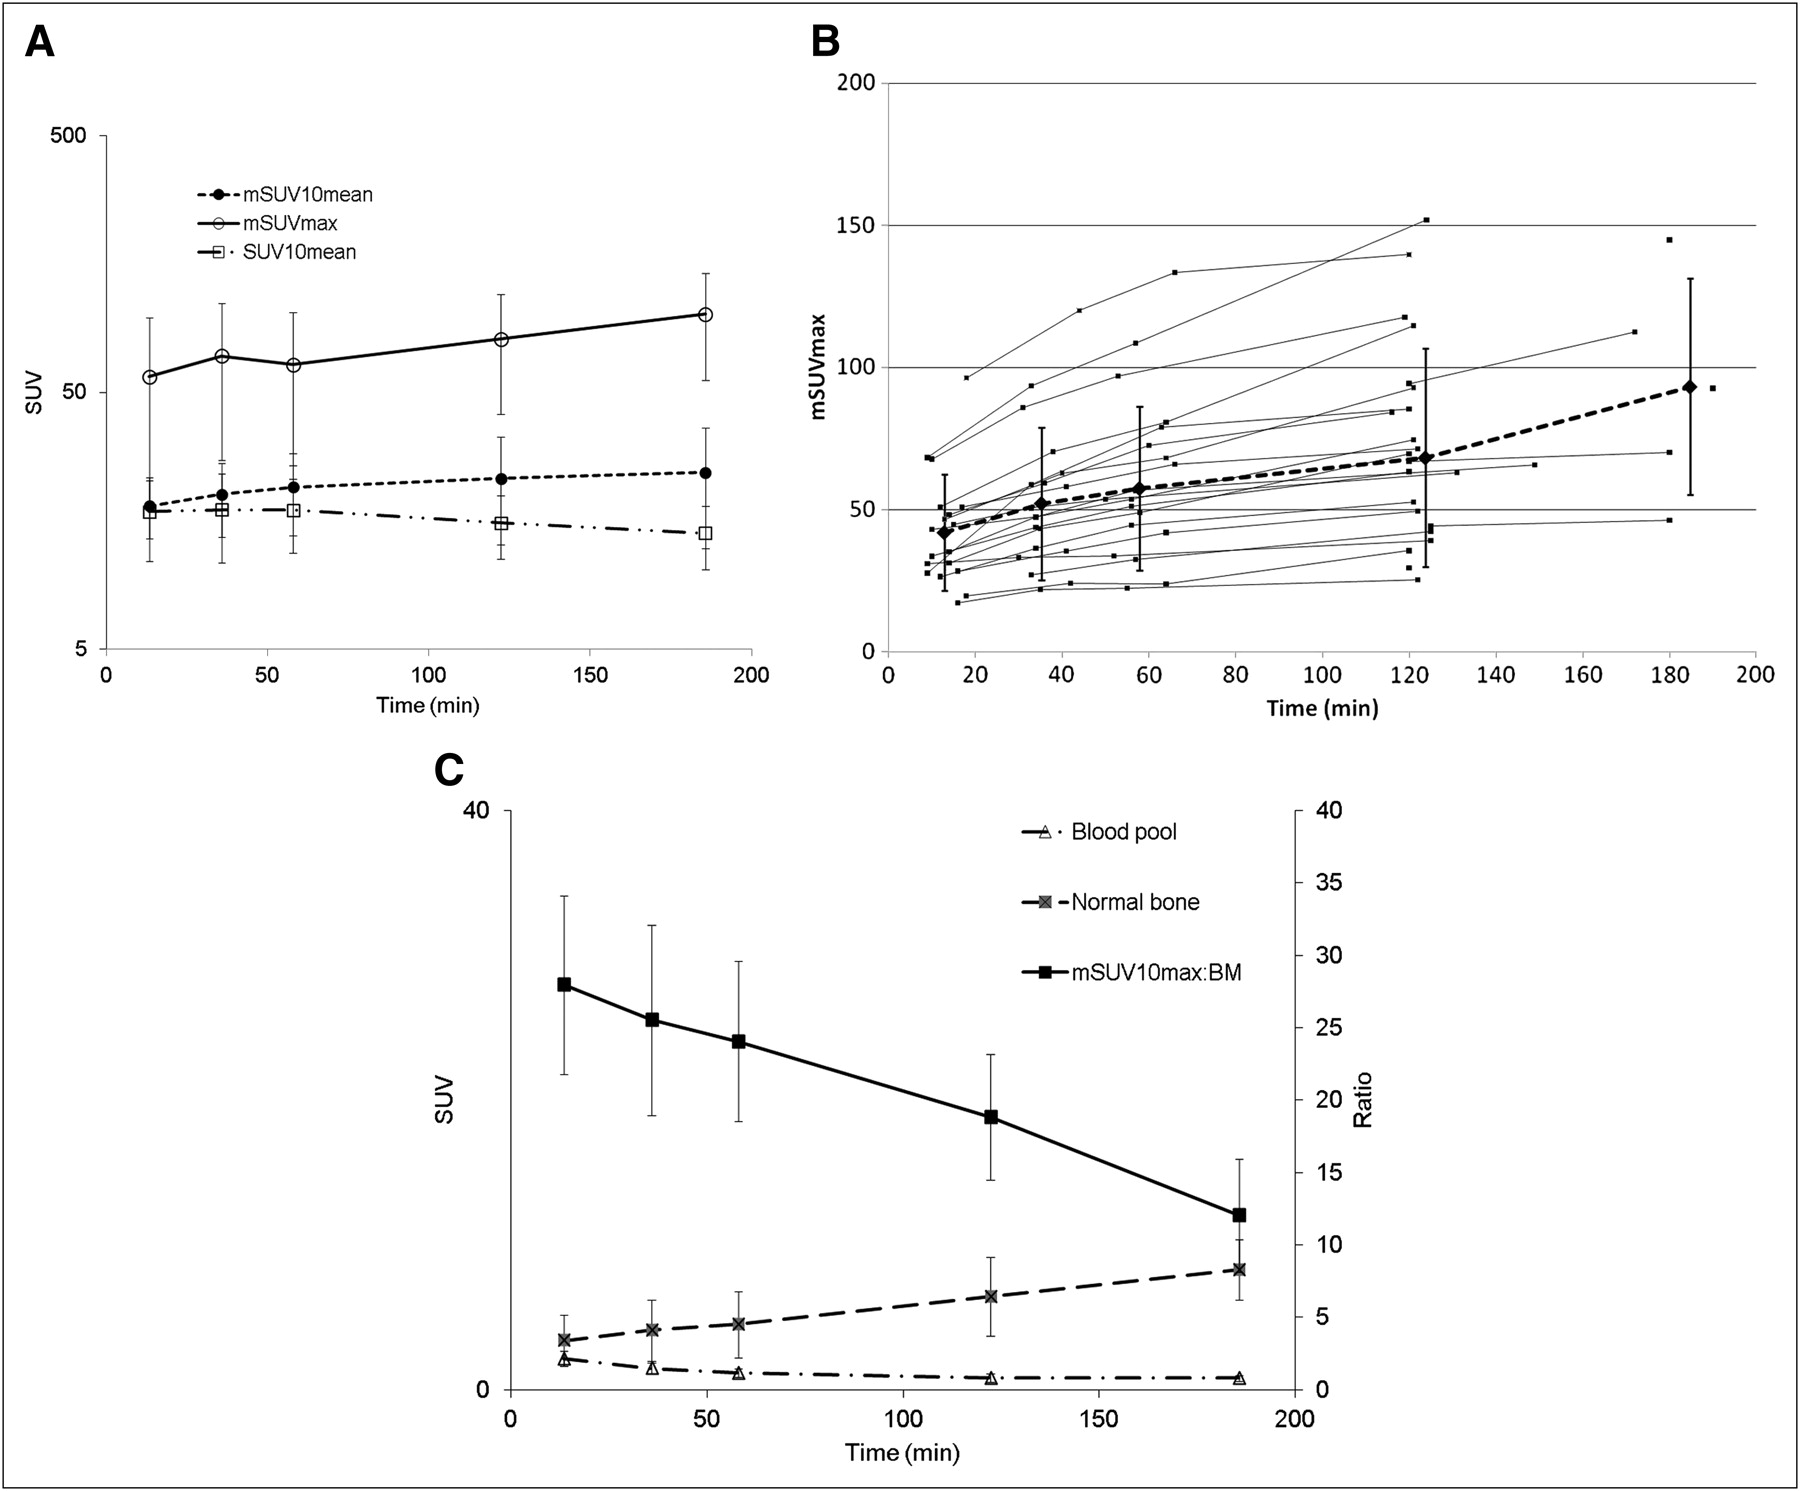
(A) Log plot of average time–activity curves of maximum SUV in mSUV10max, mSUV10mean, and SUV10mean, malignant or benign, in prostate cancer patients (n = 42). Slight upward trend in mSUV10max and mSUV10mean is seen. SUV10mean decreased slightly after 60 min. (B) Plot of mSUVmax for each patient with metastatic lesions. Dashed line is average value, with error bars representing SD. Large error bars are due to individual tumors having variable uptake, not to intrapatient time-dependent variability. (C) Plot of mSUVmax–to–normal bone ratio. T:B ratio decreases with time.
A comparison of the change in various parameters between sequential images is presented in log-transformed scale in Table 5. For all parameters there was a significant difference in uptake between the first and second time points (as denoted by the P values), and all but SUV10mean and mSUV10mean and mSUV10max:bkg maintained this significance over time.
Reproducibility data, calculated from the 21 prostate cancer patients who underwent repeated baseline imaging, are presented in Table 6 and Figure 4. The variability of each imaging parameter was dominated by patient heterogeneity. ICCs show high reproducibility, greater than 0.9 for most imaging parameters at all image time points. The only exception was mSUV10max:bkg, for which the ICC was below 0.85. The CPD values, representing the percentage difference in each parameter required to be considered a real change, are provided in Table 6.
Repeated Baseline Imaging Analysis in Patients with Prostate Cancer
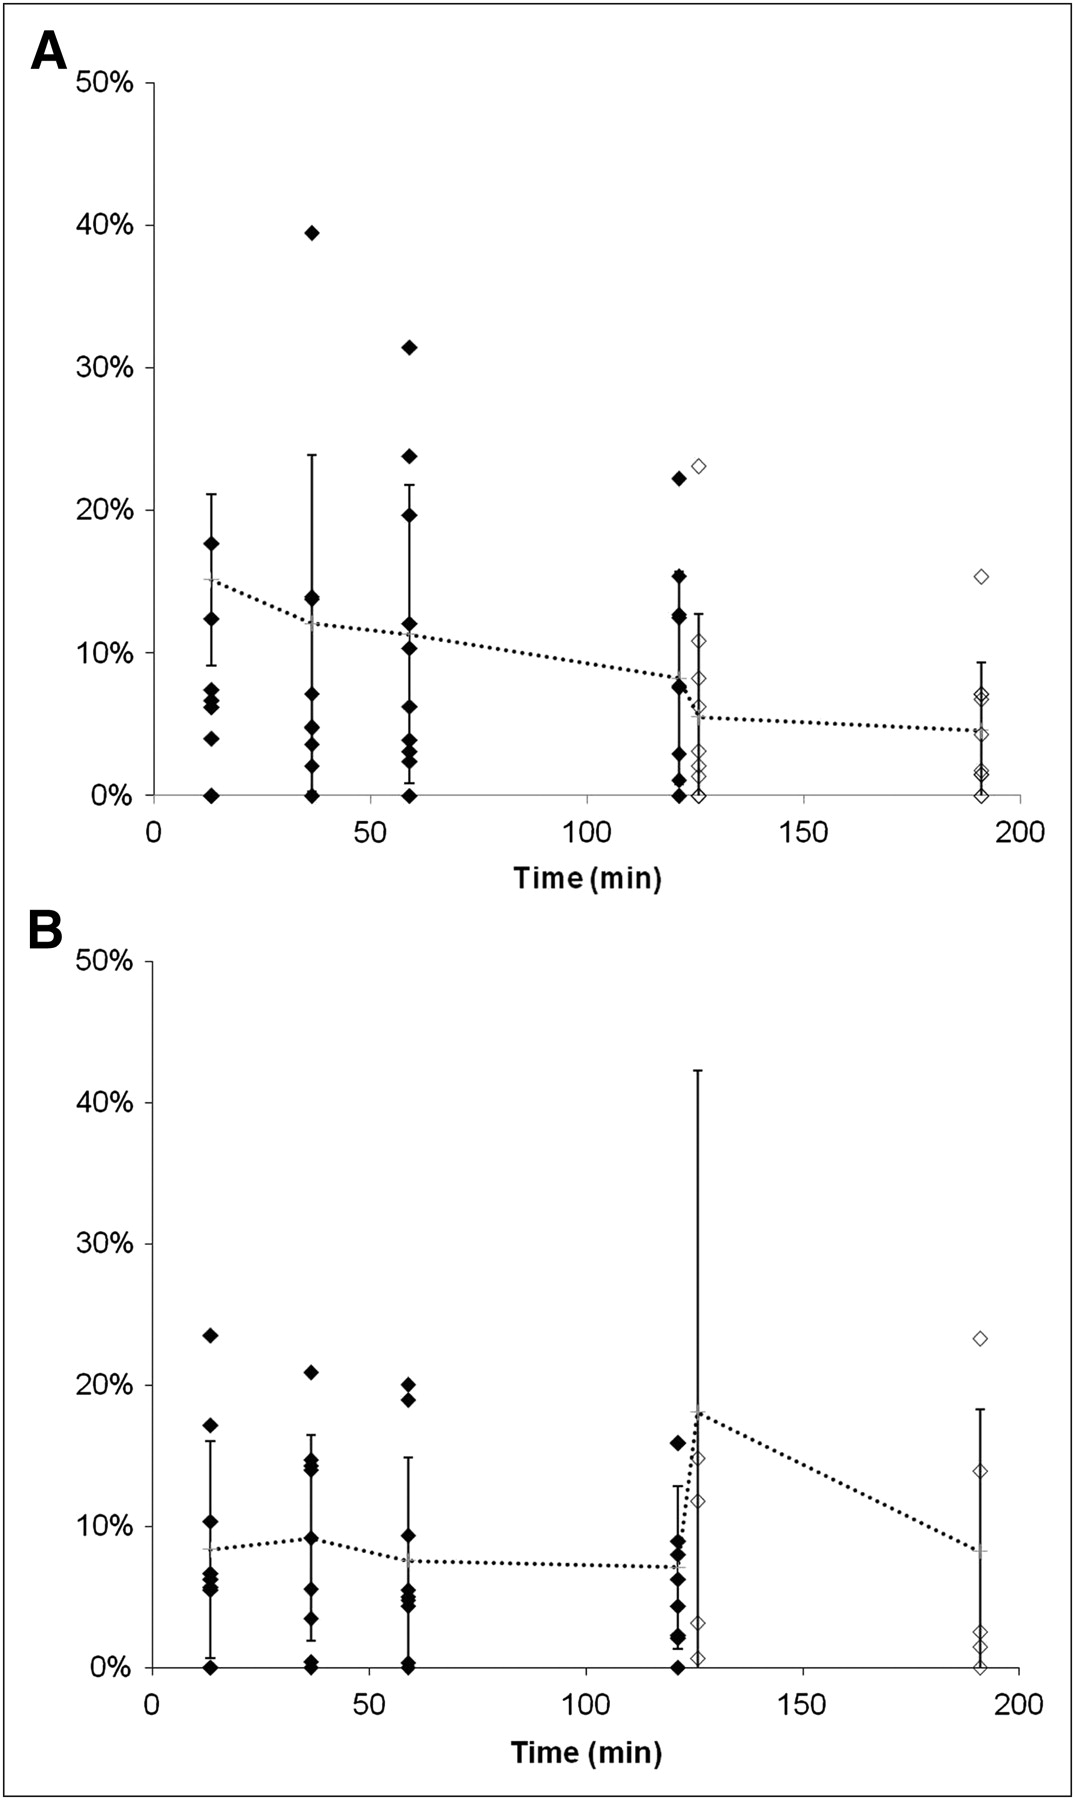
Plot of absolute value of percentage change of SUV10mean (A) and mSUV10mean (B) in prostate cancer patients who underwent repeated baseline imaging within 2 wk of each other (no intervention; mean interval, 5.9 ± 2 d). M = patients who were imaged for 4 time points over 2 h; I = patients who were imaged only at 2 and 3 h after injection. Dotted line and error bars are mean and SD, respectively, at each time point.
A comparison of multiple uptake parameters at multiple imaging time points was also performed in patients with multiple myeloma or myeloma precursor states (n = 31). Given the small number of malignant lesions in this cohort, only the SUV10mean and SUV10act parameters were evaluated. In these patients, the SUV10mean did not change significantly with time; however, the SUV10act values did increase with time (Table 7).
Comparison of Multiple Uptake Parameters at Multiple Imaging Time Points in Patients with Multiple Myeloma and Precursor States
DISCUSSION
18F-NaF was introduced as an imaging agent for bone lesions by Blau et al. (9) in 1962. Data from multiple small studies have shown that 18F-NaF PET produces bone scans with higher sensitivity and specificity than 99mTc-based bone scans (10–15). In one study of prostate cancer patients, using CT and clinical follow-up as a gold standard, the sensitivity and specificity for detection of bone lesions was higher for 18F-NaF PET/CT (100% and 100%, respectively) than for planar (70% and 57%, respectively) or SPECT bone scans (92% and 82%, respectively) (16).
These promising results, along with the recent shortages of 99mTc, have renewed interest in 18F-NaF clinical bone scanning. The Center for Medicare and Medicaid Services has established reimbursement for 18F-NaF PET/CT performed under clinical protocols designed to assess efficacy (17). The National Cancer Institute (NCI) Cancer Imaging Program obtained approval of a new drug application (NDA) from the Food and Drug Administration for the use of 18F-NaF (intravenous injection [296–444 MBq], with an uptake period > 1 h) for the evaluation of bone turnover. Specific details regarding the 18F-NaF NDA can be found on the NCI Web site (18).
Dosimetry and Biodistribution
The procedure guidelines of the Society of Nuclear Medicine recommend the administration of 185–370 MBq of 18F-NaF (19); however, we obtained high-quality images by administering only 111–185 MBq of 18F-NaF. The biodistribution and kinetics (Fig. 2) of 18F-NaF were similar to those previously published, showing rapid accumulation in bone and rapid renal clearance. The first-pass extraction was high but not 100%, as evidenced by the continued uptake in bone over time. The rate of uptake decreased with time, presumably because of irreversible binding and continued renal clearance. Previous publications (20) based on ICRP Report 53 (21) estimated an ED equivalent (EDE) of 0.027 mSv/MBq, with the urinary bladder receiving the highest dose at 0.22 mGy/MBq, followed by the bone surfaces and red marrow, each at 0.04 mGy/MBq. Our results (Table 4) using measured urinary excretion fraction and biologic half-life, and assuming a conservative 4-h voiding interval, showed the ED to be 0.02 mSv/MBq; however, doses to the urinary bladder were substantially lower (0.08 mGy/MBq). The basis for these differences is likely our current ability to obtain and analyze large, high-quality volumetric data over time, resulting in improved estimates of organ distributions and urinary clearance. The ICRP report assumes the urinary fraction to be 50%, whereas we measured it to be significantly lower at 15.3% ± 5%. In addition, the ICRP report measure of the residence time for the bladder was 25.1 min, whereas ours was 11 ± 5.4 min. Although the recommended dose of 296–444 MBq, as indicated in the NCI NDA, results in an acceptable ED of 4.9–7.4 mSv, we obtained high-quality images with only 111–185 MBq, with an ED of 1.8–3.1 mSv. High tumor-to-background (T:B) ratios permitted the injection of a reduced dose, with a concurrent increase in the default scan time per bed position from 1.5 to 2 min. Even at approximately 111 MBq, the normal bone-to-background measurements are sufficient (11.7) to determine a statistically accurate measurement (Fig.1; Table 2).
Temporal Characterization of 18F-NaF Uptake in Bone
NaF uptake in bone is dependent on blood flow and the available bone surface area. Eventually, NaF is incorporated into bone by replacement of hydroxyl or bicarbonate ions at the surface of hydroxyapatite crystals (2); however, this process takes hours to days (1). Given the short half-life of 18F (∼110 min), during PET the 18F-NaF likely is not incorporated into bone but rather is bound within the bone’s extracellular fluid (22). Although the kinetics of 18F-NaF uptake in bone have been reported (22), the optimal 18F-NaF uptake period has not been defined. Given the high extraction fraction, rapid uptake, and fast renal clearance, high-contrast bone imaging can be performed much earlier with 18F-NaF than with 99mTc-methylene-diphosphonate, which typically requires a delay of 2 h or greater. On the basis of available clinical studies, a report of the Society of Nuclear Medicine recommends that imaging begin 30–45 min after injection (19). In addition, the report notes that imaging of the extremities may necessitate a delay of 90–120 min. The NCI NDA recommends a delay of 1 h or more after injection.
Visual Analysis
Visually, 18F-NaF uptake increases with time both in normal bone and in malignant and benign bony processes (Fig. 2). Quantitatively, the T:B ratio decreased with time (Fig. 3C). However, at all time points this ratio was high, and with adjustment of the display window and level, this difference was not visibly apparent, suggesting that an uptake period as short as approximately 15 min may be adequate for nonquantitative clinical interpretation.
Quantitative Analysis
For quantitative applications, the selection of a robust imaging parameter with high reproducibility is critical to assessing therapeutic response. Although the T:B ratio decreases with time, the temporal dependence of the absolute uptake on early images may hinder accurate serial monitoring (a small difference in uptake period can result in a significant change in SUV).
To identify the most robust parameter representing bone uptake, we compared several parameters. We chose to exclude activity with an SUV of 10 or less, which was statistically less likely to represent abnormal bone, because the contribution of normal bone is dependent on the amount of bone in the imaging field of view—a parameter that can vary between studies and between patients. Potentially comprising a large volume, such variability could dilute small amounts of disease-based changes. This analysis method is not recommended as an automated diagnostic parameter but rather was used as a method of standardizing analysis for this study.
Initially, global parameters, which are independent of the cause of uptake (i.e., benign or malignant) such as SUV10act and SUV10mean, were evaluated. By not distinguishing between benign and malignant uptake, these parameters would be expected to be less sensitive to small changes in malignant disease burden. For this reason, metrics more specific for malignancy were also compared: mSUV10max, mSUV10mean, and mSUV10act. Because the T:B ratio drives lesion conspicuity, normalization to normal bone background for two of the malignant specific parameters was also evaluated: mSUV10max:bkg and mSUV10act:bkg.
Paired imaging time-point comparisons showed a significant difference between all time points, with the exception of SUV10mean (significantly different only between scans 1 and 2) and mSUV10max:bkg (showing significant differences between scans 1 and 2 and scans 2 and 3). Considering only temporal stability, imaging between approximately 30 and 90 min resulted in the smallest rate of change per min (≤0.2%) for the SUV10mean, mSUV10max:bkg, and mSUV10mean. This change would translate to a 6% increase in mSUV10mean measurements between approximately 30 and 60 min, as compared with a 23% difference in mSUV10mean (0.7% change/min) if measured between approximately 10 min and approximately 40 min.
The precision of 18F-NaF uptake measures in the 21 patients who underwent 2 baseline studies within 2 wk was evaluated. The differences within each patient were much smaller than the differences between patients. The ICCs were greater than 0.9 for most imaging parameters at all image time points. The only exception was the mSUV10max:bkg, for which ICC was below 0.8. In view of the high reproducibility of unadjusted mSUV10max, the decline of reproducibility in mSUV10max:bkg was due to the high variability of background SUV.
Considering again the most temporally stable of the highly reproducible parameters—SUV10mean and mSUV10mean—evaluating the critical percentage difference (the minimum percentage change needed to designate a change as significant), the former is slightly lower than the latter (9.4%–20.9% vs. 18.4%–33.2%). The advantage of the SUV10mean is that it eliminates the need to distinguish between benign and malignant abnormal bone uptake, reducing subjectivity; however, the SUV10mean parameter is anticipated to be insensitive to small changes in malignant bone disease burden, and mSUV10mean may be more indicative of total malignant disease burden. Further study is needed to determine the most clinically relevant and robust parameter.
Overall, although the T:B ratio decreases with time (estimated at 0.16%/min in the first hour), the rate of change of the most reproducible imaging parameters increases during that time (estimated, 0.3%–0.7%/min). Thus, it is reasonable to image between 30 and 90 min, when temporal variance is minimized. Fortunately, this paradigm fits readily into the existing workflow in most PET departments.
CONCLUSION
18F-NaF PET/CT bone imaging with modest radiation exposures results in highly reproducible imaging parameters. Although the T:B ratio decreases with time, the high temporal dependence of uptake periods less than 30 min may limit accurate quantitation. An uptake period of 60 ± 30 min has limited temporal dependence and maintains a high T:B ratio.
DISCLOSURE STATEMENT
The costs of publication of this article were defrayed in part by the payment of page charges. Therefore, and solely to indicate this fact, this article is hereby marked “advertisement” in accordance with 18 USC section 1734.
Acknowledgments
We thank our imaging technologists Gideon Kwarteng and Phil Eclarinal, without whom no data would have been obtained. We also thank the reviewers of this manuscript, whose advice and recommendations improved the quality of this article. This work was funded by the Center for Cancer Research/National Cancer Institute/National Institutes of Health. No other potential conflict of interest relevant to this article was reported.
Footnotes
Published online Jun. 22, 2012.
- © 2012 by the Society of Nuclear Medicine and Molecular Imaging, Inc.
REFERENCES
- Received for publication November 18, 2011.
- Accepted for publication February 28, 2012.


Jump to section
Related Articles
Cited By...
- Classification of Hyper-scale Multimodal Imaging Datasets
- Hot Spot Imaging in Cardiovascular Diseases: An Information Statement from SNMMI, ASNC, and EANM
- Observer Agreement and Accuracy of 18F-Sodium Fluoride PET/CT in the Diagnosis of Bone Metastases in Prostate Cancer
- Coronary Artery PET/MR Imaging: Feasibility, Limitations, and Solutions
- Repeatability of Quantitative 18F-NaF PET: A Multicenter Study
- Prospective Study Evaluating Na18F PET/CT in Predicting Clinical Outcomes and Survival in Advanced Prostate Cancer
- Determination of Skeletal Tumor Burden on 18F-Fluoride PET/CT
- Reply: Radiation Exposure Should Not Limit Bone Scintigraphy with 18F-NaF
- Radiation Exposure Should Not Limit Bone Scintigraphy with 18F-NaF