


Abstract
The ability of PET to image functional changes in tumors is increasingly being used to evaluate response and predict clinical benefit to conventional and novel cancer therapies. Although the use of 18F-FDG PET is well established, 3′-deoxy-3′-18F-fluorothymidine (18F-FLT) PET has potential advantages as a more specific marker of cellular proliferation. c-MET signaling is frequently dysregulated in cancer and is therefore an attractive therapeutic target. Crizotinib (PF-2341066) is a novel adenosine triphosphate–competitive c-MET kinase inhibitor with antitumor activity in a range of tumor models. The aim of this study was to investigate the utility of PET of glucose metabolism and cell proliferation to monitor tumor response to crizotinib in 2 cell lines with aberrant c-MET signaling. Methods: Mice bearing GTL-16 or U87MG xenografts were evaluated for changes in tumor volume and 18F-FDG and 18F-FLT uptake after daily oral treatment with up to 50 mg/kg crizotinib. GTL-16 and U87MG cells were treated with crizotinib in vitro and analyzed for 3H-2-deoxyglucose uptake and expression of activated MET, AKT, and ERK by immunoblotting. Results: Treatment of c-MET–amplified GTL-16 xenografts with 50 mg/kg crizotinib caused tumor regression that was associated with a slow reduction in 18F-FDG uptake (P < 0.05, day 13) and reduced expression of the glucose transporter 1, GLUT-1. Although baseline 18F-FDG uptake into U87MG tumors was substantially higher than in GTL-16 tumors, 18F-FDG uptake into U87MG tumors remained unchanged on treatment at 50 mg/kg crizotinib, despite tumor growth inhibition of 93% on day 8 of treatment. These findings were confirmed in vitro, where treatment of U87MG cells with 1 μM crizotinib had no demonstrable effect on glucose uptake. Furthermore, these cells demonstrated constitutive, crizotinib-independent phosphoinositide 3-kinase pathway signaling as demonstrated by phosphorylated AKT and ribosomal protein S6. Both U87MG and GTL-16 tumors showed high baseline uptake of 18F-FLT, which was reduced by 50% and 53% on days 4 and 8 of treatment, respectively. Conclusion: While the results provide a strong rationale to investigate the use of 18F-FLT PET as a clinical biomarker for monitoring tumor response to c-MET inhibition, 18F-FDG PET may be a less robust marker.
Tumor response to treatment is conventionally determined using anatomic imaging approaches such as CT and MRI to assess changes in tumor size. However, changes in physiologic processes such as metabolism and proliferation that accompany therapeutic response may occur somewhat more rapidly than tumor size reduction, particularly in response to molecularly targeted drugs. Thus, the ability of PET to image functional changes in tumors is increasingly being used to evaluate response and predict clinical benefit of novel cancer therapies.
The most commonly used PET tracer in oncology, 18F-FDG exploits the high glucose demand of tumor cells (1). 18F-FDG is taken up into cells by glucose transporters and is subsequently phosphorylated by the glycolytic enzyme hexokinase to FDG-6-phosphate, which is unable to be further metabolized and therefore remains trapped within cells (2,3). 18F-FDG PET has been used routinely for the diagnosis and staging of tumors and is now increasingly being used to predict response to both conventional and novel targeted therapies. Indeed, 18F-FDG PET has been validated as an early marker of response to KIT inhibition in gastrointestinal stromal tumors (4,5). The recently developed PET tracer 3′-deoxy-3′-18F-fluorothymidine (18F-FLT) is a marker of both cell proliferation, as it is retained in cells undergoing cell cycle progression after its phosphorylation in the cytosol by thymidine kinase 1 (6) and thymidylate synthase inhibition (7). 18F-FLT PET of tumor response to several molecule-targeted agents including the epidermal growth factor receptor inhibitors cetuximab (8) and erlotinib (9) and the MEK1/2 inhibitor PD0325901 (10) have demonstrated the potential utility of this tracer as an early marker of treatment response.
c-MET is a 190-kDa heterodimeric receptor tyrosine kinase that is frequently dysregulated in human tumors. On binding of its ligand, hepatocyte growth factor (HGF), c-MET undergoes autophosphorylation at multiple sites in the intracellular domain, leading to the recruitment and activation of adaptor proteins that in turn activate a range of downstream signaling pathways, including phosphatidylinositol 3-kinase (PI3K) and mitogen-activated protein kinase (MAPK) pathways (11,12). Consequently, MET signaling is important in numerous cellular processes including cell survival, proliferation, motility, migration, invasion, and angiogenesis.
Activation of c-MET signaling in cancer may occur via multiple mechanisms including receptor mutation, MET amplification, MET overexpression, and upregulation of HGF. As these alterations have been detected in a range of human tumors including lung, renal, and ovarian and are associated with poor prognosis (13,14), the MET signaling pathway represents an attractive target for therapeutic intervention. Approaches to inhibiting MET signaling that have been investigated include antagonistic antibodies to the extracellular domain and small-molecule kinase inhibitors (14–16). Crizotinib (PF-2341066) is a highly potent adenosine triphosphate–competitive small-molecule inhibitor of the kinase activity of c-MET and the related anaplastic lymphoma kinase. In preclinical studies, crizotinib effectively inhibits c-MET signaling in vivo and demonstrates efficacy against a wide range of c-MET–driven tumor models (17,18). Thus, on the basis of its favorable preclinical profile, crizotinib is currently being evaluated in clinical trials.
The aim of this study was to investigate the ability of 18F-FDG and 18F-FLT PET to predict in vivo response to MET inhibition by crizotinib and correlate the findings with changes in cellular signaling pathways downstream of c-MET and glucose transport.
MATERIALS AND METHODS
Materials
Crizotinib (PF-2341066) was prepared at the Pfizer laboratories. 18F-FDG was purchased from Cyclotek (Aust) Pty Ltd., and 18F-FLT was prepared in-house as described previously (19). Antibodies to total AKT (#9272), phospho-Ser473 AKT (#9271), phospho-Thr202/Tyr204 MAPK (#9101), total MAPK (#9102), phospho-ribosomal protein S6 (#2211), total rpS6 (#2217), and phospho-Tyr1234/1235 MET (3D7) were purchased from Cell Signaling. The total MET (C-28) and actin (C4) antibodies were purchased from MP Biomedicals and Santa Cruz, respectively.
Cell Culture
U87MG human glioblastoma cells were purchased from American Tissue Type Collection, and GTL-16 human gastric cancer cells were a gift from Dr. Paolo Comoglio and Dr. Mariaflaia DiRenzo (University Torino Medical School). U87MG cells were grown in Dulbecco modified Eagle medium (DMEM) supplemented with 15% fetal bovine serum and GTL-16 cells in RPMI 1640 medium supplemented with 10% fetal bovine serum. All cells were maintained in a humidified atmosphere of 95% air and 5% CO2. All cells were determined to be free of Mycoplasma contamination.
In Vitro Glucose Uptake
Cells were seeded in 6-well culture plates (2 × 10⁵ cells per well) and incubated overnight. Crizotinib or vehicle was then added, and the cells were incubated for a further 24 h. The plates were then washed twice with phosphate-buffered saline and once with glucose-free (GF) DMEM. GF DMEM containing 46.3 kBq of 3H-2-deoxyglucose per milliliter (Amersham, 222 GBq/mmol) and 100 μM 2-deoxyglucose were then added, and the plates were incubated at 37°C for 10 min. The reaction was stopped by addition of ice-cold GF DMEM containing 0.6 mM phloretin, and the cells were lysed in 0.1 M NaOH and 2% Triton X-100. Radioactivity was determined by scintillation counting in Count Safe (Becton Dickinson), and results were standardized for protein content in each sample.
In Vitro Cell Signaling Studies
Cells (1 × 10⁶) were seeded into 10-cm dishes containing complete medium and incubated overnight. The plates were then washed in phosphate-buffered saline before medium without fetal bovine serum was added, and the plates were incubated further overnight. Crizotinib was added and incubated for 1 h at 37°C before the addition of HGF (40 ng/mL; R&D Systems) for 10 min at 37°C. The cells were then lysed into 10 mM sodium phosphate, pH 7.4, 150 mM NaCl, 1 mM ethylenediaminetetraacetic acid, 1% NP-40, 0.5% sodium deoxycholate, 0.1% sodium dodecyl sulfate, 50 mM NaF, and 1 mM sodium pyrophosphate with protease inhibitors. The protein concentration of the resulting lysate was determined using the Bio-Rad protein determination kit and 50 μg of sample subjected to sodium dodecyl sulfate polyacrylamide gel electrophoresis. Separated proteins were transferred onto a polyvinylidene fluoride membrane and Western blots performed using standard techniques. Antigens were detected using horseradish peroxidase–coupled secondary antibodies and enhanced chemiluminescence or by LiCor imaging using fluorescently labeled secondary antibodies. Primary antibodies were used at 1/1,000, unless otherwise indicated.
Tumor Xenograft Experiments
BALB/c nude and severe combined immunodeficient (SCID) mice were purchased from Animal Resources Centre. All procedures using animals were approved by the institutional animal ethics committee and were performed in accordance with the Australian Code of Practice for the Care and Use of Animals for Scientific Purposes.
Mice were implanted subcutaneously on the right flank or hind limb with 3 × 10⁶ (U87MG) or 4 × 10⁶ (GTL-16) cells in 50% Matrigel (BD Biosciences). Once palpable, the tumors were measured 3 times weekly using electronic calipers. When tumor volumes reached a mean of approximately 150 mm3 (volume = length/2 × width2), the mice were randomized into treatment groups of 6–7 animals as required. Crizotinib was delivered by oral gavage in sterile water at a dose of 12.5 or 50 mg/kg at 0.1 mL/10 g of body weight. Percentage tumor growth inhibition was calculated on a given day (a) as 100 × {[(treatedday a – treatedday 1)/(controlday a – controlday 1)]}.
PET
PET scans were obtained as described previously (19). For 18F-FDG scans, mice were kept fasting for 3 h and then anesthetized using 2% isoflurane and injected intravenously with 14.8 MBq (400 μCi) of 18F-FDG in saline. The animals remained anesthetized for a further 20 min before being allowed to recover. At 90 min after PET tracer injection, the animals were again anesthetized and placed on the bed of a small-animal PET scanner (Mosaic; Philips), and image data were collected over 10 min. For 18F-FLT imaging, mice were injected intravenously with 14.8 MBq (400 μCi) of 18F-FLT and 90 min later anesthetized for scanning.
Images were reconstructed using the 3-dimensional row-action maximum-likelihood algorithm software available on the Mosaic scanner. Regions of interest were drawn around the tumor and a representative background region on transaxial slice images. A tumor-to-background uptake ratio (TBR) was then calculated by dividing the maximum pixel intensity within a tumor region of interest by the average pixel intensity within the background region of interest.
Biomarker Analysis
For immunohistochemical analysis of the glucose transporter GLUT-1, formalin-fixed tumors were embedded in paraffin, and 4-μm sections were then prepared for detection with rabbit polyclonal anti–GLUT-1 antibody (Thermo) using standard methods.
RESULTS
Crizotinib Inhibits GTL-16 Tumor Growth and 18F-FDG Uptake In Vivo
Two tumor models representing alternative mechanisms of MET activation were used in this study. The GTL-16 gastric carcinoma line overexpresses the MET receptor through gene amplification (20), resulting in the constitutive activation of the MET signaling pathway, whereas the U87MG glioblastoma line represents a model of autocrine activation of the pathway because it expresses both c-MET and HGF (21). Previous in vivo studies showed both tumor models are highly responsive in vivo to the small-molecule MET inhibitor crizotinib (17).
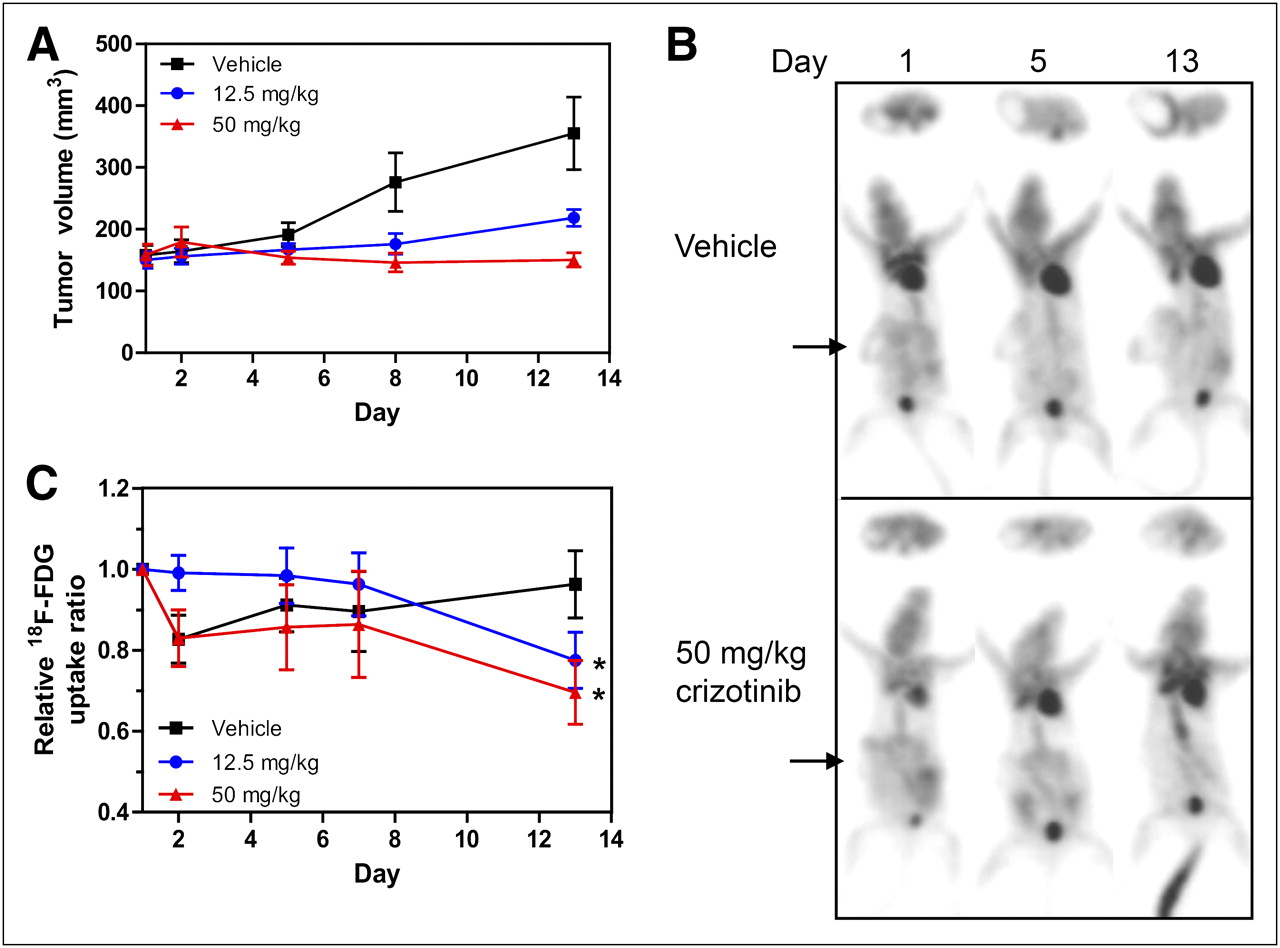
In the initial experiments, GTL-16 tumor–bearing mice were randomized to receive either vehicle or crizotinib and then underwent 18F-FDG PET immediately before (baseline, day 1) and on 4 subsequent days (days 2, 5, 7, and 13) during therapy. The effects of crizotinib on tumor growth are summarized in Figure 1A. As observed previously (17), crizotinib was highly efficacious, resulting in tumor growth inhibition of 65% and 108% at 12.5 and 50 mg/kg drug, respectively, at day 13 of treatment. 18F-FDG PET of GTL-16 tumors at baseline demonstrated modest tracer uptake with reduced signal in the central core of the tumor, consistent with the necrotic nature of this model (Fig. 1B). The baseline 18F-FDG TBR calculated from the PET images was approximately 2 and remained at a similar level in the vehicle-treated group on day 13 (Fig. 1C). In contrast, 18F-FDG uptake in the crizotinib-treated animals gradually declined over the time course, and in the 50 mg/kg group, uptake was reduced by 30% on day 13, compared with baseline (P < 0.05), to almost background levels of 18F-FDG uptake.

Crizotinib inhibits GTL-16 tumor growth and reduces tumor 18F-FDG uptake. GTL-16 tumor–bearing SCID mice were serially imaged using 18F-FDG PET over 13 d of treatment with crizotinib. (A) Tumors from mice treated orally with 0, 12.5, or 50 mg/kg crizotinib, as indicated, were measured using electronic calipers, and volumes are expressed as mean ± SEM; n = 6–7. (B) Serial 18F-FDG PET transaxial (upper) and maximum-intensity-projection (lower) images of representative mice from vehicle and 50 mg/kg crizotinib groups are shown. Arrows indicate position of tumor. (C) TBR 18F-FDG uptake ratios based on PET images for vehicle and crizotinib (12.5 and 50 mg/kg)-treated animals are expressed as mean uptake (±SEM) relative to uptake on day 1. *P < 0.05.
Because 18F-FDG is transported predominantly by the glucose transporter GLUT-1, we performed biomarker analyses to investigate the effects of the c-MET inhibitor on GLUT-1 expression in GTL-16 tumors. For this study, tumors were harvested at either baseline or day 4 of treatment with 50 mg of crizotinib per kilogram for anti–GLUT-1 immunohistochemistry. As seen in Supplemental Figure 1 (supplemental materials are available online only at http://jnm.snmjournals.org), tumors from vehicle-treated animals show strong membrane-associated GLUT-1 staining, which is markedly reduced in tumors from mice treated with crizotinib.
Crizotinib Inhibits U87MG Tumor Growth but Not 18F-FDG Accumulation
Crizotinib treatment was also highly efficacious in the U87MG glioma model, inhibiting tumor growth on day 8 by 44% and 93% in the 12.5 and 50 mg/kg groups, respectively (Fig. 2A). 18F-FDG uptake was determined at baseline and days 2, 5, and 8 of treatment as well as days 12 and 19 in the 50 mg/kg group only. Representative images of mice from the vehicle and 50 mg/kg treatment groups are shown in Figure 2B for baseline, day 5, and day 8 scans. Baseline 18F-FDG uptake in this model is relatively high (∼3-fold above background) and further increased by 57% in the vehicle group and 47% in the 12.5 mg/kg crizotinib group on day 8. In the 50 mg/kg drug group, 18F-FDG uptake remained at essentially baseline levels over the entire 19-d treatment period (Fig. 2C) and closely resembled the tumor growth profile. These findings clearly demonstrate that U87MG tumor response to the MET inhibitor crizotinib is associated with stabilization rather than reduction in glucose metabolism as measured by 18F-FDG uptake.
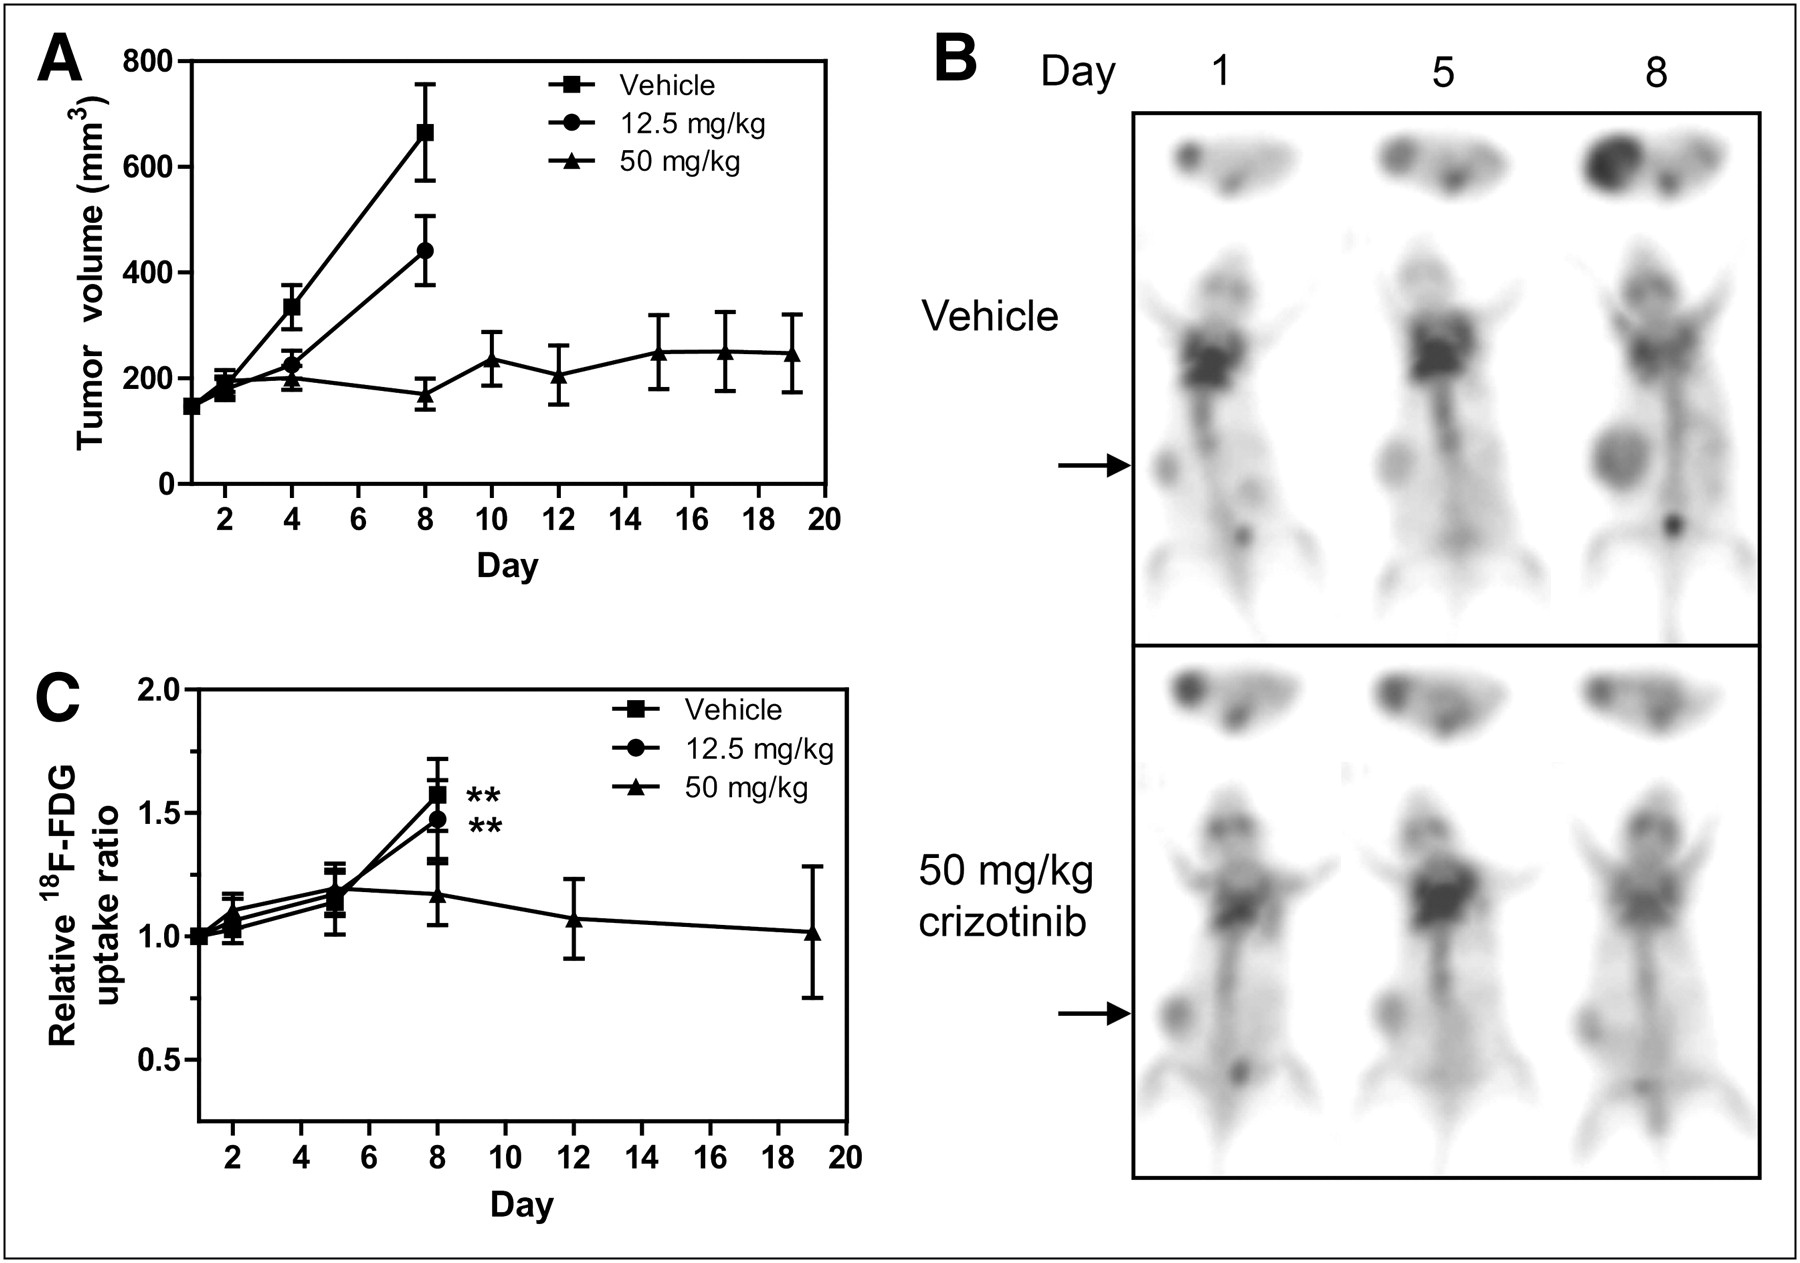
Crizotinib inhibits U87MG tumor growth but does not affect tumor 18F-FDG uptake. U87MG tumor–bearing mice were imaged by 18F-FDG PET for up to 19 d of treatment with crizotinib. (A) Tumor volumes were measured until day 8 (vehicle and 12.5 mg/kg groups) or day 19 (50 mg/kg group). Tumor volumes for 3 treatment groups are expressed as mean ± SEM; n = 8–9. (B) 18F-FDG PET images of representative mice from vehicle and 50 mg/kg groups are shown. (C) TBR 18F-FDG uptake ratios based on PET scans for each group are expressed as mean uptake (±SEM) relative to that on day 1. *P < 0.05 (12.5 mg/kg). **P ≤ 0.001 (50 mg/kg).
Differential Effects of Crizotinib on c-MET Signaling Glucose Uptake and in GTL-16 and U87MG Cells In Vitro
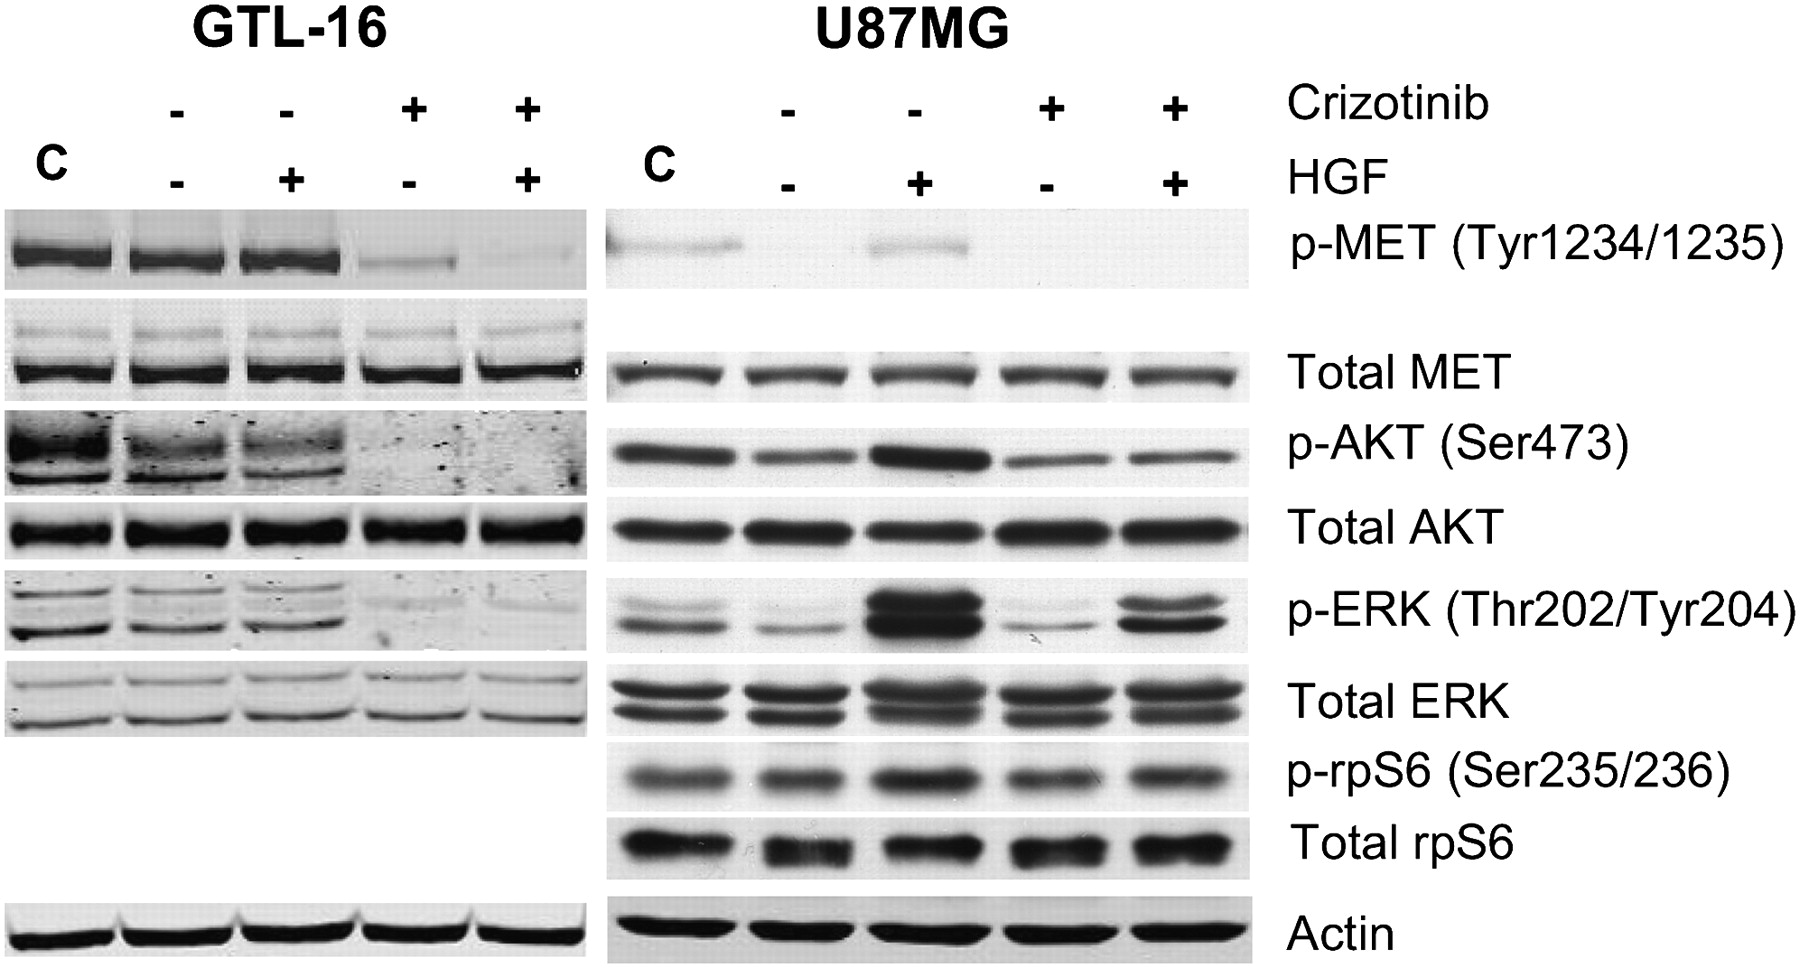
To further investigate the unexpected 18F-FDG uptake findings in U87MG cells, the effect of crizotinib on both c-MET signaling and 2-deoxyglucose (2-DOG) uptake was evaluated in the same tumor models in vitro. First, the effect of crizotinib on signaling pathways downstream of c-MET was investigated to identify events that may have bearing on the metabolic activity in the cell lines. As seen in Figure 3 (left), GTL-16 cells growing in serum containing medium express a high level of activated MET (as measured by Y1234/Y1235 phosphorylation) that is not affected by serum starvation or further increased by HGF stimulation. Incubation of serum-starved cells with crizotinib results in marked attenuation of MET phosphorylation, which is minimally affected by subsequent HGF stimulation. Concomitantly, these cells also exhibit high, HGF-independent baseline activation of PI3K/AKT/mammalian target of rapamycin (mTOR) and MAPK pathways as assessed by S473-AKT and ERK phosphorylation levels. Both S473-AKT and ERK activation were inhibited by crizotinib treatment, demonstrating that in this cell line, blockade of c-MET signaling effectively inhibits signaling through both the PI3K and MAPK pathways.

Crizotinib has differential effects on c-MET signaling and glucose uptake in GTL-16 and U87MG cells in vitro. (A) Western blots of proteins from GTL-16 (left) or U87MG (right) cells were serum-starved for 24 h and then incubated in the absence (−) or presence (+) of 200 nM crizotinib for 1 h before being stimulated (+) or not (−) with HGF (40 ng/mL) for 15 min. Lane C represents control cells growing in presence of complete serum containing medium.
In addition to possessing an HGF/MET autocrine loop, the U87MG cell line is null for the PTEN tumor suppressor and therefore exhibits constitutive PI3K/AKT pathway activation. Serum starvation of these cells reduced the already low level of activated MET in exponentially growing cells to an undetectable level, whereas HGF stimulation restored MET phosphorylation to the baseline levels (Fig. 3, right). Crizotinib treatment of serum-starved U87MG cells reduced phosphorylated MET to negligible levels, independent of HGF stimulation. The basal levels of activated Ser-473-AKT and ERK evident in serum-starved cells were increased on the addition of HGF, indicating the capacity of the c-MET signaling pathway for further activation by exogenous HGF. Ser-473-AKT and phospho-ERK levels, however, were not reduced below basal levels on crizotinib treatment. To further investigate the effects of crizotinib on signaling pathways downstream of AKT, we also probed for phosphorylation of the S6-kinase substrate, rpS6 (Fig. 3, right). Both HGF stimulation and crizotinib treatment minimally affected robust phosphorylation of rpS6, consistent with constitutive activation of the PI3K/AKT/mTOR pathway in these cells.
To investigate the effects of crizotinib on glucose uptake in vitro, U87MG and GTL-16 cells in culture were treated with crizotinib for 24 h before being incubated with 3H-2-DOG. The results shown in Supplemental Figure 2 demonstrate that glucose uptake into GTL-16 cells is highly sensitive to c-MET inhibition, with 2-DOG uptake reduced by over 90% at 100 nM crizotinib. In contrast, treatment of U87MG cells with up to 1 μM of the inhibitor had no impact on 2-DOG uptake. To investigate whether this effect may be related to the constitutive AKT/mTOR signaling observed in U87MG cells (Fig. 3), we further examined the effect of crizotinib on 2-DOG uptake into PC3 cells, which are also PTEN-null, possess a MET/HGF autocrine loop, and are highly sensitive to crizotinib in vivo (17). The results in Supplemental Figure 2 show that, as observed in U87MG cells, 2-DOG uptake into PC3 cells was unchanged at doses up to 1 μM crizotinib.
c-MET Inhibition Reduces 18F-FLT Uptake in Both GTL-16 and U87MG Tumor Models
We previously demonstrated that crizotinib treatment causes a dose-dependent reduction in GTL-16 cell proliferation as indicated by changes in Ki67 staining of tumor xenografts (17). These data provided a strong rationale to investigate the effects of MET inhibition on in vivo uptake of the cell proliferation marker 18F-FLT in this model. For 18F-FLT PET, GTL-16 tumor–bearing mice were randomized into treatment groups and underwent baseline PET scans before commencement of daily drug treatment and serial PET. The effects of crizotinib on GTL-16 tumor growth and 18F-FLT uptake are summarized in Supplemental Figure 3A and Figure 4A, respectively. As seen in Figure 4A, GTL-16 tumors showed high basal 18F-FLT uptake with a TBR of approximately 4. 18F-FLT uptake remained relatively stable in the vehicle-treated mice but decreased on crizotinib treatment. Relative 18F-FLT uptake values derived from the imaging results of the 3 treatment groups are summarized in Figure 4B. Treatment of GTL-16 mice at 12.5 and 50 mg of crizotinib per kilogram significantly reduced 18F-FLT uptake on days 4 and 7 of treatment (P < 0.05).
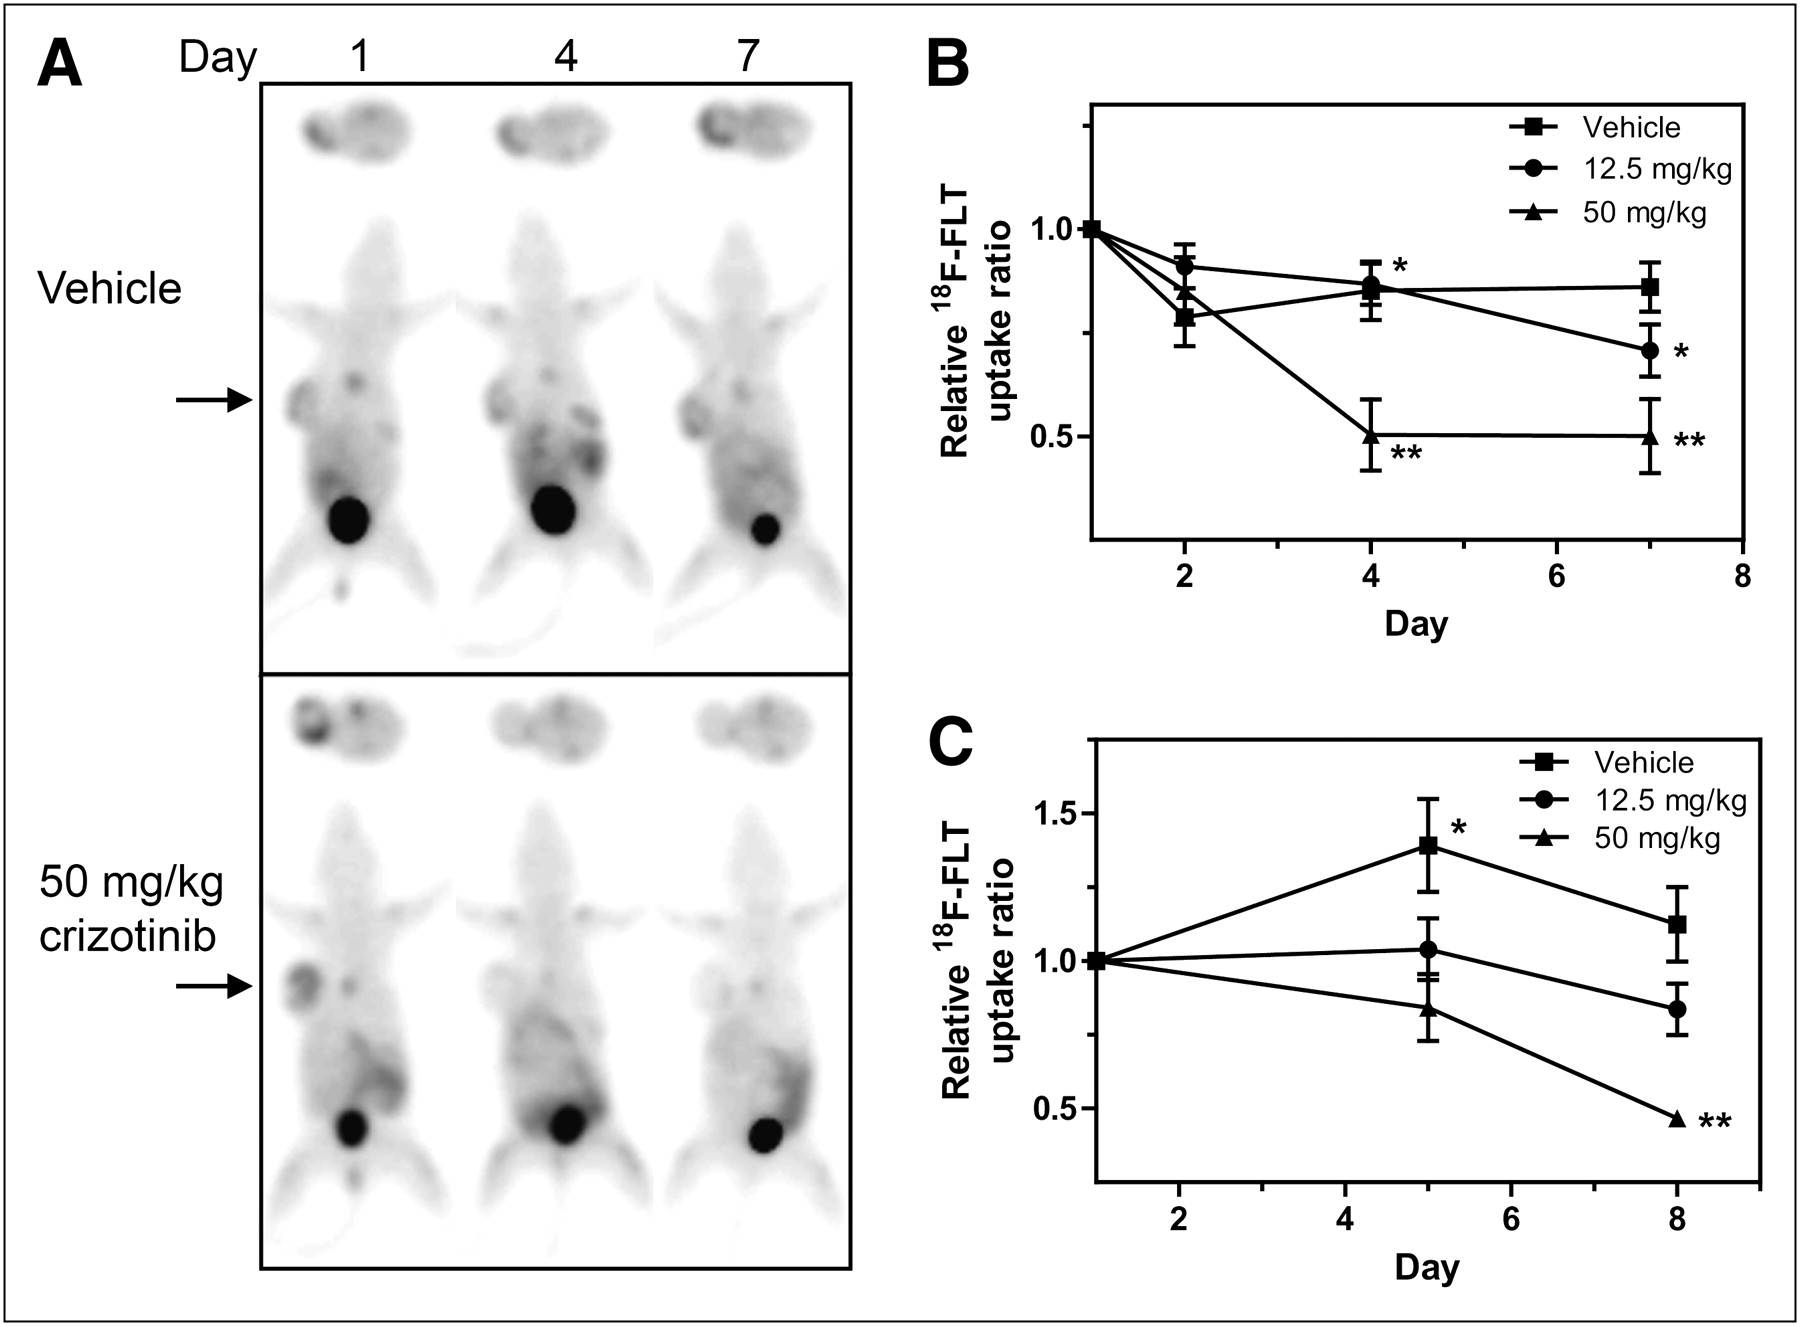
Crizotinib inhibits 18F-FLT uptake into GTL-16 and U87MG tumors in vivo. Mice bearing GTL-16 or U87MG tumors were treated with crizotinib and imaged using 18F-FLT PET for up to 8 d as described in Figure 1. Representative serial 18F-FLT PET images are shown from GTL-16 tumor–bearing mouse treated with vehicle or 50 mg of crizotinib per kilogram (A). 18F-FLT TBR uptake from GTL-16 (B) or U87MG (C) tumors was calculated from PET images and is expressed as mean uptake (±SEM) relative to baseline (GTL-16: n = 6–7; U87MG: n = 7–8). *P < 0.05. **P < 0.001.
The effect of c-MET inhibition on 18F-FLT uptake was also investigated in the U87MG model. Representative 18F-FLT PET images (Supplemental Fig. 3B) demonstrate that this model has high baseline 18F-FLT uptake that remains consistently high in vehicle-treated tumors over the treatment period, concomitant with the large increase in tumor size by day 8 (Supplemental Fig. 3C). Quantitative analysis of the imaging data revealed that basal 18F-FLT uptake (TBR, 5) also remained relatively stable over 8 d in the intermediate treatment group (Fig. 4C) but decreased by 53% (P < 0.001 on day 8) in the 50 mg/kg group.
DISCUSSION
The MET proto-oncogene signals through both the PI3K and MAPK pathways, regulating metabolic processes and cellular proliferation (22,23). We therefore hypothesized that functional imaging using 18F-FDG and 18F-FLT PET may be useful for monitoring tumor response to MET inhibitors. As crizotinib is a potent inhibitor of MET kinase activity (17), we studied the effects of this compound on metabolic and proliferative outcomes in tumor models of both receptor- and ligand-mediated activation of MET using both PET and biochemical readouts.
Initially, tumor growth and 18F-FDG PET responses to crizotinib were examined in GTL-16 and U87MG tumor–bearing mice. Although treatment with 50 mg/kg crizotinib was similarly tumoristatic in both models, 18F-FDG uptake was significantly affected only in the GTL-16 tumors, in which it declined to approximately 70% of baseline in crizotinib-treated (50 mg/kg) tumors after 13 d of treatment. The metabolic response to crizotinib treatment in this model is supported by the results of the biomarker study, which show a strong inhibitory effect of the drug on cell surface expression of GLUT-1, the main transporter for 18F-FDG in human cancers. The results from the 18F-FDG PET study in the GTL-16 model therefore suggest that tumor response to crizotinib is associated with a reduction in glucose metabolism.
The imaging results from the U87MG tumors, however, differed markedly from those of the GTL-16 model. Baseline 18F-FDG uptake in U87MG tumors was higher than that in GTL-16 tumors and uptake increased further in the U87MG tumors treated with both vehicle and the lower drug dose as they continued to grow. In contrast, 18F-FDG uptake in the drug (50 mg/kg)-treated tumors was essentially unchanged during the treatment period. These findings are analogous to those reported by Tseng et al. (24), who found that 18F-FDG uptake into U87MG tumors remained essentially at baseline levels after treatment with a c-MET antagonistic antibody, CE-355621, but increased over time in the vehicle-treated tumors. Thus, 18F-FDG uptake in the U87MG model appears to parallel tumor growth, which is consistent with a report from Sasajima et al. (25) showing that 18F-FDG uptake in cultured U87 cells is closely correlated with growth phase and cell density.
Several studies have demonstrated that U87MG tumor growth is sensitive to various inhibitors of c-MET signaling (15,17,26–28). Biochemical analyses after treatment of U87MG cells with the small molecule MET inhibitor AM7 revealed a dose-dependent inhibition of activated AKT and ERK but, as seen in our study, no effect on the phosphorylation of the PI3K/AKT/mTOR pathway protein, ribosomal protein S6 (28). Interestingly, inhibition of mTORC1 signaling in U87MG tumors with rapamycin (29) leads to a reduction in 18F-FDG PET uptake. Therefore, the sustained 18F-FDG uptake in U87MG tumors responding to crizotinib may reflect the maintenance of basal mTORC1 signaling and glucose uptake due to c-MET–independent PI3K signaling associated with PTEN loss in these cells. In support of this notion, crizotinib treatment of the PTEN-null PC3 cells, a model that has previously been shown to be highly responsive to crizotinib (17), also had no impact on glucose uptake in vitro (Supplemental Fig. 2).
Unlike metabolic imaging, 18F-FLT PET proved to be a robust biomarker of tumor response to crizotinib. Both tumor models had high baseline 18F-FLT uptake (4- to 5-fold above background) that was potently attenuated (by ∼50%) after 1 wk of treatment at 50 mg/kg crizotinib, a dose that inhibits tumor growth by more than 80%. At the intermediate drug dose, however, reduction in 18F-FLT uptake was observed in the more sensitive GTL-16 model but not the U87MG model. These findings therefore suggest that extensive tumor cytostasis is required for an 18F-FLT PET response after c-MET inhibition. This response most likely reflects the arrest of a large proportion of cells in the G1 phase of the cell cycle, where 18F-FLT uptake is minimal because of the low expression of thymidine kinase 1, the key rate-limiting enzyme in the cellular uptake and retention of 18F-FLT. Further, this is consistent with the reduced Ki-67 staining in GTL-16 tumors observed in our previous crizotinib study (17) and the G1 cell cycle arrest observed with other MET inhibitors (30,31). These findings therefore demonstrate the potential utility of 18F-FLT PET to monitor early tumor response to c-MET inhibition and provide a rationale for its evaluation in the clinical development of these inhibitors.
The imaging studies presented herein provide important insight into the use of preclinical tumor models for evaluating response to novel targeted therapies by PET. Response to such drugs should be evaluated in more than one tumor model to eliminate the possibility of cell line specific effects, such as observed with 18F-FDG imaging in the U87MG model. Furthermore, tumor models should exhibit robust PET tracer uptake at baseline to ensure maximum sensitivity for the quantitation of any drug-induced changes in tracer uptake. The GTL-16 model exhibits only modest (1.5- to 2-fold above background) baseline 18F-FDG uptake, and although there was a trend to reduced 18F-FDG uptake over time with crizotinib treatment, it was not until day 13 that this reached statistical significance. The apparent discrepancy in timing between the reduction in tumor 18F-FDG uptake and changes in GLUT-1 expression in GTL-16 tumors (dramatically reduced by day 4; Supplemental Fig. 1) therefore most likely reflects the limitations associated with the low signal-to-noise ratio in the quantitation of the 18F-FDG PET scans.
CONCLUSION
As MET inhibitors progress into clinical trials, the identification of early markers of tumor response will be investigated. Although 18F-FLT PET is not a direct measure of c-MET activity itself, our findings suggest that 18F-FLT PET for monitoring tumor response to MET inhibition is warranted in these clinical studies. In contrast, because 18F-FDG PET response to such inhibitors may be cell context–dependent, it is therefore likely to be a less reliable biomarker.
DISCLOSURE STATEMENT
The costs of publication of this article were defrayed in part by the payment of page charges. Therefore, and solely to indicate this fact, this article is hereby marked “advertisement” in accordance with 18 USC section 1734.
Acknowledgments
We thank Alison Slater for her assistance with cell culture. This work was supported by a grant received from Pfizer Inc. No other potential conflict of interest relevant to this article was reported.
- © 2011 by Society of Nuclear Medicine
REFERENCES
- Received for publication December 21, 2010.
- Accepted for publication March 31, 2011.


Jump to section
Related Articles
Cited By...
- c-Met PET Imaging Detects Early-Stage Locoregional Recurrence of Basal-Like Breast Cancer
- PET of c-Met in Cancer with 64Cu-Labeled Hepatocyte Growth Factor
- Fluorodeoxyglucose-Based Positron Emission Tomography Imaging to Monitor Drug Responses in Hematological Tumors
- Fluorodeoxyglucose-Based Positron Emission Tomography Imaging to Monitor Drug Responses in Solid Tumors
- [18F]-FLT Positron Emission Tomography Can Be Used to Image the Response of Sensitive Tumors to PI3-Kinase Inhibition with the Novel Agent GDC-0941
- Crizotinib for the Treatment of ALK-Rearranged Non-Small Cell Lung Cancer: A Success Story to Usher in the Second Decade of Molecular Targeted Therapy in Oncology
- 3'-Deoxy-3'-18F-Fluorothymidine PET/CT to Guide Therapy with Epidermal Growth Factor Receptor Antagonists and Bcl-xL Inhibitors in Non-Small Cell Lung Cancer