


Abstract
The overexpression of P-glycoprotein (Pgp) is thought to be an important mechanism of pharmacoresistance in epilepsy. Recently, 11C-phenytoin has been evaluated preclinically as a tracer for Pgp. The aim of the present study was to assess the optimal plasma kinetic model for quantification of 11C-phenytoin studies in humans. Methods: Dynamic 11C-phenytoin PET scans of 6 healthy volunteers with arterial sampling were acquired twice on the same day and analyzed using single- and 2-tissue-compartment models with and without a blood volume parameter. Global and regional test–retest (TRT) variability was determined for both plasma to tissue rate constant (K1) and volume of distribution (VT). Results: According to the Akaike information criterion, the reversible single-tissue-compartment model with blood volume parameter was the preferred plasma input model. Mean TRT variability ranged from 1.5% to 16.9% for K1 and from 0.5% to 5.8% for VT. Larger volumes of interest showed better repeatabilities than smaller regions. A 45-min scan provided essentially the same K1 and VT values as a 60-min scan. Conclusion: A reversible single-tissue-compartment model with blood volume seems to be a good candidate model for quantification of dynamic 11C-phenytoin studies. Scan duration may be reduced to 45 min without notable loss of accuracy and precision of both K1 and VT, although this still needs to be confirmed under pathologic conditions.
Epilepsy is one of the most common neurologic disorders worldwide (1). Almost 30% of all patients who suffer from epilepsy do not respond to drug therapy (2). Nonresponse may be related to an overexpression of P-glycoprotein (Pgp). Pgp (3–5) is an efflux transporter, located at the blood–brain barrier, that transports substrates (including multiple central nervous system drugs) from the brain back into the blood and cerebrospinal fluid. The overexpression of Pgp is thought to be an important mechanism of pharmacoresistance in epilepsy (6,7). In refractory patients, this overexpression has been confirmed by examining brain tissue postmortem or after surgical removal (8,9). The development of noninvasive imaging methods that would allow for in vivo assessment of Pgp function in the brain is of great interest. Several studies have demonstrated that PET with 11C-radiolabeled Pgp substrates, such as (R)-11C-verapamil (3–5) or 11C-N-desmethylloperamide (11C-dLop) (10), is a promising imaging tool for in vivo assessment of Pgp function in the blood–brain barrier (7,11–13). Other tracers to measure Pgp expression, such as 11C-laniquidar (14,15) and 11C-tariquidar (16), have also been developed. These compounds are inhibitors at pharmacologic doses but act as substrates at tracer doses, and more work is needed to assess the utility of these tracers. High-affinity Pgp substrates have low brain uptake, limiting their suitability as a PET tracer for mapping regional Pgp overexpression, as this overexpression would reduce uptake even further. 11C-phenytoin, an antiepileptic drug, is a relatively weak Pgp substrate that is expected to show higher brain uptake, possibly resulting in PET images with better image quality. The slower washout and the fairly good stability of the tracer in plasma (as shown later) might allow for robust kinetic evaluations. The purpose of the present study was to identify a candidate model that may be used for kinetic evaluations (17). To assess Pgp in patients with pharmacoresistant epilepsy, a reliable quantification method for 11C-phenytoin needs to be developed. The aim of the present study was therefore to identify a potential candidate plasma input kinetic model that may be used for the quantification of 11C-phenytoin studies in humans and to establish its test–retest (TRT) performance.
MATERIALS AND METHODS
Subjects
Six healthy male volunteers (mean age, 28 y; age range, 21–32 y) were included. All subjects were extensively screened for medical history and underwent physical (including neurologic) examination and laboratory tests. Subjects were also screened for neurologic and psychiatric illness and history of drug abuse. Written informed consent was obtained from each subject after each was given a written and verbal description of the study. The study was approved by the Medical Ethics Review Committee of the VU University Medical Center.
Imaging Procedure
All subjects underwent 2 identical dynamic PET studies on the same day. Scans were performed on a Gemini TF PET/CT scanner (Philips). The properties of this scanner have been reported elsewhere (18). Before tracer injection, a low-dose CT scan was obtained. These data were used to correct the subsequent emission scan for photon attenuation. Next, a dynamic emission scan in 3-dimensional acquisition mode was started simultaneously with an intravenous injection of 345 ± 54 (mean ± SD) MBq of 11C-phenytoin with a specific activity of 72 ± 27 MBq·μmol−1. 11C-phenytoin was synthesized as described previously (17). The radiotracer was provided in a total volume of 7 mL and administered at a rate of 0.8 mL·s−1, followed by a flush of 42 mL of saline at 2.0 mL·s−1 using an infusion pump (Med-Rad). The scan was acquired in list-mode for 60 min. The list-mode data were later histogrammed into 20 frames with progressive increase in frame durations of 1 × 15, 3 × 5, 3 × 10, 4 × 60, 2 × 150, 2 × 300, and 4 × 600 s. During acquisition, patient movement was restricted by the use of a head holder and monitored by checking the position of the head using laser beams. All emission data were reconstructed using a line-of-response row-action maximum-likelihood algorithm, as provided by the scanner vendor. All corrections required for generating quantitative PET images, such as dead time, scatter, random, decay, and attenuation corrections, were applied. The image matrix size was 128 × 128 with 90 axial slices, resulting in a voxel size of 2 × 2 × 2 mm. The reconstructed spatial resolution was approximately 5 mm in full width at half maximum at the center of the field of view. After image reconstruction, patient motion (which may have occurred despite the use of the head holder) was assessed and corrected by a frame-by-frame alignment of the images using VINCI software (Max Plank Institute).
During the 60-min 11C-phenytoin scan, arterial blood was withdrawn continuously using an automatic online blood sampler (Veenstra Instruments) (19) at a rate of 5 mL·min−1 for the first 5 min and 2.5 mL·min−1 thereafter. At 2.5, 5, 10, 20, 30, 40, and 60 min after tracer injection, continuous blood sampling was interrupted briefly to withdraw 7 mL of manual blood samples. After each sample, the arterial line was flushed with a heparinized saline solution. In addition, all subjects underwent structural MR imaging using a 1.5-T Sonata scanner (Siemens Medical Solutions).
Blood Analysis
Manual samples were used to determine plasma–to–whole-blood radioactivity concentration ratios. In addition, concentrations of parent 11C-phenytoin and its radioactive metabolites in plasma were determined using the following procedure. One milliliter of plasma was diluted with 2 mL of water and passed over an activated Sep-Pak tC18 (Waters). After being rinsed with 3 mL of water, the cartridge was eluted with 1.5 mL of methanol and 1.5 mL of water. This eluate was vortexed and analyzed further using high-performance liquid chromatography (HPLC). The HPLC consisted of a Dionex Ultimate 3000, equipped with a 1.0-mL loop. A Phenomenex (Torrance) Gemini C18 10 × 250 mm 5-μm column was used. The mobile phase consisted of a mixture of acetonitrile and 0.1% trifluoroacetic acid in water. During analysis, a gradient was used so that the percentage of 0.1% trifluoroacetic acid in water was 90% at the start of analysis and 30% after 4 min. Flow of the mobile phase was 4.0 mL·min−1.
Plasma–to–whole-blood ratios and parent fractions were used in combination with the continuously collected whole-blood input curve to generate a metabolite-corrected plasma input function. Hill functions (20) were used to fit parent fractions and plasma-to-blood ratios.
Image Analysis
First, each MR image was coregistered with the corresponding PET image using VINCI software. Next, volumes of interest (VOIs) were defined using an automated method based on a VOI template (PVElab) (21) that consisted of 67 regions covering the entire brain (22). Gray and white matter segmentation of the coregistered MR image was performed using statistical parametric mapping (version 8, SPM8), which is incorporated in the PVElab software. Finally, gray matter time–activity curves were generated by projecting all VOIs onto the dynamic PET data.
Kinetic Analysis
Various compartment models were tested (23), such as plasma-input single-tissue-compartment models without (1T2k) and with (1T2k + Vb) blood volume parameter, and plasma-input 2-tissue-compartment models with irreversible (2T3k) and reversible (2T4k) kinetics, both with and without additional Vb. In addition, 1T2k, 2T3k, and 2T4k models with Vb fixed to 5% were tested as well.
Models were fitted to gray matter time–activity curves using standard nonlinear regression analysis. Fitting routines were developed in-house using Matlab software (The MathWorks). For each of the fits, the Akaike information criterion (AIC) (24) was calculated. For each time–activity curve, the preferred model was selected on the basis of the lowest AIC across all models. The frequency of AIC preferences for each model (pooled over all subjects) was then derived, and the model with the highest overall frequency was selected as the preferred model. Model preferences were evaluated separately for both small (≤5 mL) and large (>5 mL) VOIs. In addition, an F test (25) was used to assess whether models with more kinetic parameters were preferred over those with fewer. Finally, kinetic analysis was repeated for shorter scan intervals to investigate the impact of scan duration on model preference and parameter estimates and to obtain an estimate of the minimally required scan duration for reliable quantification.
TRT Variability
After kinetic analysis, TRT variability of all kinetic parameters was calculated. TRT variability was calculated as the difference between test and retest kinetic parameters divided by their mean times 100%. The Student t test was used to assess the impact of different scan durations and VOI size on TRT of the plasma to tissue rate constant (K1) and volume of distribution (VT). Moreover, Bland–Altman plots (26) of the kinetic parameters were generated to illustrate differences between test and retest values.
RESULTS
PET Image and Blood Data Analysis
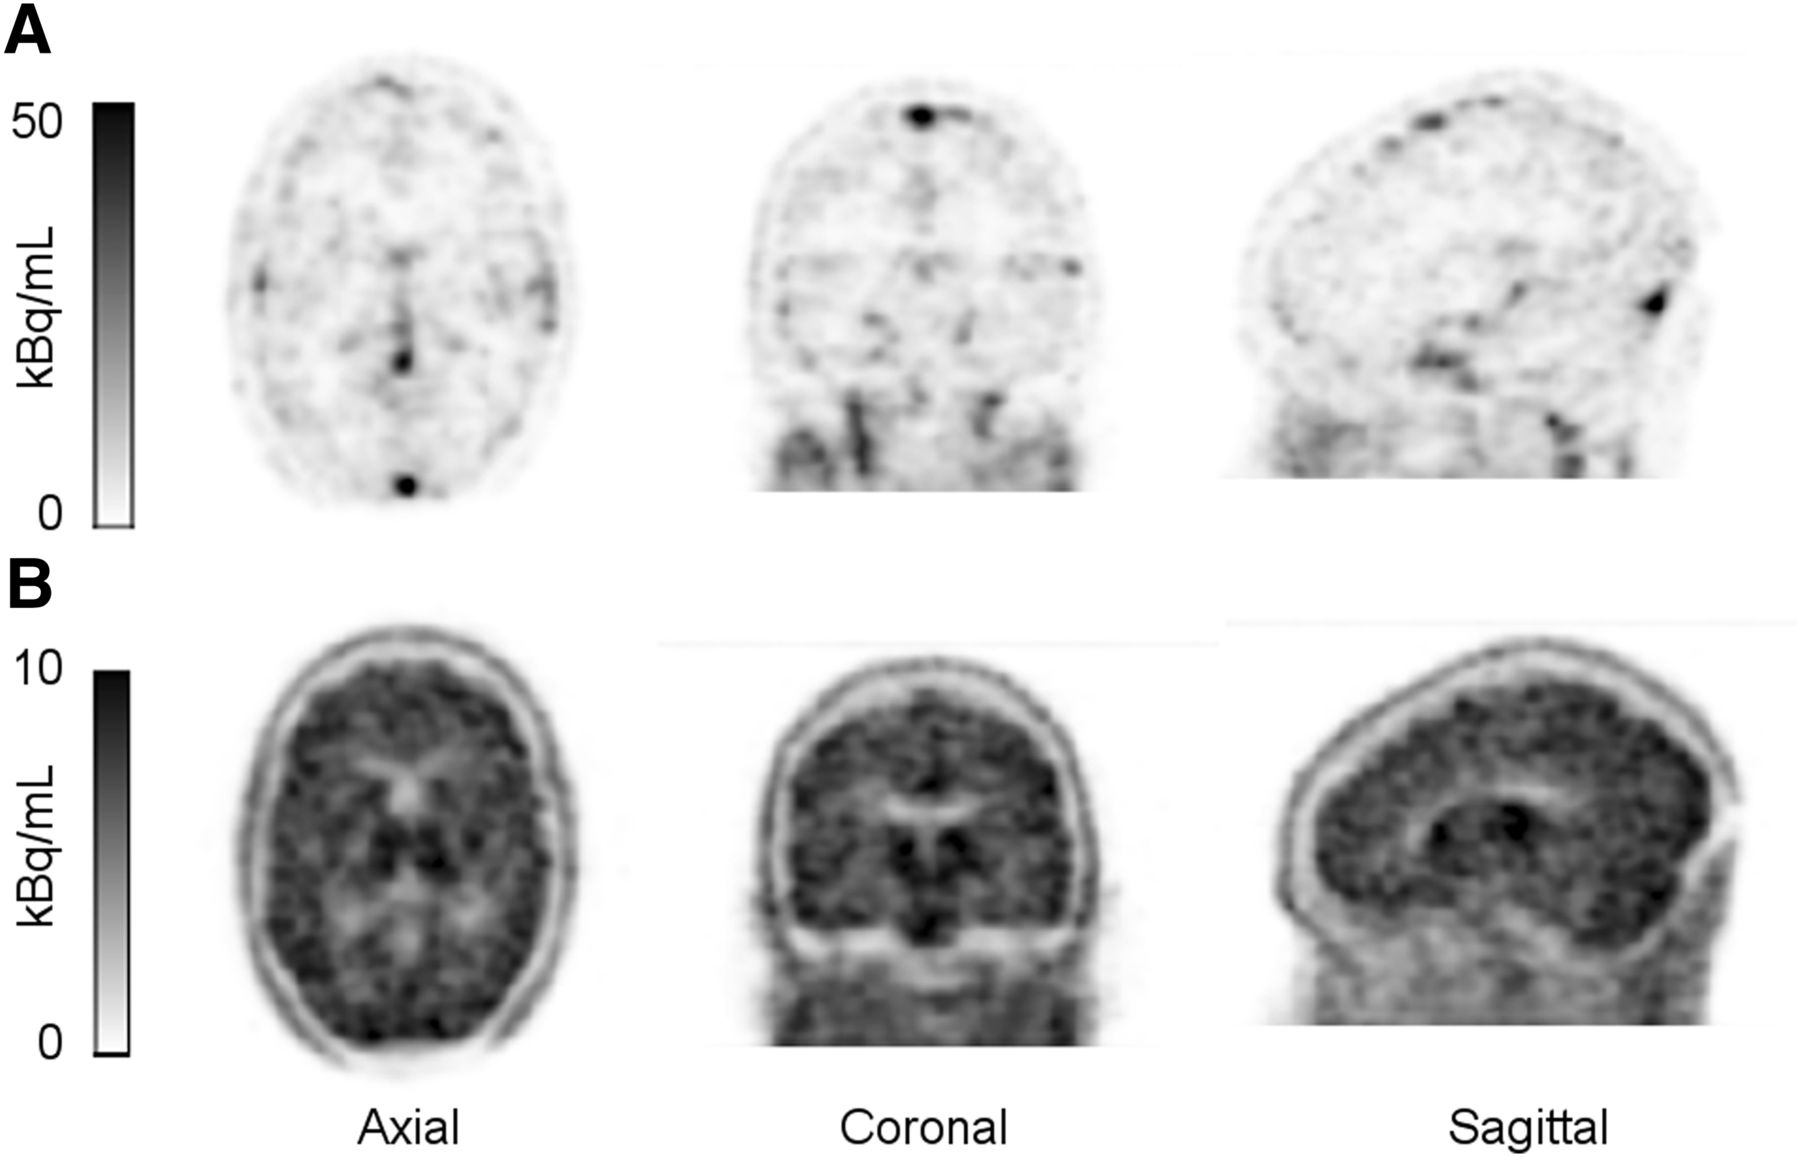
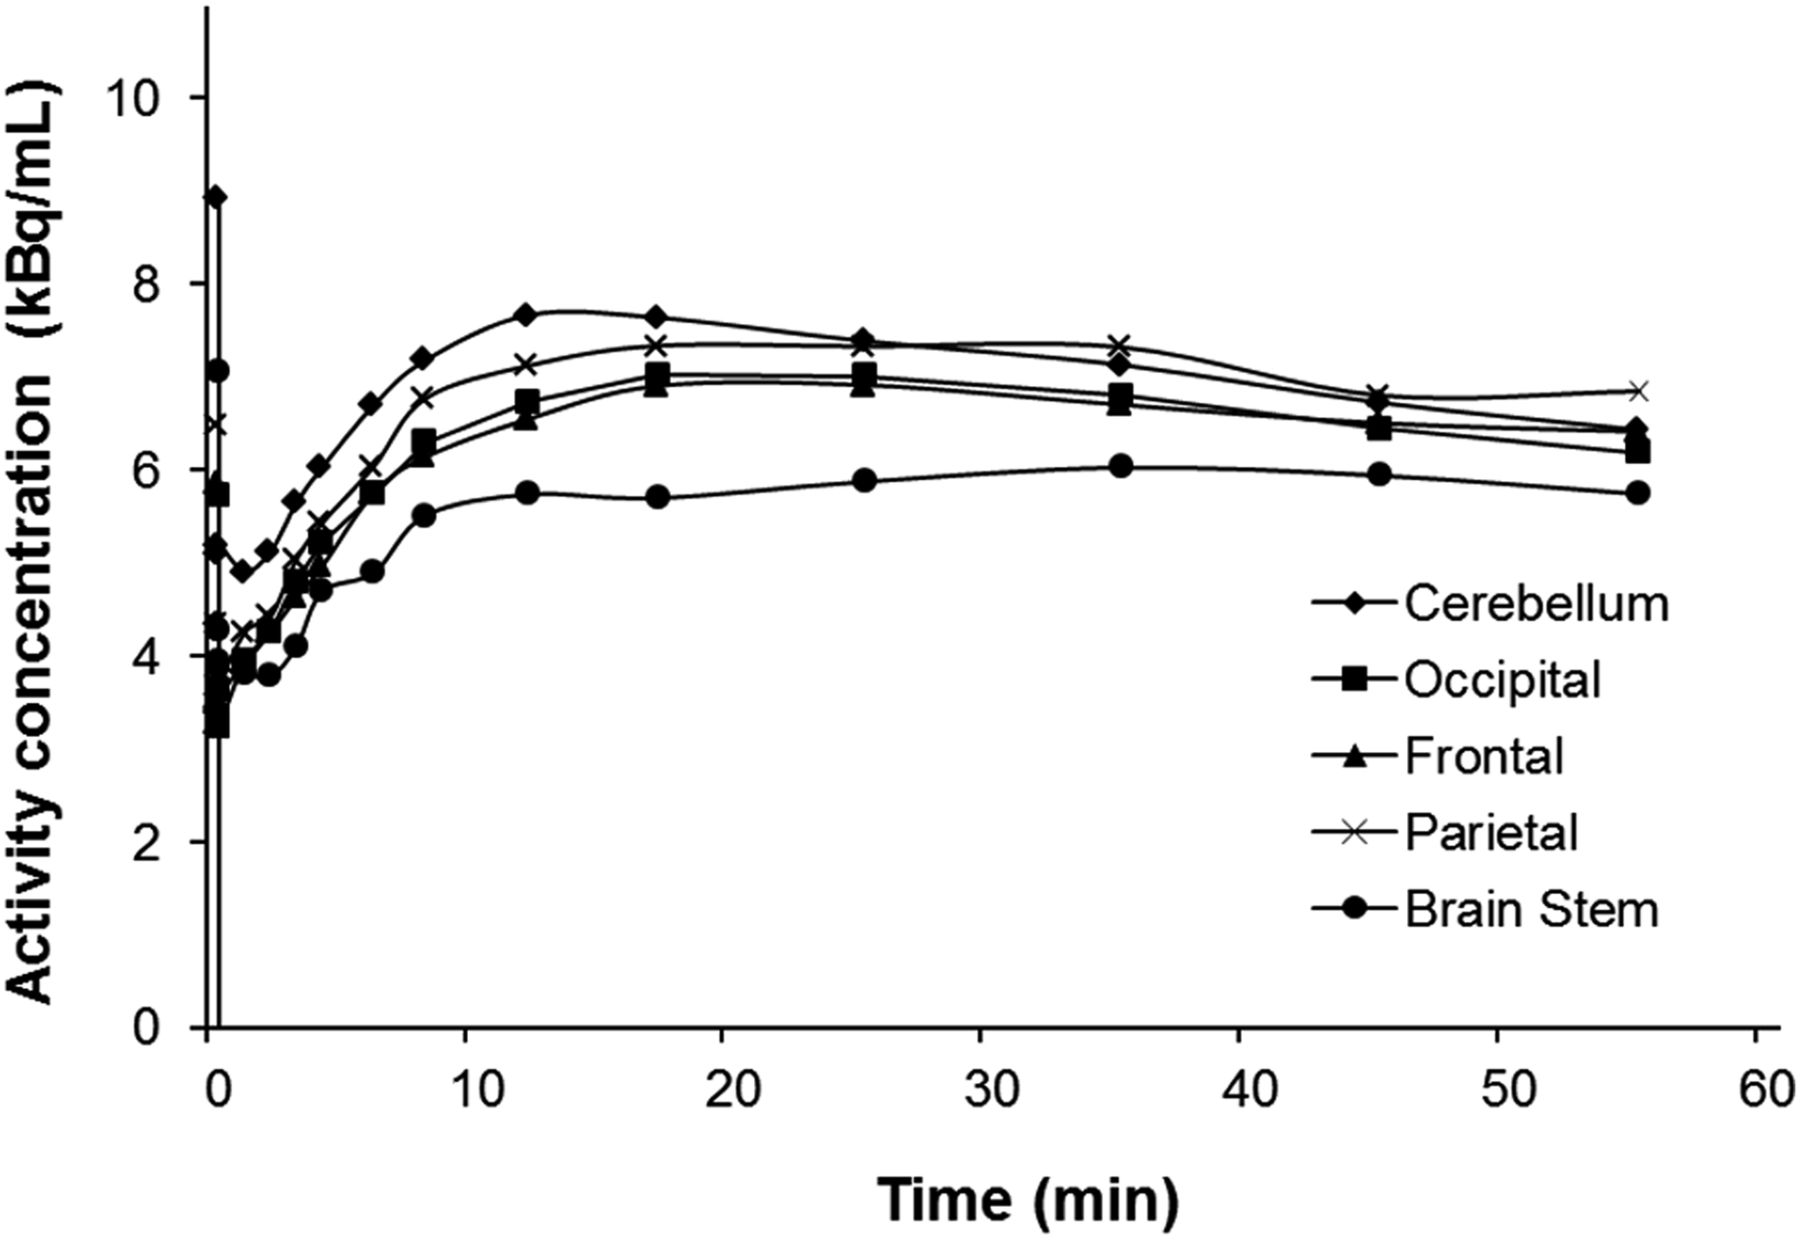
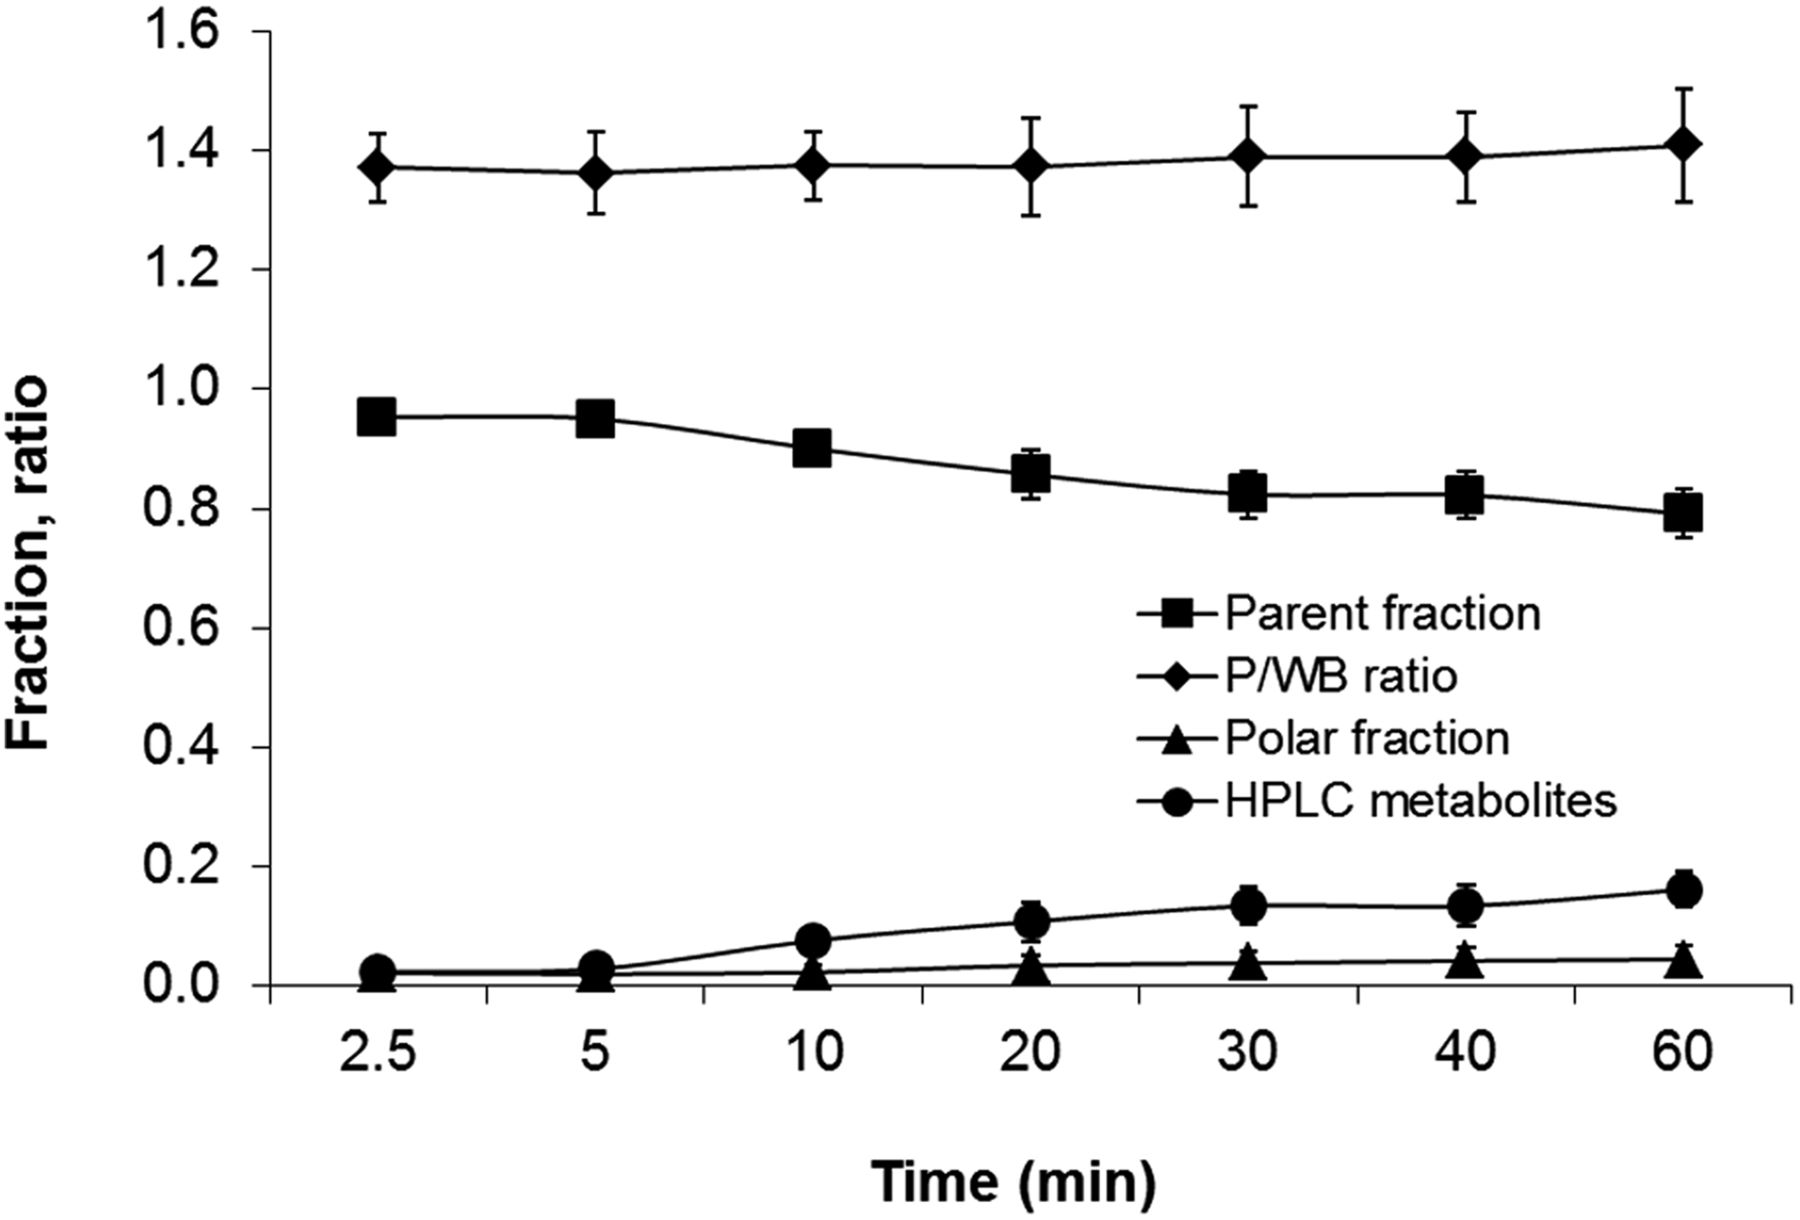
A typical 11C-phenytoin uptake image, averaged over the frames collected from 25 to 90 s after injection and averaged over frames from 45 to 60 min after injection are shown in Figure 1, illustrating the distribution of 11C-phenytoin uptake at different uptake intervals throughout the brain. Time–activity curves for several regions of interest are shown in Figure 2. Various fits for the whole-brain gray matter time–activity curve are shown in Supplemental Figure 1 (supplemental materials are available at http://jnm.snmjournals.org). Average plasma–to–whole-blood ratios, parent fractions, and polar and nonpolar metabolite fractions are presented in Figure 3. The plasma–to–whole-blood ratio was relatively constant over time, ranging from about 1.3 to 1.4. The parent fraction of 11C-phenytoin in plasma slowly decreased to 79% ± 4% at 60 min, whereas nonpolar and polar metabolite fractions increased from 2.3% ± 2.1% and 2.1% ± 1.8% at 2.5 min to 16.1% ± 3.1% and 4.4% ± 2.2% at 60 min, respectively. At present, these radiolabeled metabolites have not yet been characterized.

Typical 11C-phenytoin activity concentration images obtained in healthy subject, averaged over several early frames (30–90 s after injection) (A) and late frames (45–60 min after injection) (B).

Example of decay-corrected time–activity curves of 11C-phenytoin for several brain regions in healthy subject.

Mean and SD (error bar) of parent and polar fractions, plasma–to–whole-blood ratio (P/WB), and HPLC metabolites obtained from manual blood samples.
Compartmental Modeling
Four of the 6 compartment models fitted both test and retest data well. AIC preference percentages are shown in Table 1 for both test and retest scans. As can be seen, the 1T2k + Vb model was preferred in most cases, followed by 2T3k + Vb and 2T4k + Vb models. This preference was seen regardless of the volume of the VOIs as shown in Table 1. A Vb was required for all models tested. This model was preferred across all subjects studied for each individual region—that is, we could not identify a specific region with a different preference. Although models with a fixed blood volume fraction of 5% were also evaluated, the 1T2k + Vb model using Vb as fit parameter was still preferred. AIC preferences were confirmed by F test scores that showed that for more than 60% of the time–activity curve the simpler model (1T2k + Vb) was favored over more complicated ones. In Supplemental Figure 2, K1 and VT data are given for various regions across the brain. As can be seen, K1 and VT values are reasonably comparable across the gray matter regions shown and correspond to the distributions seen in the early and late uptake images shown in Figure 1.
Preference Frequency (%) According to Akaike Information Criteria for Small (<5 mL) and Large (>5 mL) VOI Sizes
TRT Repeatability
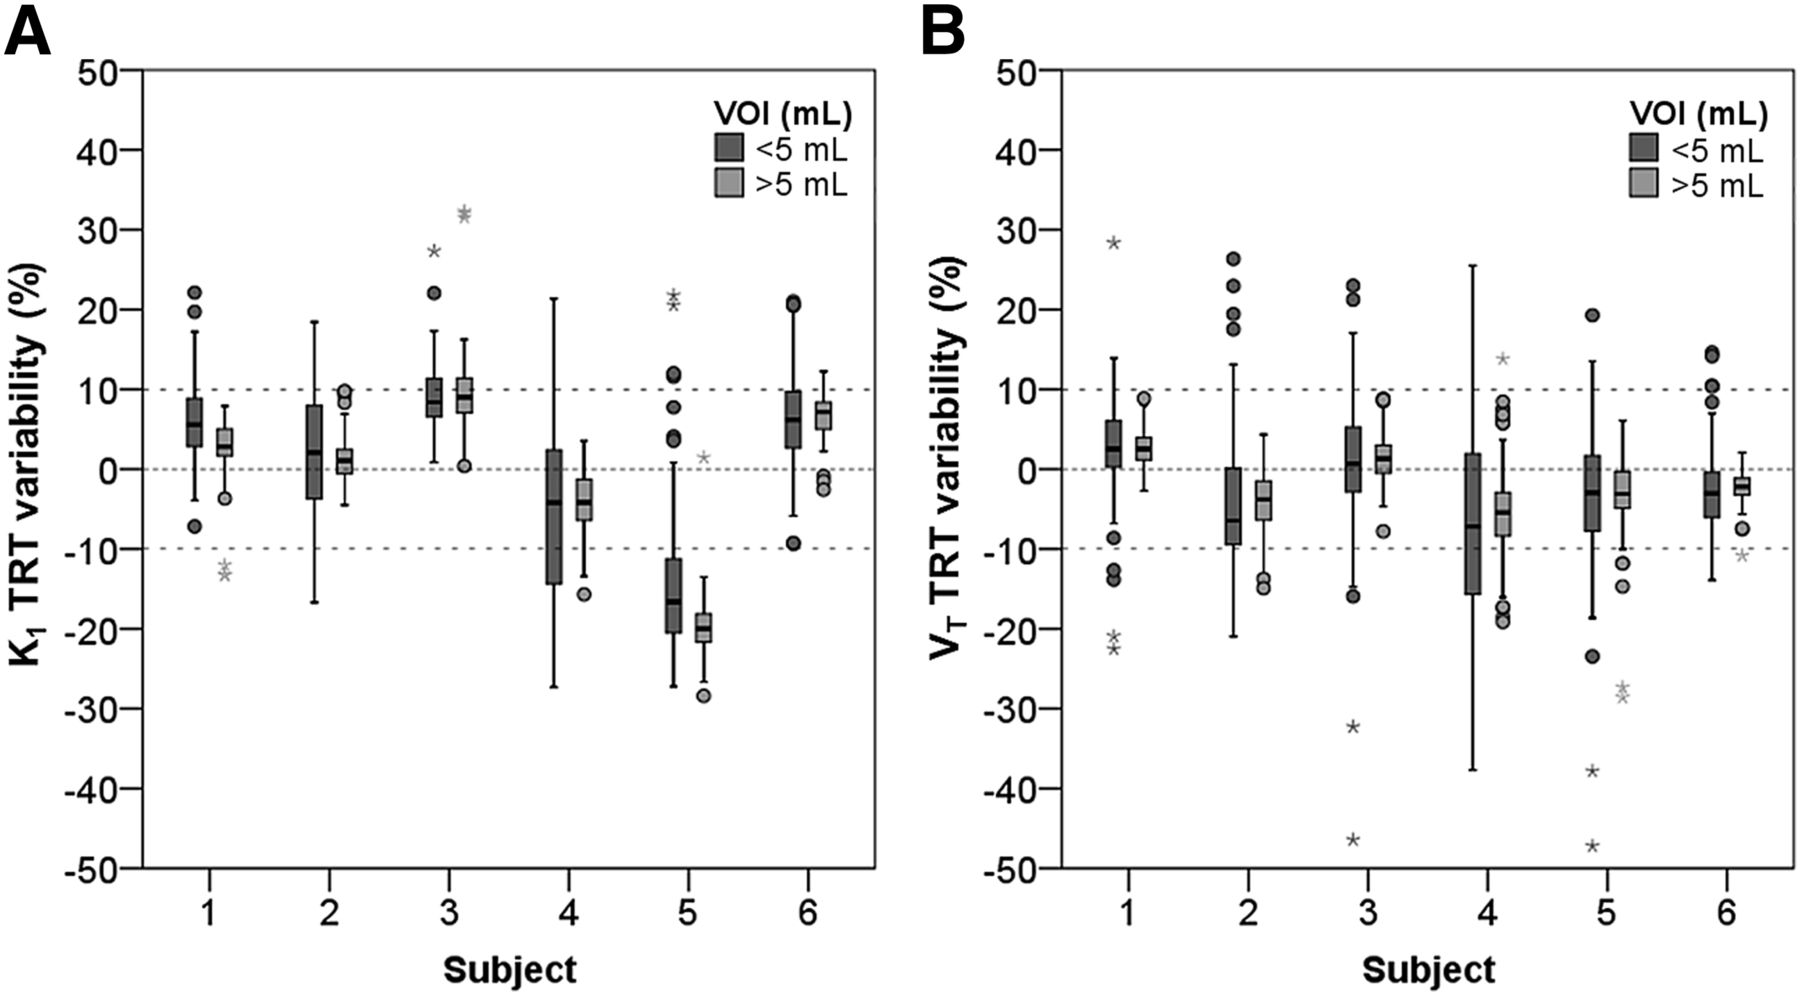
Figure 4 shows box plots of percentage differences between test and retest scans for K1 and VT values, respectively, obtained using the 1T2k + Vb model. Results are provided per patient for both small (≤5 mL) and large (>5 mL) VOIs. In general, the median percentage differences between test and retest studies were about 10%, except for subject 5 who showed up to 20% of TRT variability for K1 (Fig. 4A). A somewhat wider range (larger interquartile range) in TRT variability of both K1 and VT (Fig. 4B) was observed for small compared with large VOIs, but this difference is not statistically significant (t test, P > 0.05). Individual TRT variabilities are provided in Table 2.

TRT variability of K1 (A) and VT (B) for each subject for small (<5 mL) and large (>5 mL) region-of-interest volumes.
TRT Variabilities for K1 and VT for Each Individual Subject, Given as Average (±SD) Percentage Repeatability Across All VOIs
Impact of Scan Duration
Supplemental Figure 3 shows fair to good correlations of 1T2k + Vb–derived K1 and VT values for shorter scan durations (45 and 30 min) with those obtained for 60-min scans. In the case of K1, the correlation was slightly better for 45- than for 30-min data for both test and retest scans (Supplemental Figs. 3A and 3B). The same was true for VT, although the difference between 45 and 30 min was larger (Supplemental Figs. 3C and 3D). Although there were fair to good correlations between 45- and 30-min data and those of 60 min, a significant difference in the correlation of VT was seen when the scan duration was reduced to 30 min (P < 0.05). Table 3 shows the summary information of correlation between different scan durations.
Summary of Correlation Parameters Between Data from Different Scan Durations (45 and 30 Minutes) Versus 60 Minutes
TRT data are shown as Bland–Altman plots in Figure 5, and percentage TRT repeatability for individual patients is shown in Figure 6 for both K1 (Fig. 6A) and VT (Fig. 6B). It can be seen that shortening the scan duration from 60 to 45 min did not substantially affect the TRT variability of K1 and VT.

Bland–Altman plots of K1 (A–C) and VT (D–F) test–retest data for 60- (A and D), 45- (B and E), and 30- (C and F) min scan durations. ○ = 60-min scan duration data; □ = 45-min scan duration data; △ = 30-min scan duration data; bold line = mean difference between test and retest.

TRT variability of K1 (A) and VT (B) for each subject and for different scan durations.
DISCUSSION
Compared with previous preclinical studies in rats (17), the metabolism of 11C-phenytoin in humans was relatively slow, with 79% of the original tracer still intact at 60 min after injection. The parent fraction was higher than that of other, more avid Pgp substrates, such as (R)-11C-verapamil, with 50% intact parent tracer at 60 min (27). In addition, parent fractions of 11C-phenytoin were comparable across subjects, as indicated by the small variability (SD) shown in Figure 3. This small intersubject variability and the slow metabolism of 11C-phenytoin may allow for the use of a plasma input function without additional metabolite analysis, for example, using a population average approach for the parent fraction. However, this approach was not (yet) evaluated because of the small number of subjects and it should also be noted that 11C-phenytoin metabolism may be affected by treatment or be different in patients. Variability in tracer metabolism first needs to be investigated under these conditions before population-based approaches can be used. Nevertheless, 11C-phenytoin seems to have a favorable metabolic profile.
In this study, we evaluated a possible suitable candidate model to analyze 11C-phenytoin kinetics. Among various models investigated, the single-tissue-compartment model with 2 kinetic parameters and an additional blood volume fraction parameter was the preferred plasma input model in 60%–70% of cases (Table 1). Moreover, this model was preferred across all subjects studied for each individual region, and it is therefore the model of choice for quantification of dynamic 11C-phenytoin studies. The preference for the 1T2k + Vb model was more pronounced than in the case of (R)-11C-verapamil, where it was preferred in only 15% of the cases (27). The preference for a model with a limited number of fit parameters in combination with slow tracer metabolism in plasma suggests that robust quantification of 11C-phenytoin studies is feasible. Feasibility was confirmed by the observed good TRT performances, as discussed later.
The present study was performed to identify a possible suitable candidate plasma input kinetic model for 11C-phenytoin and, subsequently, to test its performance with respect to repeatability using test and retest scans in healthy subjects. In general, TRT repeatability of K1 and VT was small—that is, on average within 10%—and comparable with that seen for (R)-11C-verapamil (27). TRT of K1 of subject 5, however, equaled about 17%. This particular case could be explained by a lower parent fraction during the initial part (5 min) of the PET scan for only 1 of the scans. When the parent fraction was set to a higher value (i.e., equal to the average of all other subjects), TRT variability improved to within 10%. The observed poor K1 TRT of about 17% of this subject seems therefore to be caused by a measurement error in the parent fraction. Larger regions of interest (>5 mL) showed a smaller interquartile range for TRT than smaller regions of interest, but this difference was not significant (t test, P > 0.05). Because compartmental model analysis is sensitive to noise, an increase in TRT can be expected when using smaller regions of interest.
Reducing the scan duration to 45 or 30 min resulted in VT estimates that were similar to those obtained from the entire 60 min of data, with somewhat higher correlation coefficients for the 45-min data (Figs. 6C and 6D). In addition, for none of the subjects TRT performances of both K1 and VT were substantially affected by changing scan duration. However, there was a significant difference in VT TRT (P < 0.05) for 30- versus 60-min data. Yet, TRT variability was, on average, less than 10% for both VT and K1 in most subjects.
It can be concluded that 11C-phenytoin dynamic PET studies in healthy subjects can be performed using 45-min scan durations without significantly affecting accuracy and TRT performance of both K1 and VT estimates. However, for patients and for studies after pharmacologic blocking of Pgp or during treatment, the washout of 11C-phenytoin may be reduced or tracer metabolism might be different and longer scan durations may still be required, which need to be clarified in future studies.
Results of this first-in-human PET study showed good agreement with observations of a previous preclinical study (17). In particular, the present study confirmed good tracer characteristics of 11C-phenytoin—that is, high metabolic stability in plasma and robust kinetics, with a maximum brain uptake approximately 20 min after bolus injection. Results from the present study also indicate that 11C-phenytoin has slower ingrowth of labeled metabolites in plasma and a higher VT than (R)-11C-verapamil (28). K1 was similar to that of (R)-11C-verapamil and 3-fold higher than that of 11C-dLop (10). In addition, the efflux rate (k2) of 11C-phenytoin was approximately 60% lower than that of (R)-11C-verapamil (28) and about 4-fold higher than that of 11C-dLop. However, k2 values of the various tracers cannot be directly compared with each other because of the use of different kinetic models. VT of 11C-phenytoin was found to be approximately 25% lower than that of 11C-dLop and 30% higher than that of (R)-11C-verapamil. The distribution of VT of 11C-phenytoin was fairly uniform across the various gray matter brain regions and comparable to that seen with (R)-11C-verapamil. A summary of various kinetic parameters is presented in Table 4. Among the 3 presented tracers, 11C-phenytoin seems to demonstrate a high first-pass extraction fraction (by the fairly high K1 values), resulting in high tracer brain uptake and intermediate-high VT, because of the low k2 values, and low plasma metabolism, which might explain the robust kinetic analysis and good TRT performances seen so far.
Comparison of Some Kinetic Parameters for 11C-Phenytoin, (R)-11C-Verapamil, and 11C-dLop
In the present study the kinetic properties of 11C-phenytoin were assessed, and a possible suitable candidate model for quantitative analysis was established. Nevertheless, further studies will be needed to assess whether 11C-phenytoin is a useful tracer and whether the preferred candidate model is suitable for investigating Pgp function under pathologic conditions. Moreover, PET studies using a Pgp inhibitor, such as with high doses of laniquidar or tariquidar, could be performed to assess whether 11C-phenytoin PET can measure and quantify changes in Pgp function. The TRT data from the present study will be of relevance for interpretation of those intervention studies.
CONCLUSION
11C-phenytoin kinetics seem to be well represented by a plasma-input, single-tissue-compartment model with an additional fitted blood volume fraction parameter. Yet, this finding remains to be verified under pathologic conditions. 11C-phenytoin is stable in plasma, with about 80% of intact tracer at 1 h after injection. Scan durations can be reduced to 45 min without notable loss in accuracy and precision, although this needs to be validated under pathologic conditions or during treatment. Observed TRT performances for K1 and VT are comparable to those seen with various other tracers (<10%, on average).
DISCLOSURE
The costs of publication of this article were defrayed in part by the payment of page charges. Therefore, and solely to indicate this fact, this article is hereby marked “advertisement” in accordance with 18 USC section 1734. This work was supported by the European Union Seventh Framework Program EURIPIDES (FP7/2007-2013 under grant agreement no. 201380). Additional support was provided by a scholarship from the Malaysian Ministry of Education and University Sains Malaysia. No other potential conflict of interest relevant to this article was reported.
Footnotes
Published online Jul. 1, 2015.
- © 2015 by the Society of Nuclear Medicine and Molecular Imaging, Inc.
REFERENCES
- Received for publication March 22, 2015.
- Accepted for publication June 23, 2015.


Jump to section
Related Articles
Cited By...
- Imaging the Activity of Efflux Transporters at the Blood-Brain Barrier in Neurologic Diseases: Radiotracer Selection Criteria
- Impact of P-Glycoprotein Function on the Brain Kinetics of the Weak Substrate 11C-Metoclopramide Assessed with PET Imaging in Humans
- Parametric Methods for Dynamic 11C-Phenytoin PET Studies
- Flutriciclamide (18F-GE180) PET: First-in-Human PET Study of Novel Third-Generation In Vivo Marker of Human Translocator Protein
- Imaging the Impact of the P-Glycoprotein (ABCB1) Function on the Brain Kinetics of Metoclopramide