


Abstract
Emission tuned-aperture computed tomography (ETACT) is a new approach to acquiring and processing scintimammography data. A gamma camera with a pinhole collimator is used to acquire projections of the radionuclide distribution within the breast. Fiducial markers are used to reconstruct these projections into tomographic slices. Simulation and phantom experiments were performed to evaluate the potential of the ETACT method. Methods: In the simulation study, a hemispheric object of 15 cm in diameter was constructed to model a breast. A ray-tracing technique was used to generate ideal projections. These were blurred and noise was added to create images that resemble scintigraphic images. Tumor size, pinhole size, and target-to-nontarget radioactivity ratios (TNTs) were varied. The simulated projections were reconstructed into slices, and contrast and contrast-to-noise ratios were calculated to evaluate the effect of pinhole size. These results were compared with a simulated planar acquisition of the same object. A preliminary phantom evaluation was performed using an 8-mm “tumor” with a 10:1 TNT to validate the simulation results. Results: A 3-mm pinhole was shown by the simulation study to be the optimal size. The ETACT images consistently yielded higher contrast than simulated planar images. The phantom study validated the simulation results and showed the feasibility of ETACT in a simulated clinical environment. Conclusion: ETACT is shown to be useful for imaging tumors <1 cm in diameter. Because ETACT requires only a gamma camera with a pinhole collimator, it has the potential to be applied in any hospital in a simple, flexible, and practical manner.
Breast cancer is the most common malignancy among women in the United States (1). Every year, more than 185,000 lives are impacted as a result of breast cancer and 44,000 die of the disease (2). Patients with breast cancer diagnosed at a localized stage experience a survival rate of 90%, whereas the rate is <20% if the cancer has spread to 1 or more distant sites (3). Early detection, therefore, plays an essential role in the fight against breast cancer. Although mammography is currently the best imaging approach for breast cancer screening, several factors may limit its accuracy. Dense breasts, breast implants, or scars may either resemble a tumor or hide true small tumors on the mammogram. As a result, false-positive as well as false-negative incidents are increased. Mammography has a relatively high sensitivity (88%), although dense or large breasts may reduce this. However, it has a low specificity (67%) (4).
Scintimammography using 99mTc-labeled sestamibi has been shown to have high sensitivity and specificity (93.7% and 87.8%, respectively) for tumors >1.5 cm (5). However, in its current implementation, the limited spatial resolution of the gamma camera limits the sensitivity and specificity for tumors <1 cm (6). We are developing a new approach to detect early stages of breast cancer with scintimammography called emission tuned-aperture computed tomography (ETACT). ETACT uses pinhole collimation and limited angle tomography to potentially improve the contrast of small tumors. In this article, we describe the ETACT method and present some preliminary simulation and phantom investigations of this approach.
ETACT is based on the tuned-aperture computed tomography (TACT) method developed by Webber et al. (7). Consider the tomographic method known as tomosynthesis (8). In tomosynthesis, several planes through an object are reconstructed from a small number of 2-dimensional (2D) projections. This technique is illustrated in Figure 1. A series of coplanar x-ray sources form a circular pattern. A disk and a square are located between the source and detector planes. Each source projects the 2 objects onto the detector plane, resulting in a series of projections. By shifting by the appropriate amount and then adding these projections, any plane through the object can be reconstructed. For instance, if all projections are shifted so that the centers of the disk in all images are aligned and the projections are then added together, the result is the slice that contains the disk being reconstructed. Note that the square object is out of focus in this plane. However, by shifting such that the squares align and then adding, the plane through the square can also be reconstructed. In this fashion, any slice through the object can be created, and a 3-dimensional (3D) representation of the object is constructed. In tomosynthesis, the amount to shift the projections before addition is determined from the known location of the x-ray sources.

Tomosynthesis is imaging technique that shifts and adds series of 2D projections to construct 3-dimensional image. Point sources of each projection are coplanar, leading to linear shifting and adding of projections. Through shifting and adding process, any arbitrary slice through object can be reconstructed. (Reprinted with permission of (7).)
In TACT, the imaging geometry is more flexible and the source is not restricted to 1 plane. This allows more freedom to “tune” the projections to each situation, thus optimizing the reconstruction. As a result of this loosened geometry, fiducial markers are needed to compensate for the extra degrees of freedom. First, consider the sources to be located in a plane parallel to the detector plane, but with unknown position within that plane, as shown in Figure 2. A single fiducial marker is used. If all projections are added without shifting, we are reconstructing the detector plane. The centroid of the fiducial marker locations in all projections is then calculated. The projections are shifted such that the locations of the fiducial marker in the different projections align with the centroid and are then added together. The result is the reconstruction of the slice containing the fiducial marker as shown in Figure 2. To reconstruct a slice one third of the way between the marker and the detector plane, the projections are shifted two thirds the distance between their initial location and the centroid and added together. In this fashion any arbitrary slice can be reconstructed and a 3D representation of the object is constructed (7).

Demonstration of concepts of TACT. Five x-ray source locations are coplanar but arbitrary and unknown. One fiducial marker is used. Five projections of object are obtained. If projections are added without shifting, object at detector plane is reconstructed. Centroid of 5 marker locations is determined. If all projections are shifted such that marker locations align with centroid and projections are then added, plane containing fiducial marker is reconstructed. To reconstruct plane one third of way from marker to detector plane, projections are shifted two thirds of distance from their initial location toward centroid and then added. In this manner, any arbitrary plane can be reconstructed and 3D representation of object is obtained.
Now consider a situation in which the source locations are not coplanar and their locations are unknown. In this case, at least 5 fiducial markers (e.g., 4 coplanar and 1 out of plane) are needed. The 4 coplanar markers are used to apply a projective transformation between the projections and a reference image. This provides a correction for skewing and a first-order correction for magnification. The magnification correction applies only to the plane containing the 4 fiducial markers and does not correct for the differential magnification between planes. Once this transformation has been applied to the projections, they can be treated as if they were acquired with coplanar sources and the fifth, out-of-plane fiducial marker is used to reconstruct the data as described previously (i.e., shifting and adding). TACT has been used successfully in a variety of radiographic applications including dental radiography and mammography (7,9).
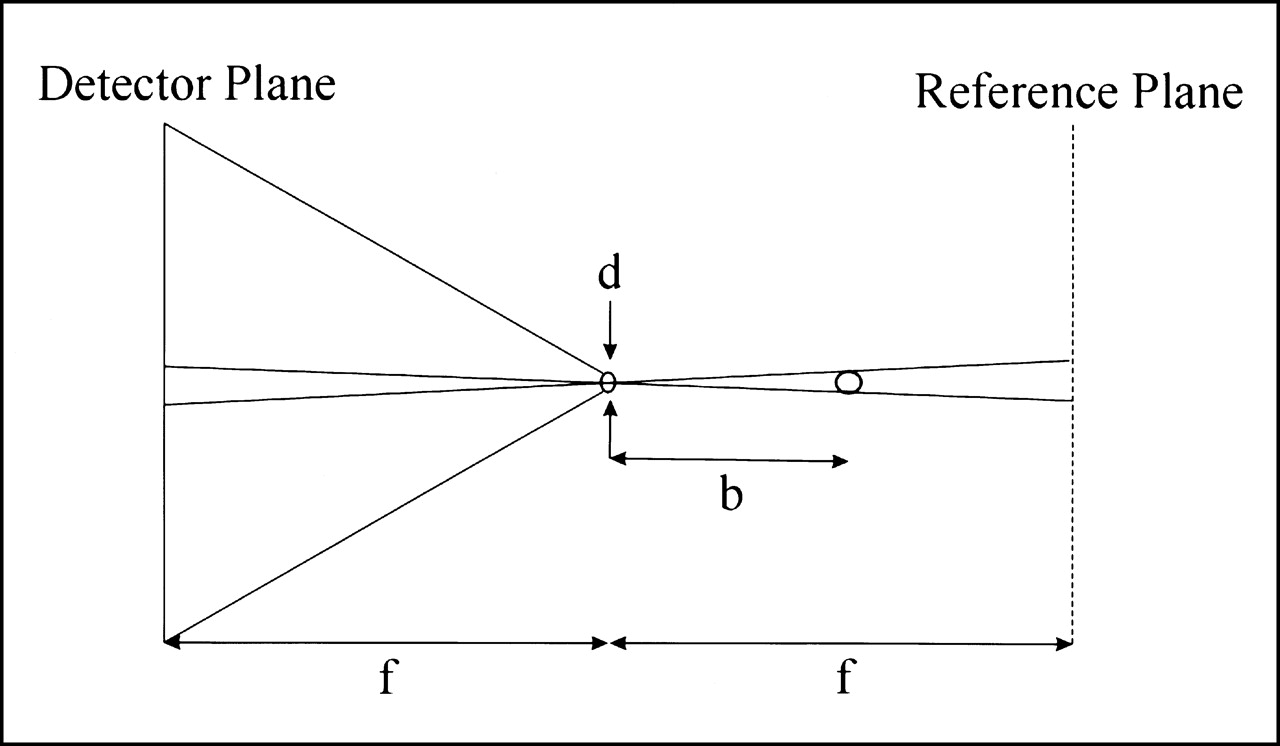
ETACT is emission TACT, which combines the concept of TACT with nuclear medicine imaging. A radiopharmaceutical is injected into the patient and imaged with a gamma camera using a pinhole collimator. In this geometry, the x-ray source in TACT is replaced with the pinhole collimator. The detector plane is the surface of the NaI detector. A reference plane is defined that is parallel to the detector plane and equidistant to the pinhole but on the opposite side, as shown in Figure 3. The pinhole location is not restricted to 1 plane. This allows the freedom to choose projection angles, which will be optimized for each specific imaging situation. The 5 fiducial markers are radioactive in ETACT. After the projective transformation of the projections (using the 4 coplanar markers), adding the projections without shifting reconstructs the reference plane. Shifting all projections so that the fifth fiducial marker locations in all images align with their centroid reconstructs the plane parallel to the reference plane and containing the fifth marker. Shifting the projections a set fraction of that amount reconstructs the plane that is that fraction of the distance between the fifth fiducial marker and the reference plane. Therefore, ETACT can reconstruct any number of slices and thereby generate a 3D representation of the object.

Similarity between TACT and ETACT geometry, where d is pinhole diameter, b is pinhole-to-object distance, and f is distance from pinhole to both detector and reference planes. In ETACT, reference plane is parallel to detector plane and same distance from pinhole, but on opposite side of pinhole. In ETACT, pinhole is analogous to source in TACT.
Potential benefits of ETACT arise from both the use of pinhole collimation and the flexibility of the ETACT acquisition. In the first case, the pinhole collimator provides superior spatial resolution to that of a parallel-hole collimator. For a pinhole-to-detector distance of 25 cm, a pinhole diameter of 4 mm, and an intrinsic spatial resolution of 3.5 mm, the pinhole system spatial resolution is approximately 6.0 mm compared with that of planar and SPECT imaging with a high-resolution collimator, which would be approximately 7.5 and 10 mm, respectively. This increased spatial resolution will lead to enhanced contrast of small tumors attributed to a reduction in the partial-volume effect. Second, the sensitivity of the pinhole collimator is inversely proportional to the square of the pinhole-to-object distance, whereas the sensitivity of a parallel-hole collimator does not vary with distance. Therefore, the pinhole collimator will be less sensitive to activity in objects behind the breast such as the myocardium or the liver. For example, if we assume that radioactivity in the tumor and myocardium is located 7 and 14 cm from the pinhole, respectively, then the system will be 4 times more sensitive to activity in the tumor than it is to the myocardium.
The advantage of ETACT over other tomographic methods is that the 3D resolution as well as the signal to noise can be “tuned” to specific diagnostic tasks through purposeful manipulation of the data-sampling strategy. This is analogous to altering one’s vantage point to optimize the viewing of a scene or manipulating the optical aperture of a camera to adjust the depth of focus to best fit the imaging task at hand. Therefore, the projections obtained during an ETACT acquisition can be chosen to avoid signals from other organs such as the heart or liver or to enhance the tomographic capability for challenging imaging tasks such as the detection of small tumors near the chest wall.
On the basis of both of these factors, ETACT has the potential to enhance the detection of small tumors in the breast. Pinhole collimation enhances system spatial resolution and degrades the contribution of signal from other organs, and TACT reconstruction further enhances the contrast of these small structures. The result should be an overall increase in the signal-to-noise ratio (SNR) and, thereby, detectability for small tumors. Clinically, this should result in improvements in sensitivity and specificity for the detection of breast tumors <1 cm in diameter.
MATERIALS AND METHODS
Simulation Experiments
Simulation studies were used to determine the optimal pinhole size for ETACT. An object was designed whose shape resembled that of a hemispheric breast, 15 cm in diameter. A spheric tumor was placed in the center of the breast. The tumor was assigned a diameter of 5, 7.5, or 10 mm. Five fiducial markers were placed to the lateral side of the breast. Four of the markers were coplanar (parallel to a sagittal plane through the breast) and formed a square, 5 × 5 cm, whereas the fifth fiducial marker was out of the plane by 1 cm. The target-to-nontarget radioactivity ratio (TNT) was also defined. In various simulations the TNT was 5:1 (i.e., the tumor was 5 times as “hot” as the rest of the breast), 7.5:1, 10:1, 12.5:1, or 15:1. The 3D object was represented as a series of 40 equally spaced slices. Projections of this object were generated using a ray-tracing technique (10). The detector was defined as a 500 × 500 mm square to ensure that all projections would be within the field of view. The pinhole-to-detector and pinhole-to-object (tumor) distances were 25 and 15 cm, respectively. A symmetric set of angles was used to take 7 projections of the object. The first image was a straight lateral view of the breast. From the straight lateral, let the angle θ describe the amount of caudal tilt and the angle φ describe the amount of rotation about the long axis of the body. The other 6 projections were acquired in a hexagonal pattern with each view 15° from the straight lateral as described in Table 1. Note that θ = 10° and φ = 10° lead to an angle from the straight lateral of about 15°. These 7 projections were considered “ideal,” meaning no blurring or noise was added. These projections were then blurred and noise was added, depending on the pinhole size, which was varied: 1, 2, 3, 4, 5, and 6 mm in diameter. The blurring was accomplished by convolving the projections with a gaussian kernel having SD σ with:


 where d is the pinhole diameter, f is the pinhole-to-detector distance, b is the pinhole-to-object distance, M is the magnification factor, RI is the intrinsic resolution, Rsys is the system resolution, and Rph is the pinhole resolution (11).
Angular Orientation of Each Simulated Projection
Noise was then added to each projection. First, the projection data were scaled such that the pixel values were similar to that acquired with a gamma camera using a pinhole collimator. The sensitivity was calculated on the basis of the pinhole size, using (11):
 The scaled projection was multiplied by the sensitivity on a pixel-by-pixel basis. Each pixel value was sampled from a Poisson distribution with a mean N, where N is the noiseless pixel value. Projection sets were generated for various tumor sizes, TNTs, and pinhole sizes. All sets were simulated twice, once using blurred data and once using data that were both blurred and noisy. A total of 36 ideal projection sets was simulated.
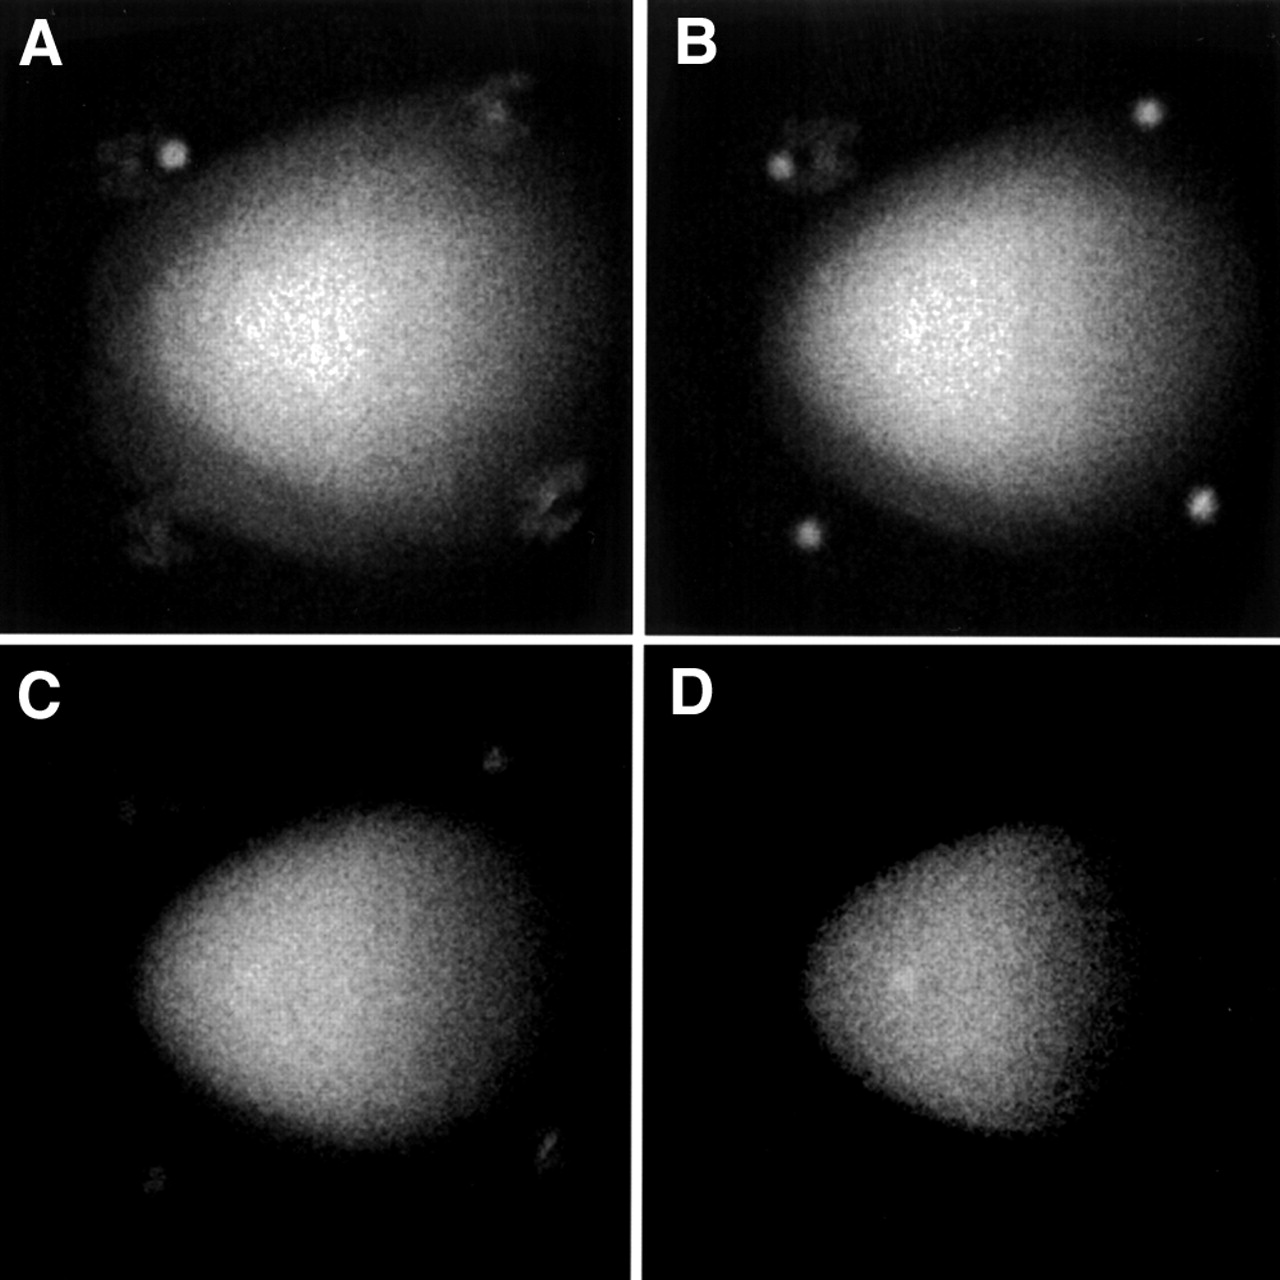
For each projection set, the TACT software developed by R.A. Horton and R.L. Webber (Verity Software Systems, Winston-Salem, NC) was used to reconstruct the data. The straight lateral view was used as the reference. The 4 coplanar fiducial markers were identified on each projection, and a projective transformation of each of the projection images was performed. The fifth marker was identified in each projection and used to determine the amount of shifting necessary to reconstruct different slices through the object. Figure 4 displays 4 of 40 reconstructed slices of the blurred and noisy case for the 10-mm tumor and 10:1 TNT and a 3-mm pinhole. Because the lateral view was used in each case as the reference image, all reconstructed image sets were oriented in the same way. For each case, the slice with the tumor was selected. Contrast measurements of tumor counts versus background counts in the blurred image were calculated and recorded. A 16 × 16 pixel region of interest (ROI) was used to determine the counts over the tumor. A similarly sized ROI was placed in the background of the breast, just outside of the tumor boundary. Two measurements were made in the background and then averaged. One measurement was made directly on the tumor and the value (TUM) was recorded. The contrast was then estimated using the following formula:
 where BKG is the mean value of the pixel counts in a background ROI. The fractional SD (FSD = SD/BKG) of the pixel values in the background of the blurred and noisy image was also calculated. Two FSD measurements were taken from the background of the breast and then averaged together. The contrast, C, was divided by the averaged FSD to estimate the contrast-to-noise ratio (CNR):
 The CNR is analogous to the SNR. Calculation of the SNR would require the fractional SD of the ROI counts rather than the pixel counts. However, if the pixel counts in the region are reasonably uniform, the 2 SDs should be proportional to each other. Thus, the CNR should be indicative of lesion detectability just as SNR is.

Four of 40 ETACT reconstructed slices for case 10/10 (tumor diameter of 10 mm and 10:1 TNT) using 3-mm pinhole. (A) Fifth fiducial plane. (B) Four fiducials. (C) Random slice within breast. (D) Slice containing tumor.
Planar images were simulated for the 10/10 case (which refers to a 10-mm tumor and a TNT of 10:1) and varying pinhole size for comparison with the ETACT reconstructions. The straight lateral view of the breast was simulated with 7 times the counts in a single, simulated ETACT projection. In this way, the planar image had the same total counts as the total ETACT reconstruction. The contrast and the CNR for the planar case were compared with those of the ETACT reconstructed data.
Phantom Experiments
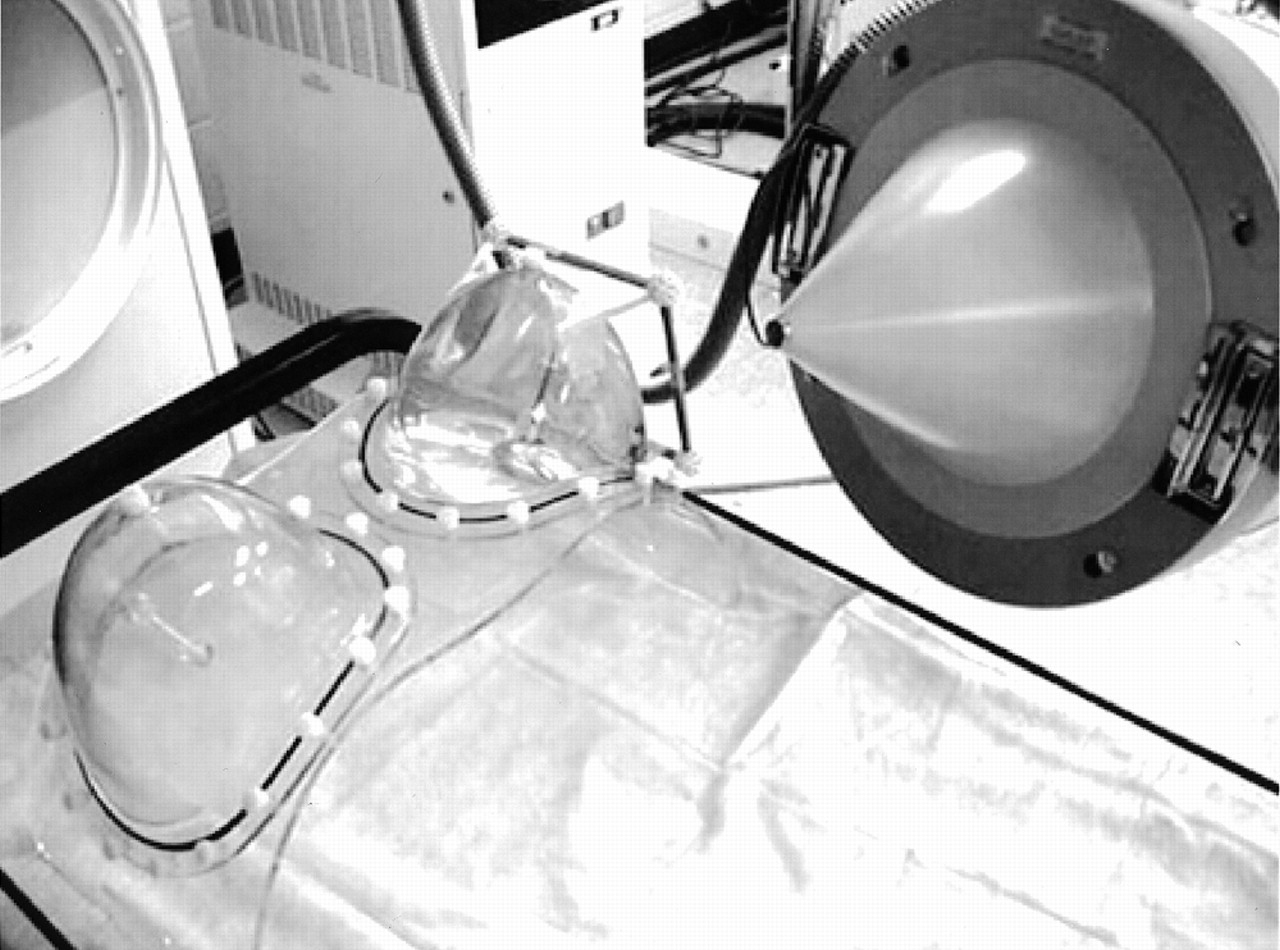
An 8 mm “tumor” was filled with 99mTc and inserted into the breast phantom (Data Spectrum Corp., Hillsborough, NC). The rest of the breast was filled with water and mixed with 99mTc to create a 10:1 TNT, 37 kBq/mL (1 mCi/mL) in the breast and 370 kBq/mL (10 mCi/mL) in the tumor. After the phantom was prepared, it was set on a table and 7 projections were taken with a portable gamma camera (TransCam; ADAC Laboratories, Milpitas, CA) using a pinhole collimator. The positioning of the 7 projections was taken to resemble those in the simulation study. Figure 5 displays the experimental setup. The TransCam camera has a 260-mm field of view and a 6.5-mm NaI crystal thickness. This camera has an intrinsic spatial resolution of 3.6 mm and an energy resolution of 10.9% at 140 keV. The data were acquired with a 15% energy window. A 4-mm pinhole was used. Each projection was acquired for 5 min. The total count for each projection was around 45,000. The TACT software was used to reconstruct the data as described. The contrast and CNR measurements were calculated in the same fashion as in the simulation study.

Phantom experiment setup includes anthropomorphic phantom and portable gamma camera with pinhole collimator aimed at lateral side of breast. Seven projections were taken of breast at different angles. These projections were then reconstructed using ETACT software to create slices through breast.
RESULTS
Simulation Results
The simulation results are presented in Tables 2 and 3 and in Figure 6. The labeling 10/5 refers to a tumor size of 10 mm and a TNT of 5:1, whereas 5/10 refers to a tumor size of 5 mm and a TNT of 10:1. Values for all 6 different pinhole sizes are listed. The contrast results are displayed in Table 2. The CNR results are shown in Table 3 and in Figure 6. Our results indicate that a CNR of around 2 is the threshold for detectability. In each case, there is an optimal peak in the CNR curve. The overall optimum is a 3-mm pinhole for a tumor of size 10 mm and a TNT of 10:1. The highest concentration of the best CNRs is as a result of the 3-mm pinhole. Figure 4 shows 4 reconstructed simulations for the 10/10 case. Table 4 compares the contrast and CNR of the planar and ETACT simulations as a function of pinhole size. In all cases, the contrast and CNR for the planar case were less than those for the ETACT case, primarily because of the increased contrast that resulted from the ETACT reconstruction.

Plot of CNR measurements for different simulated cases: as TNT increases, CNR also increases. In most cases, optimal pinhole size is 3 mm.
Contrast Measurements
CNR Measurements
Comparison of Simulated Planar and ETACT Data
Phantom Results
The results of the phantom experiment including the 8-mm tumor are given in Table 5. Reconstructed slices through the breast, including the fifth marker, the 4 coplanar markers, the breast, and the tumor, are shown in Figure 7. The 8-mm tumor is detectable and these results are comparable with our simulation results.
Four of 40 reconstructed slices of anthropomorphic phantom using 8-mm tumor size with 10:1 TNT. (A) Fifth fiducial slice. (B) Four fiducials. (C) Random slice within breast. (D) Slice containing 8-mm tumor. As viewed, 8 mm is detectable.
ETACT Phantom Results
DISCUSSION
In the simulation experiments, ETACT was shown to have the potential of detecting tumors <1 cm. However, a 5-mm tumor was not detectable even for a TNT as high as 15:1. The CNR threshold for detection was determined objectively to be around 2.0. As the pinhole size of the collimator increased, the contrast of the image worsened and the noise decreased; conversely, as the pinhole size decreased, the contrast improved and the noise worsened. Thus, there may be an optimal pinhole size as determined by that that yields the maximal CNR. The optimal pinhole size was observed to be the 3-mm pinhole for all discernable cases, although it was not substantially better than 4 mm. The contrast and CNR were consistently higher for the ETACT simulation compared with a planar simulation.
The simulation study may be limited because attenuation and Compton scatter were not included in the model. Attenuation may have an effect on the final image. γ-Rays from the tumor had to travel half of the breast, but γ-rays from behind the tumor had more tissue through which to travel and thus would be attenuated more. Attenuation may have reduced the image contrast, but the effect would probably be small. In Compton scatter, the photon changes direction as it scatters, causing a loss in spatial resolution and the contrast for small objects to worsen. In the clinic, the limited energy resolution of the NaI crystal in the gamma camera makes it impossible to eliminate all of the Compton scattering. Even with a 15% energy window, scattered radiation will still be incorporated into the image. Therefore, the phantom study results may not exactly match the simulated data because of attenuation and Compton scatter. On the other hand, it is unclear whether the inclusion of attenuation and Compton scatter has much effect on the comparison of ETACT with other conventional imaging methods because these considerations would affect these methods as well. We are investigating the role of attenuation and Compton scatter in ETACT through Monte Carlo simulations and a comprehensive phantom study.
In the phantom studies, the aim was to create a simulated clinical setting. The breast was filled with a 37-kBq/mL (1 mCi/mL) solution and the tumor was filled with 370 kBq/mL (10 mCi/mL). The phantom was imaged with seven 5-min exposures, a total of 35-min acquisition time, which would be considered a reasonable study time in the clinic. The phantom results are a reasonable indication of what may be expected with real patient data. The phantom results also verified the validity of the simulation results.
To improve the potential of the ETACT method, some aspects of the experimental setup need further investigation: pinhole size, collimator, field of view, angular disparity of the projections, and iterative deconvolution. On the basis of our simulation results, a 3-mm pinhole will be constructed and used for future phantom studies. Simulation results imply that a 6-mm tumor might be visible with the 3-mm pinhole. Another way of improving the resolution, and therefore the SNR, of the images is to increase the field of view of the detector, allowing for more magnification. This could possibly be accomplished by the use of optical markers. Instead of radioactive fiducial markers, visible ones could be used with an optical system mounted to the gamma camera. The optical markers would be used for the reconstruction process. Thus, the gamma camera could more closely approach the patient with more flexibility, but without all of the fiducial markers necessarily being in the field of view of the gamma camera. This could lead to an increase in both resolution and sensitivity. Iterative deconvolution could also improve the results of the ETACT method, by subtracting the unwanted signals from neighboring slices. To fully analyze the ETACT method, a clinical evaluation needs to be performed eventually.
CONCLUSION
We evaluated the scintimammography technique, ETACT, through simulation and phantom experiments. The simulation experiments revealed that the 3-mm pinhole size is the optimum for the best tradeoff between resolution and noise. The phantom studies were consistent with the simulation results and proved that we can get reasonable results in a simulated clinical setting. In the phantom experiments, the 8-mm tumor was visible using the 4-mm pinhole. Therefore, ETACT has the potential to improve patient diagnoses by detecting tumors at an earlier stage and could be applied in any hospital in an easy and flexible manner.
Acknowledgments
The authors thank Cathy Eades and Zhiping Mu for their help in the performance of these studies. The U.S. Army Medical Research and Materiel Command under DAMD grant 17-98-8349 supported this work.
Footnotes
Received Nov. 2, 2000; revision accepted Mar. 8, 2001.
For correspondence or reprints contact: Frederic H. Fahey, DSc, PET Center, Wake Forest University School of Medicine, Medical Center Blvd., Winston-Salem, NC 27157-1061.


