


Abstract
The glucose analog 18F-FDG is commonly used to quantify regional glucose uptake in vivo. The aim of this study was to test whether the analysis of plasma 18F-FDG kinetics could be used to estimate endogenous glucose production (EGP) and the total rate of appearance (Ra), total rate of disappearance (Rd), and the metabolic clearance rate (MCR) of glucose. Methods: Fourteen pigs were coinjected with 18F-FDG and 6,6-2H-glucose (2H-G) during fasting (n = 6) and during physiologic (1.0 mU·kg−1·min−1, n = 4) and supraphysiologic (5.0 mU·kg−1·min−1, n = 4) euglycemic hyperinsulinemia. Arterial plasma was sampled for 180 min to quantify the parameters for the 2 tracers. Results: Fasting Rd2H-G and RdFDG were 12.3 ± 2.1 and 13.3 ± 1.3 μmol·kg−1·min−1 (difference not statistically significant [NS]). M values were more than doubled between the 2 clamp studies (P < 0.0001). Rd2H-G and RdFDG were dose-dependently higher during the hyperinsulinemic state (19.8 ± 3.7 vs. 18.9 ± 1.1 and 31.4 ± 4.1 vs. 31.9 ± 2.3 in 1.0 and 5.0 mU·kg−1·min−1 studies, respectively; difference between tracers NS) than during the fasting state, with a parallel suppression of EGP2H-G and EGPFDG. Parameters estimated by 18F-FDG and 2H-G were equivalent in all groups; their agreement was confirmed by Bland–Altman examination. Total RdFDG correlated with Rd2H-G (r = 0.74; P = 0.003), M (r = 0.92; P = 0.001), MCR2H-G (r = 0.52; P = 0.037), and EGP2H-G (r = −0.71; P = 0.004). EGPFDG correlated with EGP2H-G (r = 0.62; P = 0.018), Rd2H-G (r = −0.78; P = 0.001), and MCR2H-G (r = −0.67; P = 0.008). The 18F-FDG mean transit time correlated inversely with the M and Rd values and positively with EGP. Conclusion: The glucose analog 18F-FDG can be used in the simultaneous estimation of whole-body glucose turnover and production and regional 18F-FDG PET measurements under both fasting and insulin-stimulated conditions.
PET with 18F-FDG quantifies regional glucose uptake in vivo and, thus, is widely applied in the characterization of organ metabolism in patients with insulin resistance and diabetes (1–3). Such disorders are typically associated with abnormal regulation of endogenous glucose production (EGP) (4–6). Some information on systemic glucose metabolism has been simultaneously derived during PET under conditions of insulin stimulation by calculating the disposal rate of exogenously infused glucose (M value). However, equivalence between this index and total glucose uptake requires full suppression of glucose release by endogenous sources; besides, no estimation of systemic glucose metabolism has been obtained under non–insulin-stimulated conditions in PET studies.
Modeling of hepatic 18F-FDG PET image data has suggested that a rate constant associated with EGP could be estimated (7–9), with the following limitations. First, the rate constant is related to the flux rate of glucose through the intracellular glucose-6-phosphate pool, which is unknown; second, the extrahepatic component of EGP (10) remains unaccounted for; third, imaging of distant (extrahepatic) organs such as leg skeletal muscle, lower abdominal fat, or the brain may preclude the possibility of simultaneously deriving this information during liver scanning.
Glucose in plasma can be newly formed or can be that taken up by the organs and circulated through futile cycling between glucose-6-phosphate and fructose-6-phosphate. The term “endogenous glucose production” is used to express the net production of glucose, as opposed to the total output of glucose, which is the sum of EGP and glucose cycling. Glucose tracers labeled in position 2 loose their label in the hexose isomerase reaction and are used to assess total glucose output. Glucose tracers labeled in position 3 or 6 do not loose their label in the isomerase reaction and are used to measure EGP. The PET tracer 18F-FDG is not a substrate for the isomerase and does not undergo the above glucose cycling.
The hypothesis of this study was that analysis of plasma 18F-FDG kinetics could be used to estimate EGP and the total rate of disappearance (Rd) and metabolic clearance rate (MCR) of glucose. To verify this hypothesis, we used plasma 6,6-2H-glucose (2H-G) kinetics and the M value as the reference methods for our target assessments.
MATERIALS AND METHODS
Animal Experiments
The study was conducted on pigs as part of a more comprehensive invasive investigation. Fourteen weight-matched pigs were studied during fasting (n = 6, 29.8 ± 0.6 kg), physiologic (1.0 mU·kg−1·min−1, n = 4, 30.0 ± 0.5 kg) or supraphysiologic (5.0 mU·kg−1·min−1, n = 4, 30.3 ± 0.5 kg) euglycemic hyperinsulinemia. The animals were deprived of food starting at 5:00 pm on the day before the study. Anesthesia was induced by injection of 1.0 g of ketamine into the neck muscles of the pig before it was transported to the operating theater. Throughout the experiment, animals were anesthetized with ketamine and pancuronium (a total of 1.5 g and 40 mg, respectively) and mechanically ventilated with normal room air (regulated ventilation, 16 breaths per min) via tracheal intubation. Catheters were placed in the femoral vein and carotid artery for the administration of glucose, insulin, 2H-G, and 18F-FDG and for sampling of arterial blood. The animals were then transported to the PET center for tracer administration and blood sampling. In the hyperinsulinemic clamp studies, insulin was infused in a prime-continuous fashion for 240 min via the venous cannula, and euglycemia was maintained by measuring arterial plasma glucose levels at 5- to 10-min intervals and adjusting a 10%–20% dextrose infusion (11). In fasting studies, saline was infused instead of insulin and glucose. Approximately 60 min into the infusions, 18F-FDG (274 ± 7 MBq) (12) and 2H-G (fasting, 451 ± 9; clamp, 1,043 ± 26 μmol) were rapidly coinjected, and arterial blood was sampled frequently (n = 31)—every 15 s until 2 min; every 30 s until 3 min; at 5, 7, 10, 15, 20, 25, 30, 35, and 40 min; every 10 min until 120 min; and every 15 min until 180 min—for determination of plasma 18F-FDG radioactivity and 2H-G tracer-to-tracee ratio (TTR, as measured by gas chromatography mass spectrometry (13)). Vital signs, blood pressure, and heart rate were monitored throughout the study.
The protocol was reviewed and approved by the Ethical Committee for Animal Experiments of the University of Turku.
Calculations
Glucose Turnover by 2H-G.
The Rd and total rate of appearance (Ra) of glucose were derived from 2H-G measurements by previously reported methods (13), as Ra2H-G (μmol·min−1) = Rd2H-G (μmol·min−1) = dose (μmol)/AUCTTR (μmol·μmol−1·min), where AUCTTR is the area under the time–concentration curve (time 0 → ∞) of the TTR. The tracer MCR and the Rd of the tracee are related through the steady-state plasma tracee concentration, here glucose [PG], via the following formula: MCR2H-G (mL·min−1) = Rd2H-G (μmol·min−1)/[PG] (μmol·mL−1).
Glucose Turnover by 18F-FDG.
The plasma clearance rate of 18F-FDG (PCRFDG) was derived by standard equations and corrected for urinary loss to obtain MCRFDG. On the basis of the relationship just described, MCRFDG was multiplied by [PG] to estimate Ra (RaFDG), as previously reported using 3H-2-deoxyglucose (14,15): PCRFDG (mL·min−1) = dose (kBq)/AUCFDG (kBq·mL−1·min); MRCFDG (mL·min−1) = PCRFDG (mL·min−1) – kV (mL·min−1); RaFDG (μmol·min−1) = RdFDG (μmol·min−1) = MCRFDG (mL·min−1) × [PG] (μmol·mL−1), where k is the first-order kinetic constant describing urinary loss of 18F-FDG (16) and V is the apparent distribution volume of 18F-FDG. V was calculated by multiexponential fitting of the radioactivity curves after 60 s of injection (15,17), yielding values of 10% ± 1% of body weight, similar to the expected plasma volume of pigs. In addition, the 18F-FDG mean transit time was estimated as previously described (17).
AUCTTR and AUCFDG were computed by integration of the plasma TTR and 18F-FDG radioactivity curves by the trapezoidal rule and extrapolation of the curve tails to infinity.
Under fasting conditions, Ra equals EGP because no exogenous glucose is infused; during the clamp, EGP was computed by subtracting the glucose infusion rate from Ra.
The values of individual kinetic parameters, and the M value from the clamp, were divided by body weight (kg) to obtain units of μmol·min−1·kg−1 (EGP, Rd, Ra, and M) or mL·min−1·kg−1 (MCR).
Statistical Analysis
Data are given as mean ± SEM. ANOVA and the Student t test were used for intergroup and within-group (between-tracer) comparisons, respectively. Regression analyses were conducted according to standard methods. Agreement between the results obtained with the 2 tracers was further tested by the Bland–Altman approach (18). A P value of less than 0.05 was considered statistically significant.
RESULTS
Metabolic Characteristics
Plasma glucose levels were slightly lower in the fasting study (3.7 ± 0.4 mmol·L−1) than in the clamp studies (5.0 ± 0.1 and 5.0 ± 0.1 mmol·L−1, P = 0.02 vs. clamp, NS between clamp studies), but they were otherwise stable within studies (coefficient of variation < 5% during the kinetic evaluation). Plasma insulin levels averaged 21 ± 7 pmol·L−1 in the fasting study, 295 ± 5 pmol·L−1 in the 1.0 mU·kg−1·min−1 insulin infusion study (P = 0.01 vs. fast), and 1,497 ± 140 pmol·L−1 in the 5.0 mU·kg−1·min−1 insulin infusion study (P < 0.0001 vs. other groups).
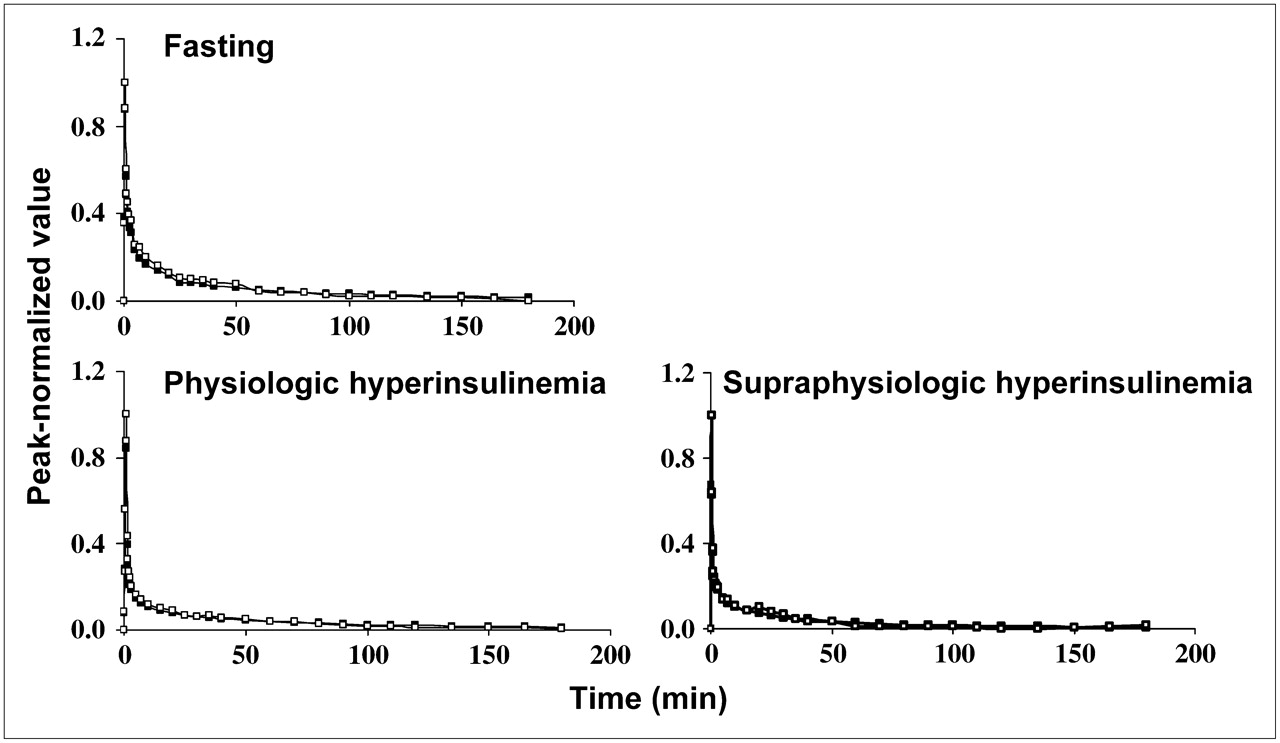
Glucose Kinetics by Test Versus Reference Method
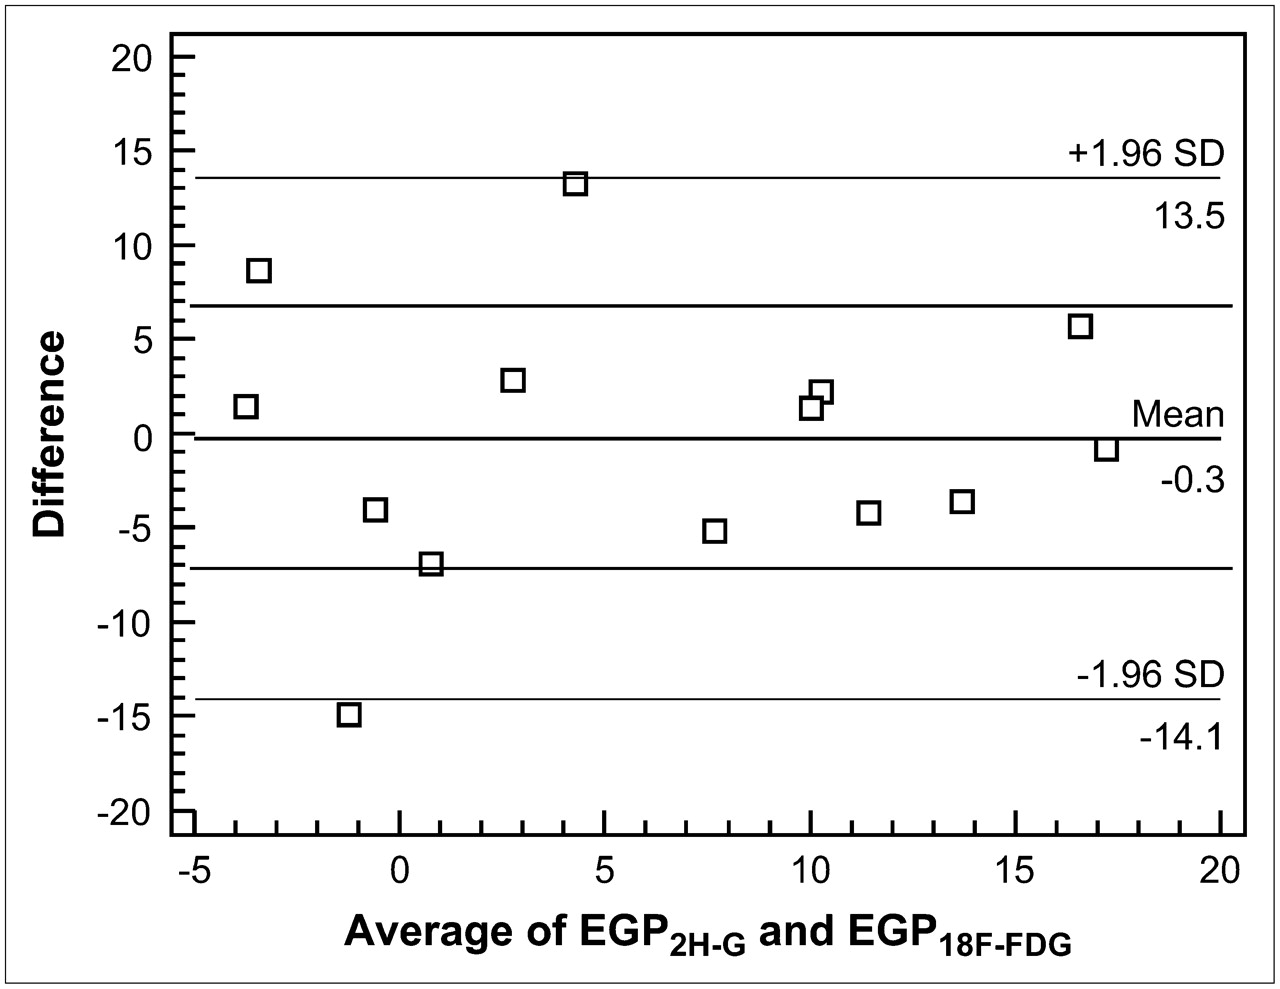
By way of example, the arterial 18F-FDG and 2H-GTTR time–concentration curves of 1 animal are shown in Figure 1. Figure 2 shows average time courses for the 3 study groups. The tracer-estimated parameters and insulin-mediated glucose uptake values (M) are shown in Figure 3. Under all study conditions (fasting, 1.0 mU·kg−1·min−1 clamp, and 5.0 mU·kg−1·min−1 clamp), the estimates of MCR, Ra, Rd, and EGP obtained by 18F-FDG did not differ (NS) from those obtained by 2H-GTTR: for example, 3.5 ± 0.7, 4.0 ± 0.7, and 6.4 ± 0.9 mL·kg−1·min−1, respectively, for MCR2H-G, versus 3.6 ± 0.2, 3.8 ± 0.2, and 6.5 ± 0.6 mL·kg−1·min−1, respectively, for MCRFDG, and 12.3 ± 2.1, 19.8 ± 3.7, and 31.4 ± 4.1 μmol·kg−1·min−1, respectively, for Rd2H-G, versus 13.3 ± 1.3, 18.9 ± 1.1, and 31.9 ± 2.3 μmol·kg−1·min−1, respectively, for RdFDG (Fig. 3). The Bland–Altman plot for EGP, as shown in Figure 4, and Rd documented that results derived from 18F-FDG were indistinguishable from those derived from 2H-GTTR, with 80% of values (differences) falling within 1 SD of the mean—well above the 68% prediction interval. Lack of correction for urine loss led to overestimation of 18F-FDG–derived kinetic parameters by 20% ± 3%, 17% ± 2%, and 13% ± 2% during fasting, physiologic, and supraphysiologic hyperinsulinemia, respectively (P = 0.04 vs. fast).

Time-dependent kinetics of 18F-FDG (▪) and 2H-G (□) in 1 study subject per each experimental condition. For comparison, tracer measurements have been normalized to respective peak values.
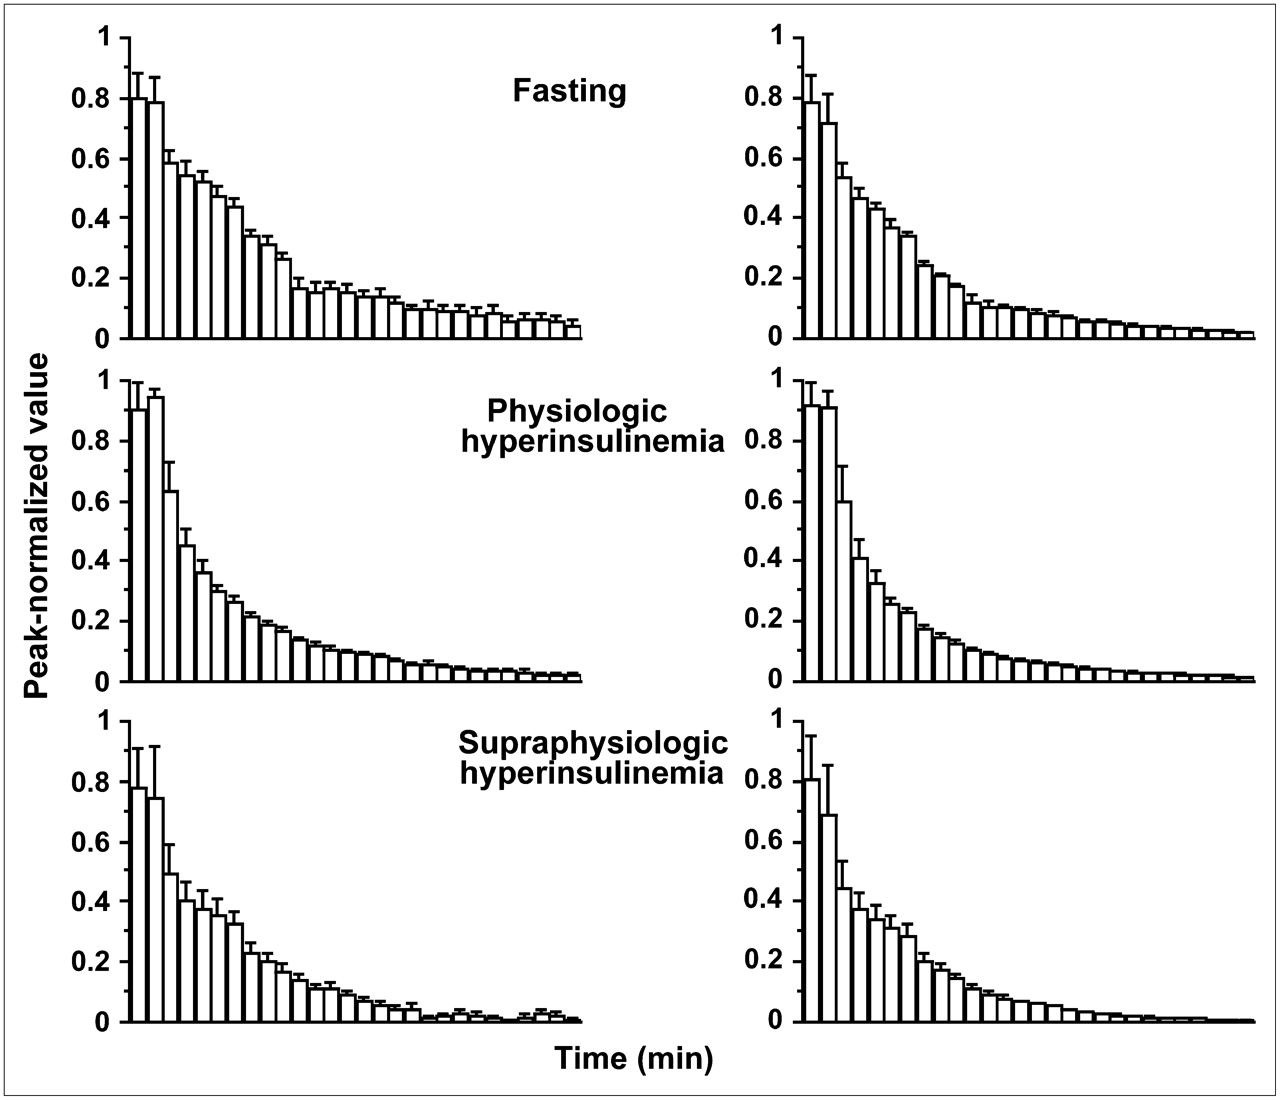
Peak-normalized 18F-FDG (right) and 2H-G (left) in the 3 study groups, showing similarly progressive acceleration in tracer disappearance from top to bottom, in relation to increasing insulin stimulation.
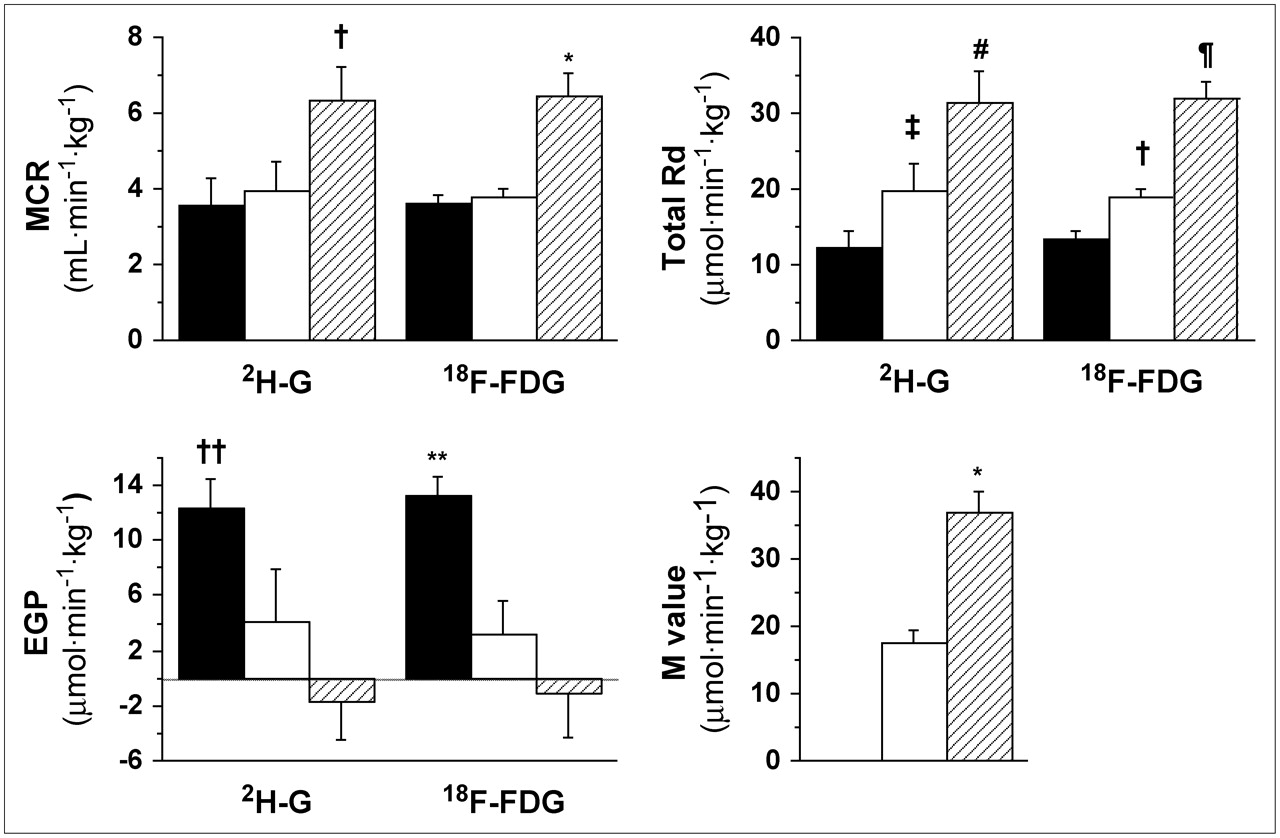
Insulin-mediated glucose uptake (M value) and tracer parameters derived using 2H-G and 18F-FDG during fasting conditions (black bars) and during physiologic (white bars) or supraphysiologic (hatched bars) insulin stimulation. No estimated parameters differed significantly between the 2 tracers. Within tracer: *P ≤ 0.0001 vs. other groups; †P ≤ 0.05 vs. other groups; ‡P = 0.1 vs. fast; #P = 0.001 vs. fast and 0.03 vs. 1-mU clamp; ¶P = 0.0002 vs. 1-mU clamp and <0.0001 vs. fast; ††P = 0.058 vs. 1-mU clamp and 0.004 vs. 5-mU clamp; **P = 0.006 vs. 1-mU clamp and 0.0006 vs. 5-mU clamp.

Bland–Altman plot: x-axis shows mean EGP results of the 2 methods, and y-axis shows absolute EGP difference between the 2 methods. SD appears to be similar with increasing mean values, and mean difference between results of the 2 methods is virtually zero; most values (80%) fall within 1 SD, with only 1 value being just outside, but close to, 95% agreement interval.
Effect of Hyperinsulinemia
M values were more than doubled between the 2 clamp studies (P < 0.0001). MCR2H-G and MCRFDG tended to be higher during physiologic hyperinsulinemia than during fasting and were significantly and comparably higher during supraphysiologic hyperinsulinemia. On average, physiologic and supraphysiologic hyperinsulinemia were associated with similar increases in both Rd2H-G and RdFDG—by 50% and by 2.5-fold, respectively—above the fasting value. Both EGP2H-G and EGPFDG were 70%−75% lower during physiologic hyperinsulinemia than during fasting and were fully suppressed at supraphysiologic insulin levels. The mean transit time of 18F-FDG tended to be lower during the 1 mU·kg−1·min−1 clamp than during fasting (99 ± 7 vs. 83 ± 7 min, P = 0.09) and was significantly lower during the 5 mU·kg−1·min−1 insulin infusion (52 ± 4 min, P = 0.0002 and 0.009 vs. fast and clamp, respectively).
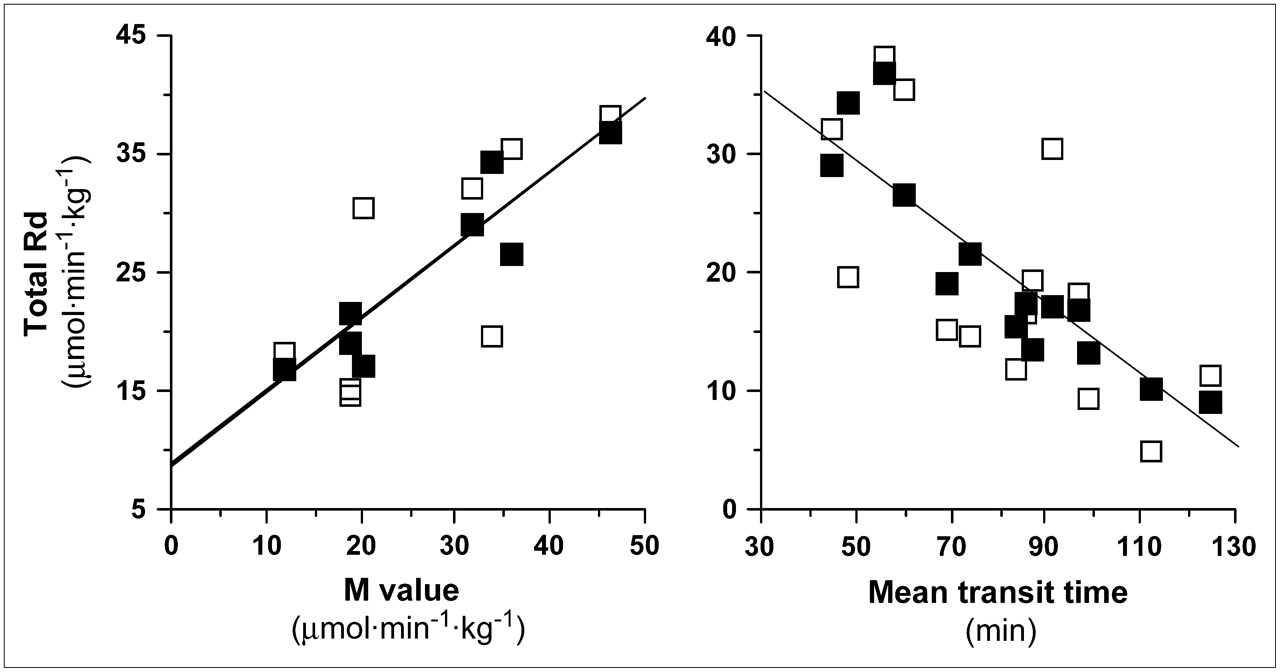
RdFDG correlated positively with Rd2H-G (r = 0.74; P = 0.003), M value (r = 0.92; P = 0.001; Fig. 5), MCR2H-G (r = 0.52; P = 0.037), and plasma insulin (r = 0.86; P < 0.001) and glucose levels (r = 0.61; P = 0.02) and correlated inversely with EGP2H-G (r = −0.71; P = 0.004). EGPFDG correlated positively with EGP2H-G (r = 0.62; P = 0.018) and inversely with Rd2H-G (r = −0.78; P = 0.001), MCR2H-G (r = −0.67; P = 0.008), and plasma insulin levels (r = −0.75; P = 0.002). The mean transit time of 18F-FDG correlated inversely with M value (r = −0.78; P = 0.022), Rd2H-G (r = −0.67; P = 0.0091), and RdFDG (r = −0.91; P < 0.0001; Fig. 5), and correlated positively with EGP2H-G (r = 0.63; P = 0.017) and EGPFDG (r = 0.53; P < 0.05).

Regression analyses showing associations between M values (left) and RdFDG (▪) (r = 0.92; P = 0.001) or Rd2H-G (□) (r = 0.74; P = 0.036) and between mean transit time (right) and RdFDG (▪) (r = 0.91; P < 0.0001) or Rd2H-G (□) (r = 0.67; P = 0.009).
DISCUSSION
The present study documented that analysis of the time course of plasma 18F-FDG radioactivity after a rapid intravenous tracer injection can be used to quantitatively describe glucose kinetics under different and most common (fasting and insulin-stimulated) metabolic conditions. To the best of our knowledge, this is the first study in which the systemic kinetics of this glucose analog have been compared with those of a glucose tracer to derive information on whole-body glucose disposal and production.
The estimates of glucose disappearance and production obtained in the present study—with 2H-G or 18F-FDG—are in accord with most published work in humans and animals (4,6,17,19) and are in keeping with the expected kinetics of insulin action, that is, dose-related stimulation of glucose disappearance and suppression of endogenous glucose (17,20,21). Thus, the influence of other factors, such as anesthesia (which can potentially lower metabolic rates) or morning surgical procedures (which can upregulate counterregulatory, i.e., hyperglycemic responses), was likely minor and compatible with the main study purpose of comparing the results of 2 procedures performed simultaneously and, thus, similarly influenced by the experimental situation. During all study conditions, the kinetic description of glucose turnover derived from the use of 18F-FDG agreed closely with that obtained using the most commonly adopted reference tracer (13). Additional strength was provided by the observation that 18F-FDG–derived results were close to those measured by independent methods. Thus, RdFDG increased in a linear relationship with M value and with Rd2H-G, whereas EGPFDG and the 18F-FDG mean transit time decreased progressively and in a similarly parallel fashion. Given the intrinsically lower quality of stable versus radioactive isotope measurements, 18F-FDG–based data were extremely consistent within each group, and in this regard superior to their 2H-G counterpart, as shown in Figures 1 and 3. This finding presumably underlies the tighter correlation between the M value and the kinetic parameters calculated by the analog, in comparison with those calculated by the glucose tracer. Under insulin-stimulated conditions, whole-body glucose disappearance is accounted for mostly by its disposal in skeletal muscle and adipose tissue. The observation of an equal removal rate of plasma 2H-G and 18F-FDG is in keeping with a measured regional lumped constant of around unity in these organs (22–24).
A previous study, by James et al. (14), compared glucose turnover rates as obtained with d-[U-14C]-glucose and 2,6-3H-2-deoxyglucose. An exact equivalence between these 2 tracers could not be demonstrated because, as discussed in their work, d-[U-14C]-glucose recycling led to an underestimation of glucose turnover and production. In the current study, this problem was avoided by the use of a nonrecycling glucose tracer (13). A second error, resulting from the loss of circulating 2-deoxyglucose into the urine, was subsequently solved by mathematic correction (15). In fact, the hydroxyl groups play a major role in the recognition and transportation of glucose by the tubular kidney. With the fluorine substitution in the 2 position, 18F-FDG is a substrate for the renal glucose carrier and is reabsorbed in larger proportions than is 2-deoxyglucose, with a plasma-to-urine transfer rate constant of approximately 0.8%·min−1 in humans (16); that is, 5 times lower than the approximately 4%·min−1 figure for 2-deoxyglucose obtained in rat studies (15). In our study, correcting for this factor improved the correlation with the reference method. However, given its nearly systematic nature, this error would not have affected any of the comparisons between groups, especially at plasma insulin levels in the fasting and physiologic postprandial range.
Similarly to most PET studies, our experimental design precluded the use of continuous glucose tracer infusion—the more usual format of tracer administration for parameter estimation. Though 18F-FDG has been infused in some studies, rapid injection is the most commonly chosen method, because the fast clearance of tracer from plasma, coupled with its progressive tissue trapping, provides the highest target-to-background signal and image quality. However, glucose turnover can be evaluated equally well after rapid injection or continuous infusion of the tracer, provided that the plasma glucose concentration is in steady state (13), as was the case in the current study (coefficient of variation < 5% from tracer injection to the end of the experiment).
Counting of plasma radioactivity, with a similar time resolution as presented here, is normally instrumental in the quantification of regional metabolism in PET studies; thus, the current analysis implicates no additional blood sampling in future patient studies. While targeting specific organs by imaging, the analysis can serve to simultaneously quantify whole-body EGP and disposal rates without the risk of underestimating the latter, as may occur using the M value, and with the additional advantage of being informative during both insulin-stimulated and non–insulin-stimulated conditions.
The measurements here reported may be supportive in several clinical applications. A few are mentioned below by way of example. Patients with diabetes or hyperglycemia are characterized by a state of insulin resistance, which may involve predominantly the liver (leading to relative glucose overproduction) or peripheral tissues (resulting in lower glucose use). Antidiabetic drugs may prevalently affect one of these processes. For example, glitazones have a potent effect in augmenting skeletal muscle glucose uptake (25), whereas metformin predominantly improves liver responses (26). The simultaneous assessment of systemic glucose uptake and production, together with PET of, for example, skeletal muscle, may be used to personalize treatment and to reveal the prevailing mechanism of action of newly developed hypoglycemic agents. Systemic or myocardial insulin resistance is associated with cardiovascular disease and heart failure and is a predictor of their prognosis and response to treatment (27,28). Together with information gained during PET of individual body regions, such as the myocardium, one can obtain complementary information known to be associated with cardiac disease progression and with the risk of diabetes as a further complicating factor. Patients with cancer have reduced whole-body glucose disposal and enhanced EGP, the latter being only partly explained by higher substrate availability for glucose synthesis due to wasting (29). Before the development of malnutrition, these metabolic abnormalities occur in a considerable number of patients with any form of cancer (30). It has been suggested that the increased need for glucose by the neoplasm may stimulate EGP as a source, also fuelled by the high rate of substrate provision due to anaerobic glycolysis in cancer cells; in fact, tumor size was significantly associated with hepatic glucose production and glucose cycling to lactate (31). Simultaneous imaging of cancer with 18F-FDG PET would provide a measure of glucose avidity in the tumor and might confirm the described mechanisms, suggesting that suppression of EGP and use of insulin sensitizers may deprive cancer cells of nourishment. In the field of primary and secondary prevention, the possible causal association between insulin resistance, glucose metabolism, and risk of cancer or of cancer progression is a growing focus of investigation (32). For example, prediagnostic insulin resistance was a predictor of subsequent development of pancreatic malignancy in a large cohort of men (33). Once the disease has occurred, among potential metabolic predictors EGP has been shown to correlate inversely with subsequent survival length and tumor bulk (31,34), and insulin resistance has been shown to be associated with tumor aggressiveness (35). Hyperglycemia is a potential unwanted side effect of chemotherapy (36); thus, the possibility of assessing EGP and glucose disposal before this complication occurs may be supportive in drug development. This application extends to compounds in the fields of psychiatry, in which 18F-FDG PET is widely used, and common drugs provoke the development of the metabolic syndrome; in this situation, hepatic insulin resistance has been recognized as an indicator (37). In synthesis, the coupling of plasma kinetic measurements and regional imaging seems to be complementary in risk and prognosis assessment, drug development, and personalized treatment, especially in those fields in which 18F-FDG PET has expanded the most.
In summary, the present study conclusively demonstrated that the glucose analog 18F-FDG can be used to estimate whole-body glucose turnover and production during the fasting and hyperinsulinemic states. This finding provides the opportunity to relate systemic glucose metabolism to regional 18F-FDG PET under these metabolic conditions.
Acknowledgments
The study was financially supported by the Academy of Finland (grants 203958 and 206359), the Sigrid Juselius Foundation, and the Finnish Diabetes Foundation. We are grateful to the staff of the Turku PET Centre for their excellent technical assistance.
References
- Received for publication October 28, 2005.
- Accepted for publication February 7, 2006.


Jump to section
Related Articles
Cited By...
- Anorexia nervosa is associated with higher brain mu-opioid receptor availability
- Insulin Resistance Is Associated With Enhanced Brain Glucose Uptake During Euglycemic Hyperinsulinemia: A Large-Scale PET Cohort
- The SGLT2 Inhibitor Dapagliflozin Reduces Liver Fat but Does Not Affect Tissue Insulin Sensitivity: A Randomized, Double-Blind, Placebo-Controlled Study With 8-Week Treatment in Type 2 Diabetes Patients
- Insulin-stimulated glucose uptake in skeletal muscle, adipose tissue and liver: a positron emission tomography study
- A Partial Loss-of-Function Variant in AKT2 Is Associated With Reduced Insulin-Mediated Glucose Uptake in Multiple Insulin-Sensitive Tissues: A Genotype-Based Callback Positron Emission Tomography Study
- Maternal and Sex Dependency of Insulin Resistance: Longitudinal PET and Echocardiography Study from the Healthy Fetus to the Adult Minipig