


Abstract
Neuroinflammation may have beneficial or detrimental net effects on the cognitive outcome of Alzheimer disease (AD) patients. PET imaging with 18-kDa translocator protein (TSPO) enables longitudinal monitoring of microglial activation in vivo. Methods: We compiled serial PET measures of TSPO and amyloid with terminal cognitive assessment (water maze) in an AD transgenic mouse model (PS2APP) from 8 to 13 mo of age, followed by immunohistochemical analyses of microglia, amyloid, and synaptic density. Results: Better cognitive outcome and higher synaptic density in PS2APP mice was predicted by higher TSPO expression at 8 mo. The progression of TSPO activation to 13 mo also showed a moderate association with spared cognition, but amyloidosis did not correlate with the cognitive outcome, regardless of the time point. Conclusion: This first PET investigation with longitudinal TSPO and amyloid PET together with terminal cognitive testing in an AD mouse model indicates that continuing microglial response seems to impart preserved cognitive performance.
Alzheimer disease (AD) is the most common cause of dementia and is placing an ever more onerous burden on health care because of its exponentially rising incidence with increasing age (1). Immunologically mediated neuroinflammation is one hallmark of the pathophysiologic process of AD (2,3). Current models view neuroinflammation as a double-edged sword, which can have protective or detrimental effects on brain pathology, function, and the cognitive outcome (4,5). Microglia, the resident phagocytes of the innate immune system in the central nervous system, continuously survey for pathogens or cellular debris, secrete factors for tissue repair, and contribute to the plasticity of neuronal circuits by supporting the maintenance and remodeling of synapses (6). Microglia in AD brain can recognize and phagocytose soluble and fibrillary β-amyloid (Aβ), resulting in an increased inflammatory reaction (2). Although this kind of acute inflammation response promotes cellular repair and restores brain integrity, chronic inflammation processes can contribute to neurodegeneration (7).
Various transgenic mouse models of AD recapitulate neuroinflammatory processes in conjunction with classic Aβ pathology (8,9), and translational studies of these models are facilitated by small-animal PET with radioligands for imaging of AD biomarkers (10,11). The 18-kD translocator protein (TSPO), which is highly expressed at the outer mitochondrial membrane of activated microglia, presents a valuable biomarker for autoradiographic studies of microglial activation (12,13) and likewise for examination by PET of neuroinflammation in the brain of AD patients or in AD mouse models (14).
PET investigation of AD patients indicated only a low correlation between cerebral amyloid burden and cognitive performance (15), and Aβ deposition precedes the onset of neuroinflammation in patients with mild cognitive impairment (16). We contend that the temporal sequences of Aβ deposition and microglial activation in relation to progression of cognitive impairment is best examined through molecular imaging studies of longitudinal design. We have established this principle in serial PET examinations of Aβ accumulation in PS2APP mice treated with an experimental γ-secretase inhibitor (17).
Given this background, we aimed to correlate serial measures of TSPO and Aβ PET with terminal cognitive assessment in the PS2APP amyloid mouse model. Our goals were to, first, assess possible correlations between fibrillar amyloidosis in young and aged PS2APP mice with the cognitive outcome; second, determine whether early microglial response at baseline has an impact on the terminal cognitive outcome; and third, determine whether ongoing microglial activation influences the terminal cognitive outcome.
MATERIALS AND METHODS
Study Design
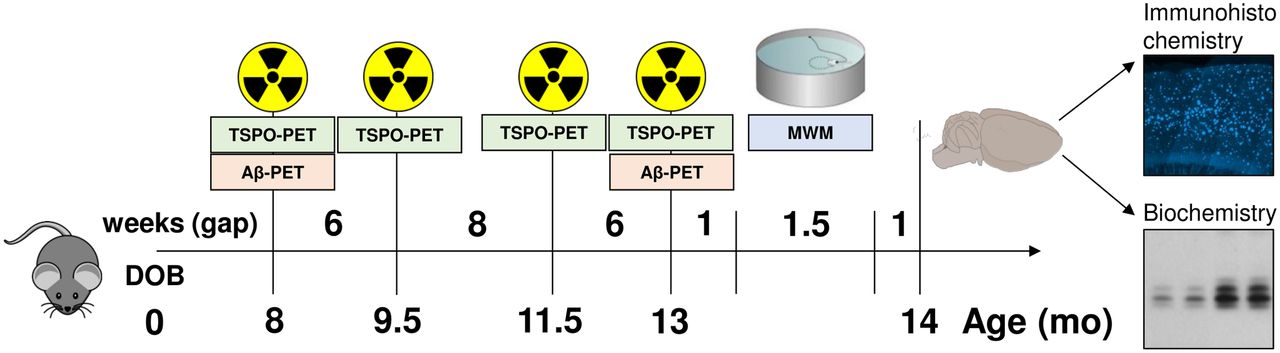
All experiments were performed in compliance with the National Guidelines for Animal Protection, Germany, with approval of the local animal care committee of the Government of Oberbayern (Regierung Oberbayern) and overseen by a veterinarian. The study was performed in a longitudinal design starting with dual-tracer PET (TSPO and Aβ) at 8 mo of age as the first time point. Additional TSPO PET was performed at 9.5, 11.5, and 13 mo of age, and a final Aβ PET examination was performed at 13 mo. After recovering from the last PET scan, the mice were transferred to the behavioral facility and allowed to rest for 1 wk before initiation of the water maze (WM) tests of spatial learning. One week after this behavioral test, the mice were deeply anesthetized before transcardial perfusion. After brain extraction, we processed the brains for immunohistochemical and biochemical analyses (randomized hemispheres). Figure 1 illustrates the study design.

Schematic illustration of study design and timeline. We obtained series of dual-tracer PET scans (TSPO and Aβ) in mice between 8 and 13 mo of age. After final scan, we administered behavioral testing by WM, followed by transcardial perfusion with 4% paraformaldehyde and brain extraction for histochemical, immunohistochemical, and biochemical analyses.
Animal Models and Statistical Power Analysis
We used 7 female wild-type C57BL/6 (WT) and 10 PS2APP transgenic mice in this investigation (18,19). The required sample sizes were calculated for correlation analyses (transgenic) and group comparisons (transgenic vs. WT) using G*power (version 3.1.9.2), based on assumptions for a type I error with an α-value of 0.05 and a power of 0.8. Effect size estimations were based on previous investigations with the same model. One additional animal was included per genotype to account for possible dropouts.
PET Imaging
PET Acquisition, Reconstruction, and Postprocessing
All PET procedures followed an established standardized protocol for radiochemistry, acquisition, and postprocessing (14,20). In brief, 18F-GE180 TSPO PET (11.2 ± 1.5 MBq) with an emission window of 60–90 min after injection was used to measure cerebral TSPO expression, and 18F-florbetaben Aβ PET (10.8 ± 1.5 MBq) with an emission window of 30–60 min after injection was used for assessment of fibrillary cerebral amyloidosis. All analyses were performed by PMOD (version 3.5; PMOD Technologies). Normalization of images to SUV or SUV ratio images was performed by the previously validated myocardium correction method (21) for TSPO PET and by a white matter reference region for Aβ PET (20).
PET Image Analysis
SD images (z score) were generated for all PS2APP mice for all time points and for both tracers. Here we used age-matched WT images (n = 7 each) specifically to calculate maps of the average (AVGWT) and SD (SDWT) of the relative SUV ratio for each tracer. Calculation of individual PS2APP z score images was performed by the formula (PS2APP − AVGWT)/SDWT. Voxelwise maps for the area under the curve (AUC) of tracer uptake differences were calculated for each individual animal by generation or summation of z score averages between imaging time points weighted for the respective time gap. The following equations were used: Eq. 1
Eq. 1 Eq. 2
Eq. 2
where TP-1 is 8 mo old, TP-2 is 9.5 mo old, TP-3 is 11.5 mo old, and TP-4 is 13 mo old. Voxelwise correlation analyses of z score and AUC maps with behavioral results were performed by statistical parametric mapping (SPM) using SPM5 routines (Wellcome Department of Cognitive Neurology) implemented in MATLAB (version 7.1; MathWorks Inc.). For volume-of-interest (VOI)–based analyses, we applied 2 predefined VOIs. The first VOI was a large forebrain VOI comprising mainly neocortical and hippocampal regions with the highest amyloidosis in PS2APP mice (92 mm3). The second VOI comprised brain areas associated with spatial learning, including the hippocampal formation, piriform and entorhinal cortices as well as the amygdala (32 mm3). Additionally, VOIs of peak clusters deriving from the SPM analysis were applied for extraction of individual regional z scores. Correlation analysis of VOI-based z score PET values with other modalities was performed by calculating the Pearson coefficient of correlation.
WM
Mice were subjected to a modified WM task as described previously (22–24), yielding escape latency and distance to the correct platform as readouts.
Mice had to distinguish between 2 visible platforms, one of which was weighted in a way that it would float when the mouse climbed on (correct choice), whereas the other would sink (wrong choice). The correct platform was always located at the same spot in the maze, whereas the wrong platform as well as the site from which the mice were released into the maze was varied in a pseudorandom fashion. Visual cues on the walls of the laboratory provided orientation. Trials were terminated if the mouse failed to reach one of the platforms within 30 s (error of omission). In this case, or in case of a wrong choice, the experimenter placed the mouse on the correct platform. After a 3-d handling period, WM training was performed on 5 consecutive days, with 5 trials per day, which were conducted 2–4 min apart. Memory performance was assessed by measuring the escape latency at each day of training and by the traveled distance at the last training day. For escape latency, we calculated the summed average time of all trials from the start point to attaining one of the platforms. To generate values as robust as possible for individual PS2APP mice, we calculated the z score difference for both methods in contrast to mean WT mouse scores [(PS2APP − AVGWT)/SDWT] and built a summed z score for each mouse. On the sixth day, the right platform was placed in the opposite quadrant of the maze to confirm that the mice had used spatial cues rather than rule-based learning to find it. Trials were filmed with a video camera, and the swimming trace was extracted using custom-written LabView software (National Instruments). The experimenter was masked accordingly to the phenotype of the animals.
Immunohistochemistry and Biochemistry
Immunohistochemistry in brain regions corresponding to PET was performed for fibrillar Aβ (methoxy-X04), microglia (Iba1), and synaptic density (VGLUT1) as previously established (25,26). Soluble Aβ was assessed as previously published (27).
Statistics
IBM SPSS Statistics (version 24.0) was used for statistical tests. Normal distribution of data was verified by the Kolmogorov–Smirnov test. Escape latency deriving from the WM test was compared between PS2APP and WT mice by a linear mixed model design including all days of training. Distance values deriving from the last day of training were compared between PS2APP and WT mice by an unpaired Student t test. Pearson coefficients of correlation (R) were calculated between WM z score values of PS2APP mice and their corresponding terminal z scores deriving from PET (Aβ and TSPO), immunohistochemistry (Iba1 and methoxy-X04) quantitation, and biochemical levels of soluble Aβ. Voxelwise and VOI-based correlation analyses of baseline and serial PET measures with WM z scores were conducted in SPM as described above. VGLUT1 quantification in different brain regions of PS2APP and WT mice was compared by an unpaired Student t test. R values were calculated for the correlation between WM z scores of PS2APP mice and their corresponding VGLUT1 quantification. A threshold P value of less than 0.05 was deemed significant for rejection of the null hypothesis.
RESULTS
Microglial Activity, Amyloidosis, and Cognitive Performance in PS2APP Mice
TSPO PET examination of PS2APP mice indicated an inverted U-shape from 8 to 13 mo of age with a peak at 11.5 mo for microglial activation, and Aβ PET showed the expected strong increase in amyloidosis from 8 to 13 mo of age (Figs. 2A and 2B). This increase was most pronounced in the frontal and parietal cortex, as well as in the hippocampus and the thalamus. Microgliosis was strongest in the cortex and the hippocampus but was also strong in subcortical regions devoid of Aβ, such as the striatum and the entorhinal and piriform cortices. Behavioral testing by WM showed that PS2APP mice had cognitive impairment, as revealed by increased escape latency (F(1,15) = 35.1, P < 0.001) and a 436% higher traveled distance (P < 0.01) compared with WT mice (Fig. 2C). There was no difference in speed between PS2APP and WT mice.

Longitudinal TSPO and Aβ PET and performance in behavioral testing. (A) Cortical TSPO PET and Aβ PET signal intensities of PS2APP mice at different ages are expressed as z scores relative to findings in age-matched C57BL/6 mice. Coronal and axial slices are projected on T1-weighted MRI template. (B) Progression of individual TSPO PET z scores and Aβ PET z scores in forebrain of PS2APP mice (n = 10) with age. (C) Differences between PS2APP and C57BL/6 (WT) mice for escape latency (sec) and traveled distance in pixels (pix) as WM readouts. Error bars represent SEM. *P < 0.01. **P < 0.001.
Association of Multimodal Terminal Readouts with Cognitive Performance
Next, we asked if terminal readouts of PET or immunohistochemistry correlate with the cognitive performance in PS2APP mice at 13.5 mo of age. The WM performance did not show any correlation with Aβ PET signal in the forebrain or in areas specifically associated with spatial learning 1 wk earlier (both R < ±0.3; Fig. 3A). On the other hand, there were trends toward better cognitive performance in mice, with the highest TSPO PET signal being in forebrain (R = −0.46, P = 0.18; Fig. 3A) or in the areas associated with spatial learning (R = −0.51, P = 0.13). Immunohistochemistry confirmed the in vivo findings: methoxy-X04 quantification of fibrillar Aβ did not indicate an association with cognitive performance (R < 0.3; Fig. 3A), whereas quantitation of Iba1 immunostaining showed a significant negative association between microglial activation and WM test scores (R = −0.77, P = 0.01; Fig. 3A). Multimodal findings in representative mice with good and poor WM performance are illustrated in Figures 3B and 3C.
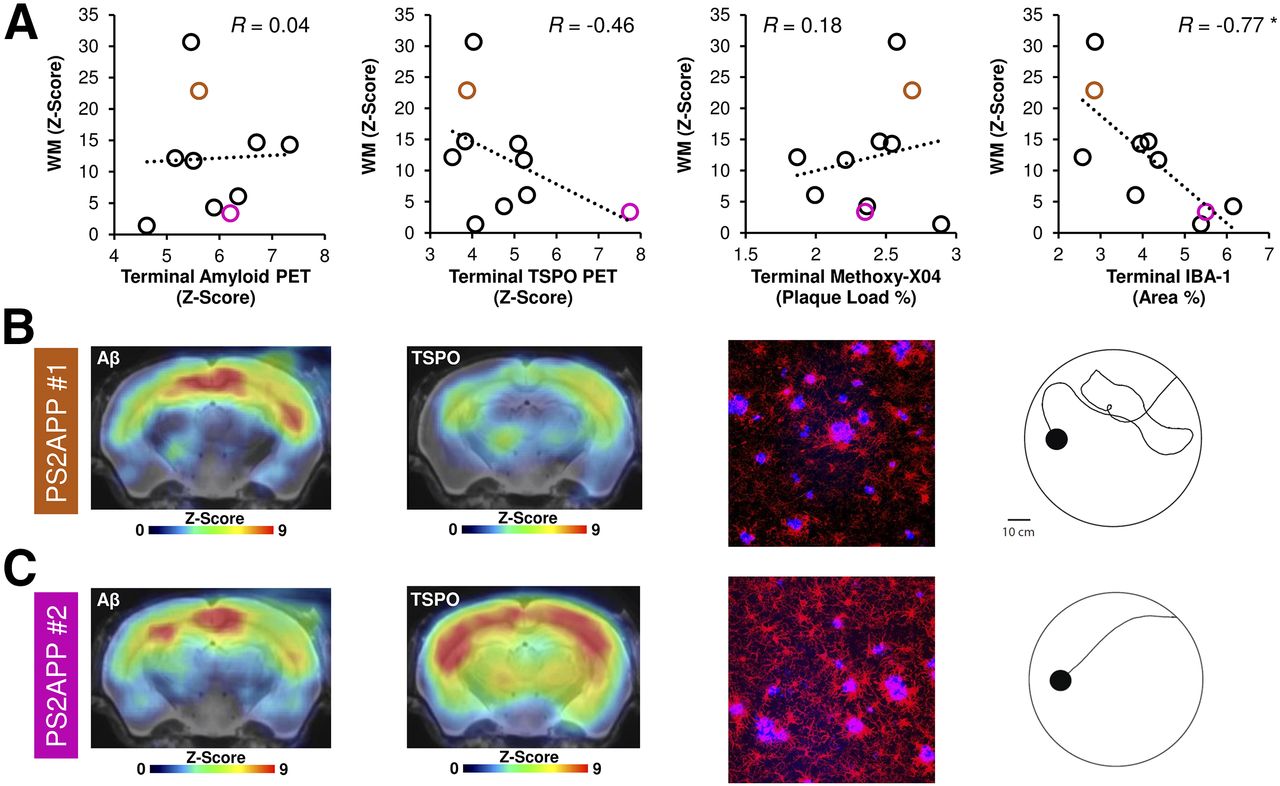
Multimodal correlation analysis of cognitive testing with terminal PET and immunohistochemical results in PS2APP mice at study termination. (A) Scatterplots show correlations between individual cognitive testing in WM task (WM, z score) with terminal PET and immunohistochemistry readouts. (B and C) Representative PET images (z score on MRI template), immunohistochemistry (fused methoxy-X04 [blue] and Iba1 [red]), and WM findings of individual mice, showing either low (B, orange) or high (C, magenta) markers of microglial activation at study termination. Corresponding data points in A are depicted in orange (#1, low markers of microglial activity) and magenta (#2, high markers of microglial activity). *P < 0.05.
Furthermore, we saw only a weak correlation between biochemical assays of soluble Aβ and cognitive performance in transgenic mice (R = −0.36, P = 0.30).
Prediction of Cognitive Performance by Serial PET Imaging
We undertook longitudinal in vivo observations of amyloidosis and microglial activity by PET to test whether early or cumulative alterations over time of the pathology biomarkers predicted the cognitive outcome of PS2APP mice. We found that better cognitive performance was strongly associated with microglial activation 5 mo earlier in forebrain (R = −0.71, P < 0.05; Fig. 4A) and especially in cognition-associated areas (R = −0.82, P < 0.01; Fig. 4B). Peak clusters of the amygdala, the entorhinal cortex, and the hippocampus as identified by SPM gave especially strong regional correlations of high earlier microglial activity and better cognitive performance (R = −0.95, P < 0.001; Fig. 4C). Statistical maps of the correlation between voxelwise microglial activity and WM performance revealed a pattern, with the strongest association being in brain areas involved in spatial learning networks, that is, the hippocampal formation, the thalamus, and the frontal neocortex (Fig. 4D) (28). There were no brain regions showing a negative correlation between TSPO PET at baseline and better terminal cognitive performance.
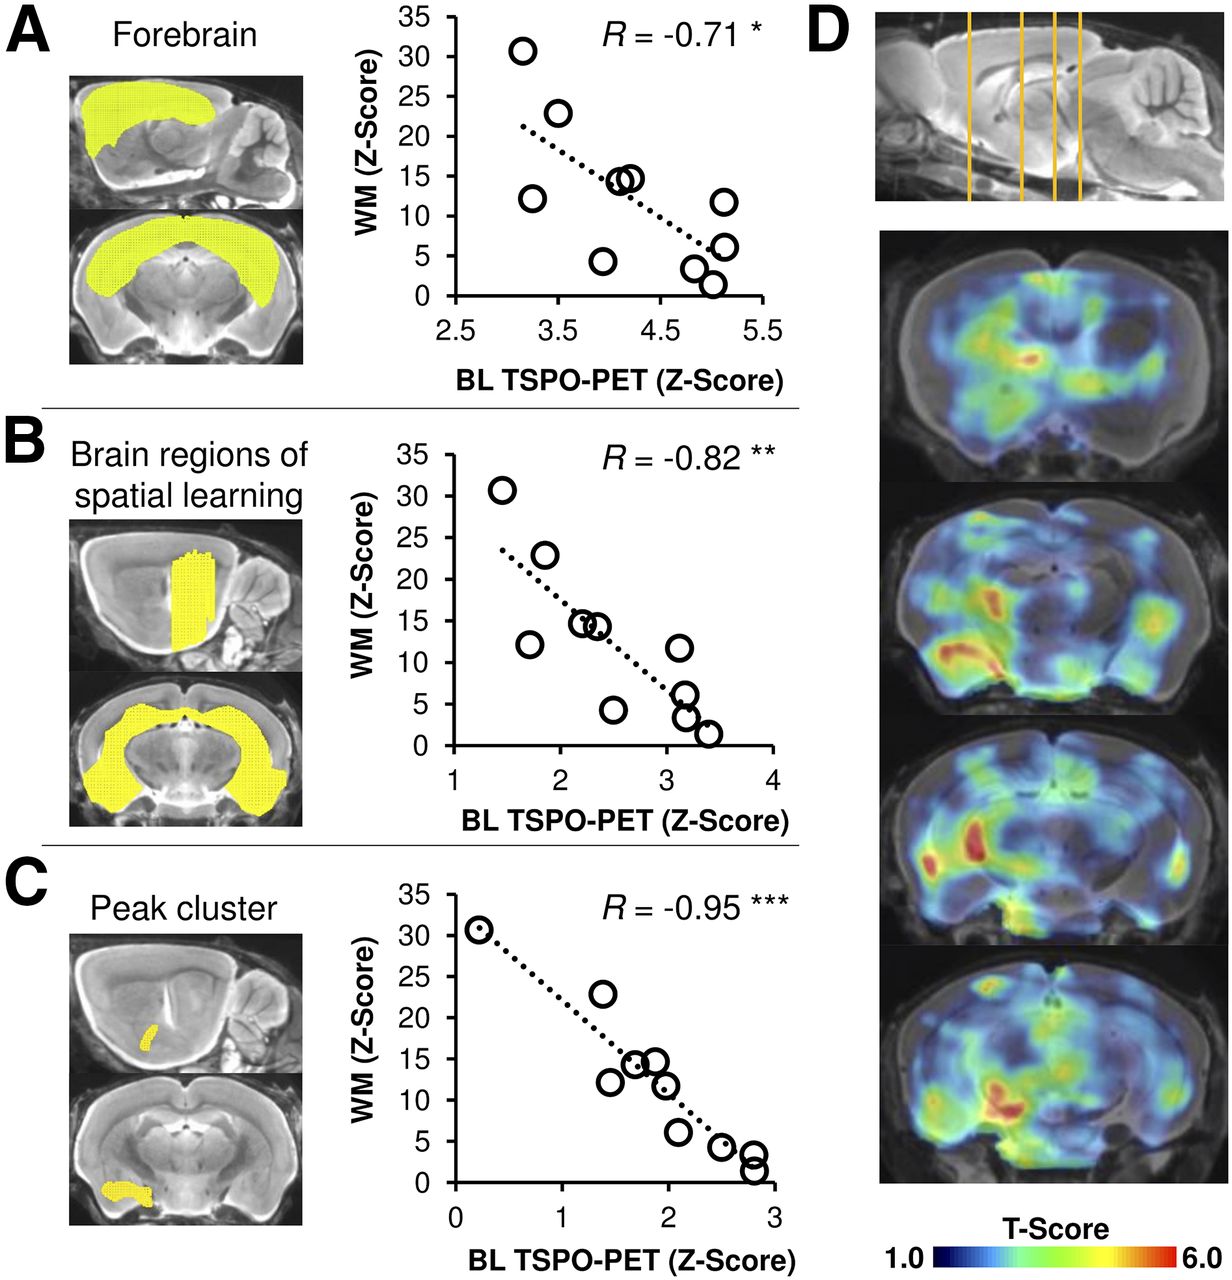
Prediction of cognitive performance by magnitude of microglial activation at baseline in PS2APP mice. (A–C) Correlations between individual findings in cognitive testing (z scores) with TSPO PET at baseline are presented by scatterplots for forebrain (A), brain regions associated with spatial learning (B), and amygdaloidal peak cluster (C). (D) Coronal slices depict statistical maps (t scores) of voxelwise correlation between TSPO PET at baseline (BL) and performance in WM at study termination on T1-weighted MRI template. *P < 0.05. **P < 0.01. ***P < 0.001.
We had predicted an opposite relationship for cumulative TSPO PET values over time during the whole 5-mo imaging period, since chronic activation of microglia could damage synapses, leading to neurodegeneration (7). However, we still observed the same positive correlation, meaning that high AUCs of microglial activity were associated with a better cognitive performance (Supplemental Figs. 1A–1C; supplemental materials are available at http://jnm.snmjournals.org). Correlations between the AUCs of microglial activity and WM performance were weak when compared with TSPO PET findings at baseline, but the spatial pattern of regions related to spatial learning networks was even better demarcated (Supplemental Fig. 1D). No brain region indicated a significant association between lower longitudinal AUCs of microglial activation and better terminal cognitive performance. There were no relevant associations of the Aβ PET signal at baseline or by longitudinal AUC analysis of amyloidosis with the terminal cognitive performance.
Finally, we asked whether there is a molecular correlate of the associations between microglial activation over time and terminal cognitive performance. Our terminal immunohistochemical analyses of synaptic density showed clear reductions of VGLUT1 in the dentate gyrus and the frontal cortex of PS2APP mice when compared with WT at 14 mo of age (Fig. 5A). Reductions of VGLUT1 in individual PS2APP mice had a moderately strong correlation with behavioral assessment of cognition (R = −0.53, P = 0.12 each; Fig. 5B). Even more importantly, we also observed that baseline TSPO PET predicted synaptic density measured 5 mo later in the dentate gyrus (R = 0.71, P < 0.05) and the frontal cortex (R = 0.57, P < 0.1; Figs. 5B and 5C). Thus, we found that an early microglial response to amyloid pathology in PS2APP transgenic mice protects synaptic density at follow-up.

Moderation of reductions of synaptic density in PS2APP mice by early microglial response. (A) Reduction in synaptic density (VGLUT1) in PS2APP mice when compared with WT. (B) Scatterplots showing correlation of individual VGLUT1 alterations, cognitive testing, and TSPO PET at baseline in dentate gyrus and frontal cortex of PS2APP mice. (C) Findings of synaptic density (VGLUT1) in representative C57BL/6 WT mouse (gray), together with 2 PS2APP mice, one indicating severe VGLUT1 loss (#1, orange) and other indicating only minor VGLUT1 loss (#2, magenta). Corresponding data points are highlighted in B. Error bars represent SEM. #P < 0.1. *P < 0.05. Scale bar represents 5 μm.
DISCUSSION
This preclinical investigation exploits the advantages of serial PET for monitoring disease progression in an amyloid transgenic mouse model of AD. For the first time, we report longitudinal TSPO and Aβ PET findings in conjunction with terminal behavioral testing and histologic or biochemical examination to depict associations between longitudinal amyloidosis and neuroinflammation with cognitive outcome in an Aβ/presenilin mouse model of AD. We found that high microglial activation at the onset of amyloidosis predicts for better cognitive performance in PS2APP mice at follow-up 5 mo later, when Aβ pathology is extensive. Interestingly, even longitudinally persistent and terminal elevation of microglial activity was associated with a better cognitive outcome at the end of the trial. On the other hand, early and longitudinal amyloidosis did not predict cognitive outcome and terminal assessments, nor was there any association between amyloidosis and cognition. Multimodal immunohistochemical and biochemical assessments of microglia, amyloidosis, and synaptic density validated and extended the in vivo molecular imaging results.
Neither longitudinal Aβ PET nor terminal immunohistochemistry for detection of fibrillar amyloidosis showed an association with the cognitive performance in individual PS2APP mice. Similarly, quantitative markers of Aβ had only weak correlations with cognition in aged humans (15). This seeming dissociation has been attributed to very early onset of fibrillary amyloidosis in AD, with attainment of a plateau level of amyloidosis in most patients by the time that cognitive deterioration has declared itself (29). Indeed, soluble fragments of Aβ might be the culprit toxic agents responsible for synaptic damage and cognitive deterioration (30), whereas fibrillar Aβ could represent an inert reservoir. Nonetheless, we did not find any correlation between terminal soluble Aβ concentration in brain extracts and cognitive performance in our PS2APP mice at 14 mo of age. Likewise, a recent review of different transgenic mouse models of AD did not find a significant overall correlation between soluble or insoluble levels of Aβ and cognitive function (31). In this regard, the brain levels of soluble Aβ may vary over time because of their dynamic turnover, which hampers the interpretation of results obtained at a single time point. We suppose that serial monitoring of soluble Aβ in cerebrospinal fluid over time might reveal more meaningful relationships with the terminal cognitive outcome. The present data do not support a link between progression of amyloidosis to Aβ PET and cognitive performance in individual PS2APP mice, as is in line with the conclusions of the aforementioned review (31).
Most importantly, we found a clear benefit of early and longitudinal microglial activation to TSPO PET on the cognitive outcome in this cohort of PS2APP mice (Figs. 3 and 4). This finding in vivo was supported by immunohistochemical analysis showing that the magnitude of synaptic density loss in transgenic mice relative to WT was moderated by an early and ongoing microglial response. We also saw some evidence for an association between more pronounced stronger terminal neuroinflammation at 14 mo and better preservation of cognitive function (Fig. 2). At first glance, our findings seem at odds with findings of neuronal dysfunction arising from exposure of neurons to proinflammatory mediators during chronic microglial activation (7). However, not all microglia are equal, and it remains a question of specifically which activation state of microglia is actually revealed by an elevated TSPO PET signal or Iba1 immunohistochemistry. In one study, there were some hints that elevated TSPO expression is associated with a CD86-positive proinflammatory microglial phenotype (32). Nonetheless, the authors of that study also observed colocalization of TSPO immunostaining with CD206-positive antiinflammatory microglia near amyloid plaques, possibly indicating microglial phagocytosis of toxic Aβ (33). Clearance of accumulating debris such as misfolded proteins is indeed a crucial function of antiinflammatory microglia in protecting brain tissue homeostasis (7). Interventional studies with, for example, PPARγ agonists to modify microglial phenotype, along with serial microglial monitoring and behavioral testing, might address this question in more detail (34). From the current data, it emerges that early microglial activation ameliorates the cognitive decline in PS2APP mice (Fig. 3). Thus, the ability to respond to the developing amyloidosis caused by genetic modification of the mouse model seems an essential aspect of the innate immune system. The net beneficial effect of longitudinal microglial activation on cognitive function might be a matter of duration, as synapses will ultimately suffer from excessive exposure to proinflammatory cytokines. Thus, the present protective effect of elevated microglial activity on cognitive function in PS2APP mice might have turned into deterioration at times after 14 mo.
Another possible explanation for contradictory findings in studies on neuroinflammation and subsequent cognitive outcome might be attributable to differing mechanistic approaches. Most such investigations used mice with specific manipulations of genes involved in inflammatory pathways of AD and tested against WT data. We took advantage of the known phenotype heterogeneity of the PS2APP mouse (35) to study associations of biomarkers and the terminal cognitive performance in individual mice of the same genotype. Our findings imply that strong microglial activation is probably necessary to cope with the characteristically heavy Aβ deposition in these mice (14). This conception fits our current findings of preserved cognitive performance in mice with an early microglial response. As an explanation for this phenomenon, we invoke the recent description of 2 peaks of microglial activation in the time course of human sporadic AD, one occurring in the presymptomatic stage during early amyloid build-up and the other presenting in the dementia stage (36). Amyloid mouse models have little neuronal loss and more closely mimic primarily presymptomatic and mild-cognitive-impairment stages of human AD (27). Taken together, our preclinical data support the speculation of an early protective peak of microglial activation during initial amyloid aggregation (36). Because PS2APP mice show their peak of microglial activation at approximately 11.5 mo (Fig. 1), we speculate that they may lack a second peak, as they do not show much progression of neuronal loss even at very late stages at more than 16 mo of age (18).
The main strength of PET lies in its potential to monitor disease-related alterations and interventions over time in an individual. Our present findings are encouraging for longitudinal PET monitoring of microglial activation in human AD, as was recently performed with a first-generation TSPO ligand (36). A longitudinal design would enable successive correlation of molecular imaging with cognitive deterioration over time. We suppose that appropriate modulation of microglial activation according to disease stage may lead to interventions with some efficacy. A second main advantage of PET lies in spatial mapping of molecular markers in the whole brain. For the first time, we have generated 3-dimensional maps of microglial activity over time in individual mice (AUC maps) and used these maps for a statistically based voxelwise correlation analysis with cognitive outcome parameters. Statistical testing of SPM-defined regions should be interpreted with care, but our analyses also clearly showed an enhanced association between PET measures of microgliosis in predefined brain regions linked to spatial learning with preserved cognition (28). This methodologic innovation provides the basis for designing intervention studies with endpoints relevant to human AD.
CONCLUSION
Early microglial response predicts an improved cognitive outcome in PS2APP mice, whereas the magnitude of fibrillar amyloidosis in early disease stages is not predictive of cognitive performance 5 mo later. These findings emphasize the importance of biomarkers for serial monitoring of microglial activity in AD. Furthermore, the results suggest than the innate immune system could constitute a more relevant therapeutic target than amyloidosis regarding the primary objective of preserving cognitive performance.
DISCLOSURE
Peter Bartenstein and Axel Rominger received speaking honoraria from Piramal Imaging, Laurence Ozmen and Karlheinz Baumann are employees of Hoffmann-La Roche, and Christian Haass is an advisor of Hoffmann-La Roche. Florbetaben precursor was provided by Piramal Imaging. PS2APP mice were provided by F. Hoffmann-La Roche AG. GE Healthcare made GE-180 cassettes available through an early-access model. This work was supported by the Deutsche Forschungsgemeinschaft (DFG) by grants to Matthias Brendel and Axel Rominger (BR4580/1-1 and RO5194/1-1) and within the framework of the Munich Cluster for Systems Neurology (EXC1010SyNergy). No other potential conflict of interest relevant to this article was reported.
Acknowledgments
We thank Karin Bormann-Giglmaier for excellent technical assistance. We acknowledge Inglewood Biomedical Editing for manuscript editing.
Footnotes
Published online Sep. 27, 2018.
- © 2019 by the Society of Nuclear Medicine and Molecular Imaging.
REFERENCES
- Received for publication July 16, 2018.
- Accepted for publication September 10, 2018.


Jump to section
Related Articles
Cited By...
- Individual regional associations between A{beta}-, tau- and neurodegeneration (ATN) with microglial activation in patients with primary and secondary tauopathies
- Imaging Neuroinflammation in Neurodegenerative Disorders
- MicroPET evidence for a hypersensitive neuroinflammatory profile of gp120 mouse model of HIV
- The Future of Nuclear Medicine Depends on the Quality of Its Research: Researchers at the University of Heidelberg Receive the Award for Best Article of the Year
- Trem2 Deletion Reduces Late-Stage Amyloid Plaque Accumulation, Elevates the A{beta}42:A{beta}40 Ratio, and Exacerbates Axonal Dystrophy and Dendritic Spine Loss in the PS2APP Alzheimer's Mouse Model
- Longitudinal PET Monitoring of Amyloidosis and Microglial Activation in a Second-Generation Amyloid-{beta} Mouse Model