


Abstract
Optical molecular imaging using fluorescently labeled monoclonal antibodies is of significant added value in guiding surgical or endoscopic procedures. However, development of tracers for clinical trials is complex, and implementation in the clinic is therefore slow. We present a roadmap for development and translation of monoclonal antibody tracers into a drug product compliant with current good manufacturing processes (cGMPs). Methods: The production process for cetuximab-800CW and trastuzumab-800CW was optimized with regard to dye-to-protein ratio and formulation buffer. Promising formulations were produced under cGMP conditions and advanced to a full-scale stability study. Tracers were analyzed for stability by size-exclusion high-pressure liquid chromatography, pH measurement, osmolality, visual inspection, and sterility, as required by the European Pharmacopeia and cGMP guidelines. Results: Seven formulations were investigated for cetuximab-800CW and 10 for trastuzumab-800CW. On the basis of the formulation study results, we chose 2 formulations per antibody for investigation during the full-scale stability study. These formulations all performed well, showing good compliance with the acceptance criteria set for each product. Conclusion: We designed a roadmap to standardize the development, formulation, and cGMP translation of molecular fluorescent tracers. Using our standardized approach, we developed 2 stable antibody-based tracers for clinical use. The proposed roadmap can be used to efficiently develop a cGMP-compliant formulation and improve the translation of newly developed optical tracers to first-in-human use.
Monoclonal antibodies are known for their ability to bind to cell receptors, cytokines, or other antigenic epitopes and are used as drugs for oncologic and inflammatory diseases. Additionally, specific binding and biodistribution characteristics make them well suited as drug delivery scaffolds, such as in radioimmunotherapeutics and antibody–drug conjugates (1). In nuclear medicine, antibodies have been extensively used as carrier molecules for PET and SPECT isotopes (2–9). PET and SPECT allow for whole-body imaging of primary tumor deposits and metastases but have limitations such as relatively poor spatiotemporal resolution and limited options for intraoperative or endoscopic confirmation (10,11).
Near-infrared (NIR) fluorescent molecular imaging has several advantages over standard cross-sectional imaging, as optical imaging allows for high-resolution, real-time signal detection. Imaging in the NIR spectrum has limited autofluorescence, scattering, and tissue absorption (12). However, signal penetration is limited to several millimeters. The feasibility of optical imaging during invasive procedures has been extensively explored in animal models (13–17) and phase 1 clinical trials with promising results (18–23). However, progress of new tracers to the clinic has been slow, as translation of a novel tracer into a product compliant with current good manufacturing processes (cGMPs) is challenging and presents a major hurdle in development. In this paper, we present a roadmap that can aid in bringing new tracers from the development phase to a cGMP-compliant investigational medicinal product. This approach is illustrated by the results from our development and translation of the optical tracers cetuximab-800CW and trastuzumab-800CW.
MATERIALS AND METHODS
Materials
Cetuximab (Erbitux; Merck KGaA) and trastuzumab (Herceptin; Roche Pharma AG) are drugs for human use approved by the European Medicines Agency. Sodium phosphate, sodium chloride, sucrose, polysorbate 80, sodium citrate, and citric acid (all Spruyt-Hillen) were of European Pharmacopeia (EP) quality. Dimethyl sulfoxide (Sigma-Aldrich) was of EP quality. Polysorbate 20 (VWR) was of reagent grade. Trehalose (Hayashibara) was of EP grade. Water for injection (produced in-house) was of EP quality. IRDye 800CW of cGMP grade was acquired from LI-COR Biosciences. Buffers used in the conjugation and formulation process were made in-house.
Tracer Conjugation and Purification
Labeling procedures were derived from those used for bevacizumab-800CW, as described previously (24). Product yield was determined by size-exclusion high-pressure liquid chromatography. The purified tracer was diluted to 1 mg/mL using formulation buffer and consequently passed over a 0.22-μm (Millex GV; Merck Milipore) bacteria-retaining filter and filled into glass vials at a volume of 6 mL per vial. The vials were closed with a rubber stopper and an aluminum closure.
Quality Control
The product was analyzed for label efficiency, protein concentration, soluble protein aggregates, and unbound IRDye by size-exclusion high-pressure liquid chromatography. The system consisted of a 5110 Chromaster pump, 5210 Chromaster injector, and 5430 Chromaster diode-array detector (Hitachi) and a Biosep SEC S3000 300 × 7.2 mm column (Phenomenex), with isocratic elution and a mobile phase of phosphate-buffered saline, pH 7.6, at a flow of 1 mL/min. Absorption was measured from 200 to 900 nm and analyzed at 280 nm for protein measurements and 790 nm for IRDye measurements. The system was operated by a CSM Software package.
Solution color, turbidity, and the general appearance of the product were assessed visually. Osmolality, pH, sterility, bacterial endotoxins, bioburden, residual solvents (dimethyl sulfoxide), and visible particles were tested according to their respective EP monographs.
The target affinity of the tracer was measured by custom ELISA. Briefly, 96-well plates were coated with either recombinant EGFR or HER2 (Sino Biologicals) overnight at pH 9.4 and a temperature of 2°C–8°C. Plates were blocked with 1% bovine serum albumin (VWR Chemicals) in phosphate-buffered saline for cetuximab and 1% human albumin (Sanquin) in phosphate-buffered saline for trastuzumab. Serial dilutions of both tracer product and unconjugated commercial antibody were made in phosphate-buffered saline. Antihuman IgG antibody conjugated to horseradish peroxidase (Jackson Immunoresearch Laboratories) was used to detect target-bound tracer. Signal was generated by adding 100 μL of 3,3′,5,5′-tetramethylbenzidine (Thermo Fisher) solution and stopping the reaction with 2 M sulfuric acid after 5 min. 3,3′,5,5′-tetramethylbenzidine absorption was read at 450 nm. A 4-parameter log(dose)–response curve was fitted to the data with GraphPad Prism, version 5.04. From the fit, the concentration at the 50% maximum response (EC50) value was calculated. Target affinity (A) was calculated using Equation 1: Eq. 1
Eq. 1
Compendial analyses were validated according to their respective compendial monograph, as applicable. Noncompendial tests were qualified according to relevant parameters in accordance with International Conference on Harmonization Q2(R1) guidelines.
Development and Translation Roadmap
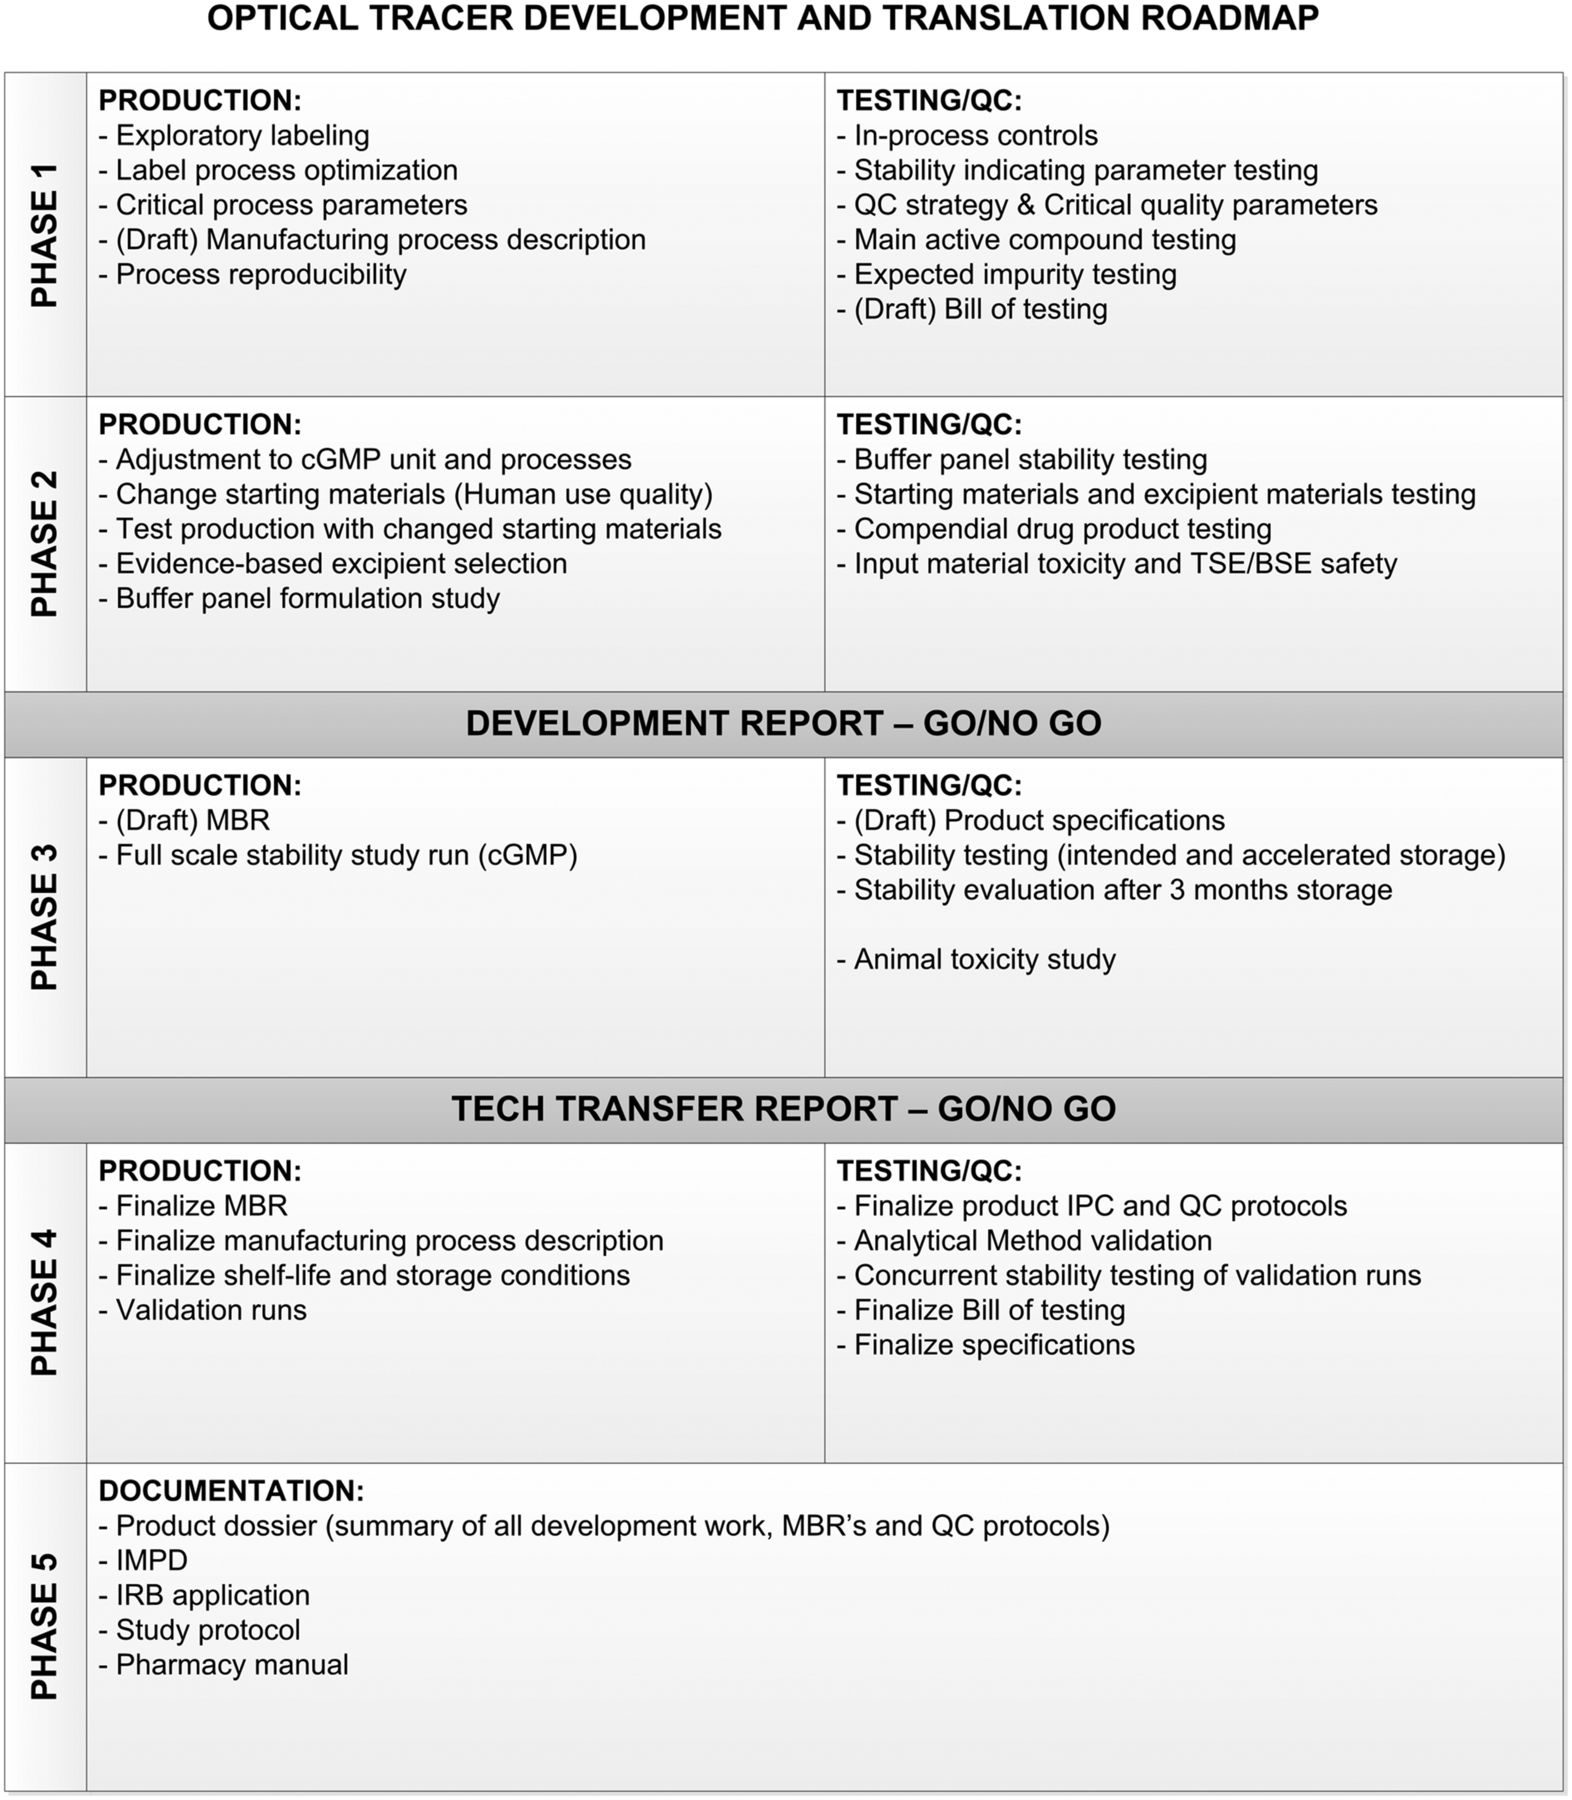
The roadmap (Fig. 1) we designed divides the process of development and clinical translation into 5 phases. In phase 1, the label process is explored on a small scale to identify the critical parts of the process, resulting in a reproducible method for production and testing of the tracer.

Optical tracer development and translation roadmap showing critical activities, tests, and reports to properly translate product to cGMP. BSE = bovine spongiform encephalopathy; IMPD = investigational medicinal product dossier; IPC = in-process control; IRB = institutional review board; MBR = master batch record; QC = quality control; TSE = transmissible spongiform encephalopathy.
In phase 2, the process is evaluated and adjusted to fit in with cGMP procedures and facilities. Any changes to the starting materials are made in this phase, if possible, to have consistent batches later in the process. Next, a formulation study is performed. For this study, a panel of buffers is designed. This panel should be individualized for every antibody and take into account evidence on compatible excipients. The results of this formulation study should be evaluated to make a go/no-go decision on the continuation of development.
Phase 3 encompasses the full-scale stability study and animal toxicity study. The product for this phase should be comparable to the clinical trial material. Draft specifications should be designed to evaluate drug stability. These specifications should be based on performance during formulation studies and on compendial and cGMP requirements. Inclusion of both the intended storage temperature and an accelerated storage condition can be considered because it adds to the knowledge of the worst-case scenario. We consider the minimum for clinical viability to be stability results that conform with specifications after 3 mo of storage.
In phase 4, one or more productions are performed at clinical scale and under full cGMP conditions to confirm that the process is robust and reproducible. Any product from this phase is retained and entered into the stability study to confirm the data from the initial stability study.
Phase 5 establishes a product dossier of the results of phases 1–4. In addition, the investigatory medicinal product dossier is written and is included in the institutional review board application. We used this roadmap to develop and translate 2 antibody-based tracers, the results of which are described in this work.
Data Analysis
Averages were calculated for all continuous variables, with 95% confidence intervals for protein concentration and impurity levels. Average values were compared with specifications to determine the suitability of the product. Categoric and ordinal variables (protein identity, protein integrity, sterility, visible particles) were scored as pass/fail. Graphs were produced using GraphPad Prism.
RESULTS
Phases 1 and 2: Tracer Characterization and Formulation Studies
Initial experiments for both cetuximab and trastuzumab showed high labeling efficiency for both antibodies (cetuximab > 60%, trastuzumab > 75%) and no incompatibility with labeling reagents. However, because amino acids were present in the antibody starting materials, the antibodies were buffer-exchanged to a phosphate buffer of pH 8.5 for label conjugation.
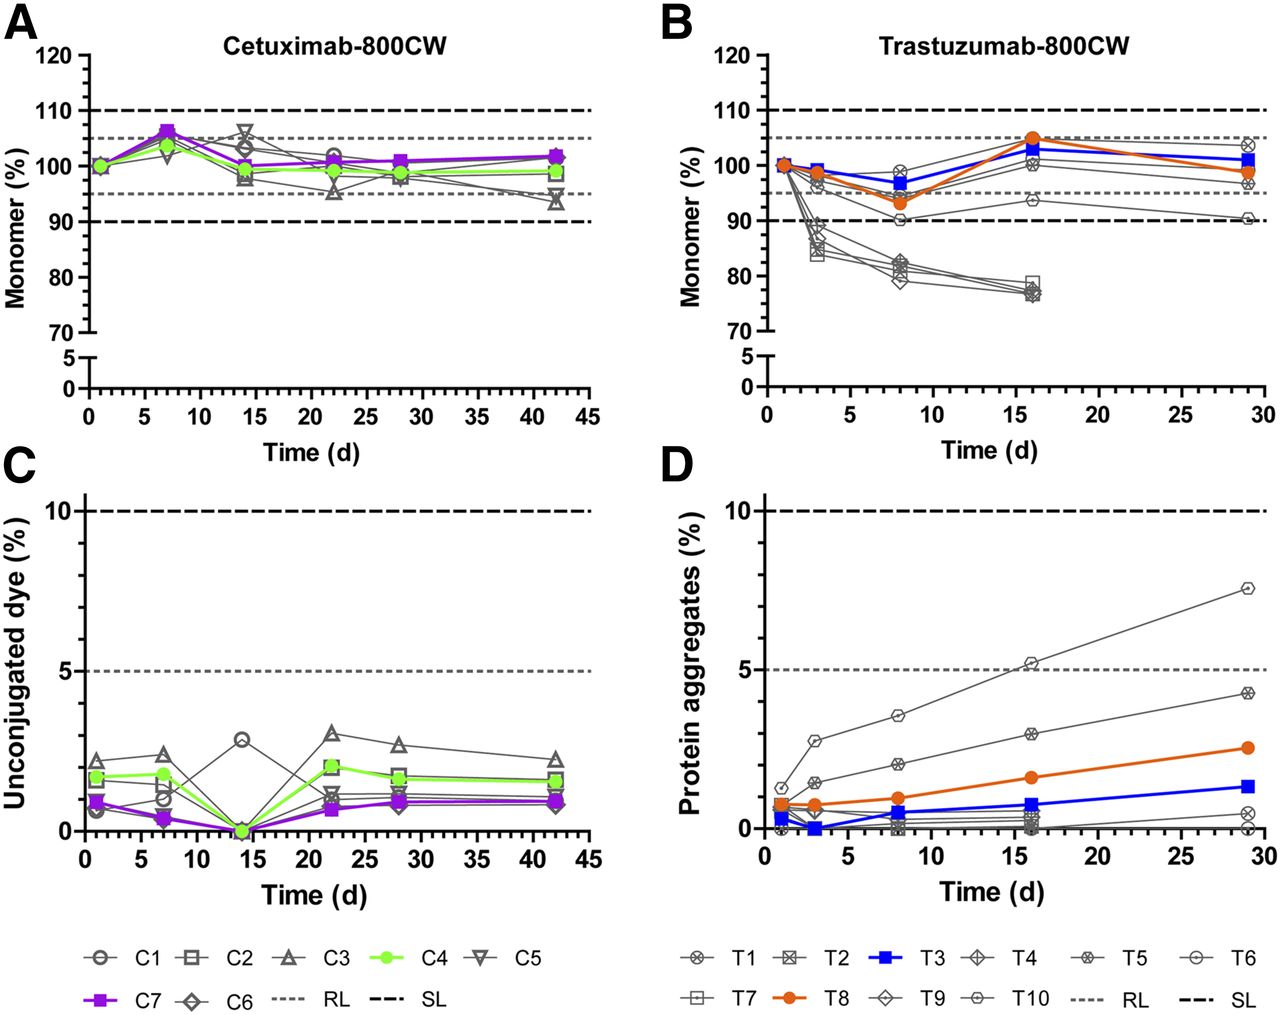
Buffer panels were designed for both cetuximab-800CW and trastuzumab-800CW. Compositions were based on available evidence for buffer and excipient compatibility. Additionally, when possible, the panel aimed to choose a simple buffer that would provide sufficient stability (Supplemental Table 1; supplemental materials are available at http://jnm.snmjournals.org). The panel for cetuximab-800CW and trastuzumab-800CW consisted of 7 and 5 formulations, respectively, which were stored at 2°C–8°C and observed for 42 and 29 d, respectively. For cetuximab-800CW, the dye-to-protein ratio (D/P) was kept at 2 for all formulation study batches; for trastuzumab-800CW, D/Ps of both 1 and 2 were tested during formulation, since initial experiments showed D/P to be related to stability. The result was 10 test solutions for trastuzumab-800CW and 7 for cetuximab-800CW. The main size-exclusion high-pressure liquid chromatography diode-array detector results from the formulation studies were monomer content and observed impurities (Fig. 2).

Formulation study results for cetuximab-800CW and trastuzumab-800CW. Protein monomer concentration (A and B) and main impurity in both products (C and D) are shown. Monomer concentration data are normalized to first measurement to show relative protein breakdown. Formulations considered feasible for development are shown in color; unfeasible formulations are shown in gray scale. Dashed and dotted lines indicate acceptance limits for product release or end of shelf-life. RL = release limit; SL = (end of) shelf-life limit.
All tested formulations of cetuximab-800CW performed well; no protein aggregates were detected, and levels of unconjugated dye were below the acceptance limit of 5% at all times (Fig. 2C). Protein monomer concentration (Fig. 2A) was more than 98% at all times for cetuximab formulations C1, C2, C4, C6, and C7. The lowest level of protein concentration was observed for C3 and C5 (both having a lower pH of 5.0) after 42 d (94% of starting monomer concentration). No acceptance limits were exceeded. On the basis of their observed protein monomer stability and levels of impurities, we selected a 50 mM citrate buffer of pH 6.0 (C4) and a 50 mM phosphate buffer of pH 7.0 (C7) for further development in a full-scale stability study.
For trastuzumab-800CW (Fig. 2B), formulations containing trehalose (T2, T4, T7, and T9) showed a rapid drop of 17%–21% in monomer concentration in the first 8 d. The drop in concentration coincided with the formation of insoluble particulate matter at the bottom of the vial. Because of these observations, we stopped measurements of these formulations after 16 d. Conversely, formulations containing sodium chloride (T1, T3, T5, T6, T8, and T10) showed a stable monomer concentration. T1 and T3 showed monomer concentrations of more than 95% at all tested moments. T5, T6, and T8 showed monomer concentrations of more than 93% at all tested moments. T10 showed more than a 9.5% reduction in monomer concentration at 8 and 29 d. T6 showed some insoluble aggregates at the final assessment point after 29 d. No unconjugated dye was detected during the study. Levels of protein aggregates (Fig. 2D) were approximately 1% at the start of the study and increased steadily over time for all formulations. At 29 d, levels of aggregates ranged from 0.5% (T1) to 7.6% (T10). None of the tested solutions exceeded the acceptance limit of 10%. Because T6, T8, and T10 (all D/P = 2) showed overall lower monomer concentrations and higher levels of aggregates than T1, T3, or T5 (all D/P = 1), we suspected that the amount of conjugated dye influenced the stability of the protein. However, since a lower D/P results in lower amounts of dye delivered to the target, we decided to investigate 10 mM phosphate buffer at pH 7.0 with D/Ps of 1 and 2 (T3 and T8, respectively) for further development in a full-scale stability study.
Phase 3: Full-Scale Stability Study
Stability studies were designed to run for 12 mo in real time (2°C–8°C), with an additional accelerated arm (15°C–25°C) for the first 3 mo. In the current study, we present the results of the preliminary analysis and clinical feasibility assessment after 3 mo of stability study. On the basis of the results of phase 2, development was focused on the stability of formulations C4 (cetuximab-800CW in 50 mM citrate, pH 6.0; D/P = 2), C7 (cetuximab-800CW in 50 mM phosphate, pH 7.0; D/P = 2), T3 (trastuzumab-800CW in 10 mM phosphate, pH 7.0; D/P = 1), and T8 (trastuzumab-800CW in 10 mM phosphate, pH 7.0; D/P = 2). Full-scale batches of all formulations were produced in the cGMP unit of the Department of Clinical Pharmacy and Pharmacology at the University Medical Center Groningen, resulting in 90 vials of C4, 84 of C7, 82 of T3, and 90 of T8. Specifications and limits based on applicable EP monographs, relevant guidelines, or development results were established before the start of the stability study (Supplemental Table 2).
The main stability results for both tracers show that cetuximab protein monomer levels (Fig. 3A) were within limits after 3 mo, with mean levels of 96.9% at 2°C–8°C and 96.7% at 15°C–25°C for C4 (50 mM citrate, pH 6.0; D/P = 2) and with levels of 102.6% at 2°C–8°C and 103.8% at 15°C–25°C for C7 (50 mM phosphate, pH 7.0; D/P = 2). Unconjugated dye (Fig. 3C) was present at levels of approximately 2% and did not increase notably during the study. Protein aggregates were not detected. These results indicate both formulations to be stable and of high purity.
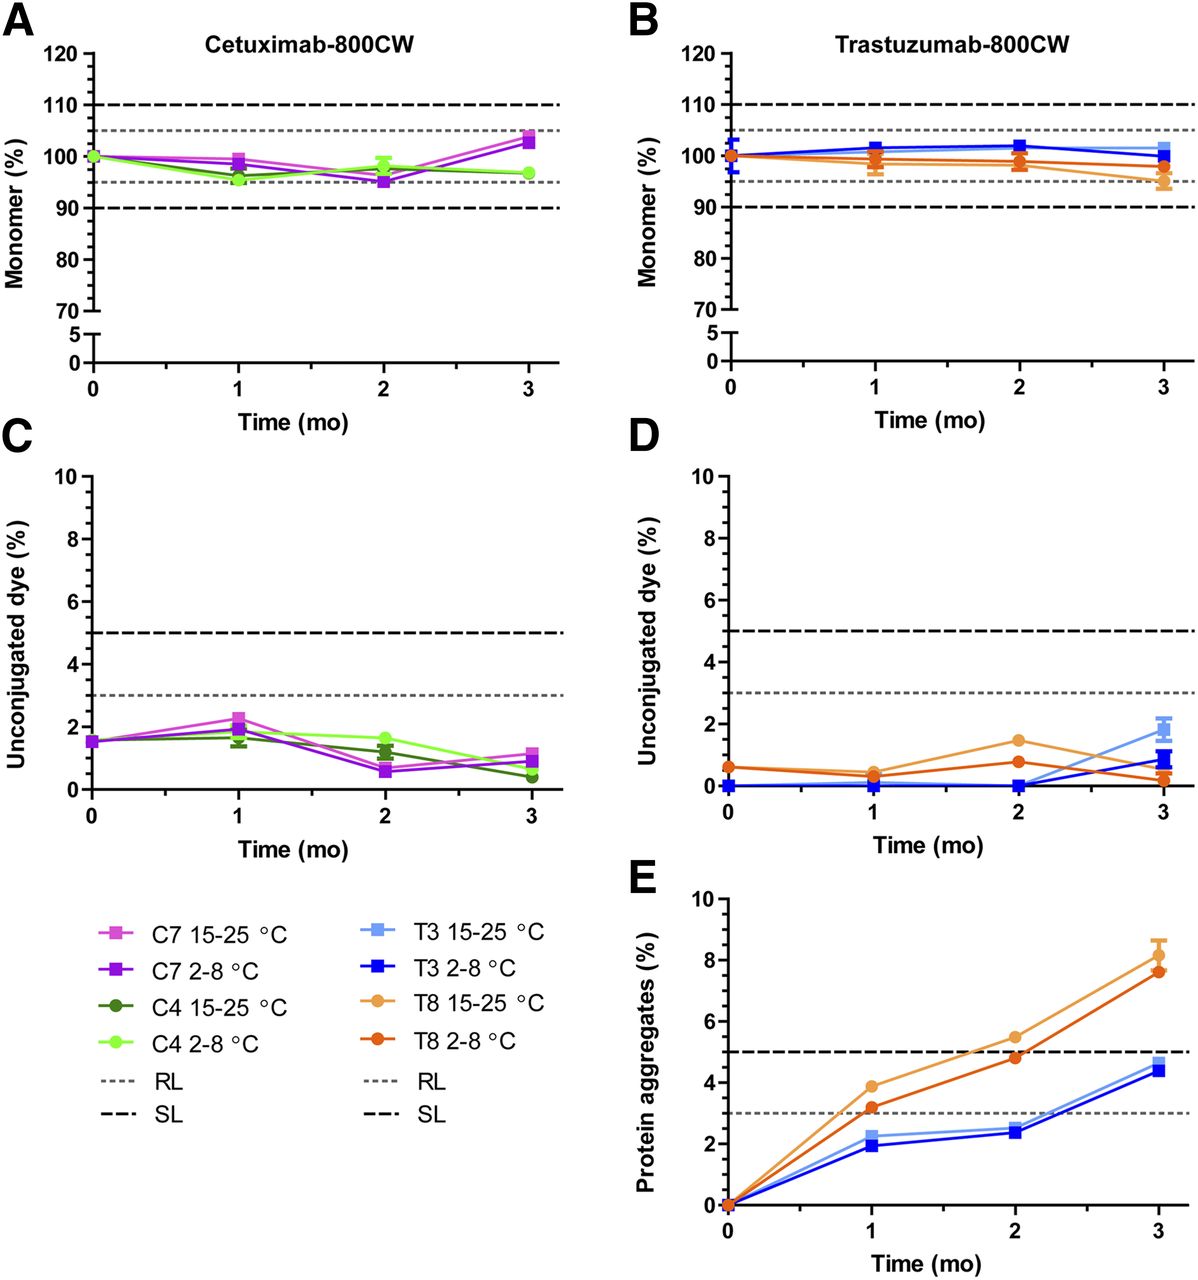
Cetuximab-800CW and trastuzumab-800CW main stability results. (A and B) Monomer concentration. Data are normalized to average measured at start of study to show relative protein breakdown. (C and D) Unconjugated dye, presented as percentage of total IRDye 800CW. (E) Soluble protein aggregates for trastuzumab-800CW. No aggregates were detected during stability study for cetuximab-800CW. Dashed and dotted lines show acceptance limits for product release and end of shelf-life. Data are presented as averages with 95% confidence interval for 5 measurements. RL = release limit; SL = (end of) shelf-life limit.
Trastuzumab monomer levels were stable after 3 mo in formulation T3 (10 mM phosphate, pH 7.0; D/P = 1), with mean levels of 99.9% at 2°C–8°C and 101.5% at 15°C–25°C, but showed a slight decrease in T8 (10 mM phosphate, pH 7.0; D/P = 2) to mean levels of 97.9% at 2°C–8°C and 95% at 15°C–25°C (Fig. 3B). Unconjugated dye levels (Fig. 3D) were present at 0%–1% at the start of the study and did not exceed 2% at any time for any tested samples. Conversely, soluble protein aggregates (Fig. 3E) were not detected at the start of the study but showed a steady increase as the study progressed, resulting in mean levels of 4.6% and 8.1% aggregates after 3 mo at 15°C–25°C for T3 and T8, respectively. T8 exceeded the acceptance limit for aggregates (5%) after approximately 2 mo, whereas T3 was still below this limit at 3 mo. No major differences in impurities were observed for the 2 storage conditions.
Target affinity ELISA showed sigmoidal dose–response curves at all performed tests for C4, C7, T3, and T8, with comparable binding curves for the tracer and standard (fresh unlabeled antibody). Representative binding curves for cetuximab-800CW (C7, 2°C–8°C, 3 mo) and trastuzumab-800CW (T3, 2°C–8°C, 3 mo) alongside standard (Fig. 4) are depicted. Target affinity (Supplemental Table 3) for C4 was 113% at the start of the study and declined to 76% after 3 mo at 2°C–8°C and 79% at 15°C–25°C. For C7, target affinity started at 86%. When stored at 2°C–8°C, it dropped to 77% after 2 mo but showed an increase to 98% at 3 mo. Stored at 15°C–25°C, an increase was seen after 1 mo to 108%, which then steadily decreased to 83% at 3 mo. For trastuzumab-800CW, target affinity results tended to fluctuate over time. Target affinity for T3 was 78% at the start of the study and was then measured at 68%, 73%, and 85% after 1 mo, 2 mo, and 3 mo stored at 2°C–8°C, respectively. At 15°C–25°C, target affinity was measured at 129%, 55%, and 80% after 1 mo, 2 mo, and 3 mo, respectively. For T8, target affinity was 78% at the start of the study. The 2°C–8°C batch was then measured to be 63%, 80%, and 82%, after 1 mo, 2 mo, and 3 mo storage, respectively, whereas the 15°C–25°C batch was 79%, 67%, and 68% after 1 mo, 2 mo, and 3 mo of storage, respectively.
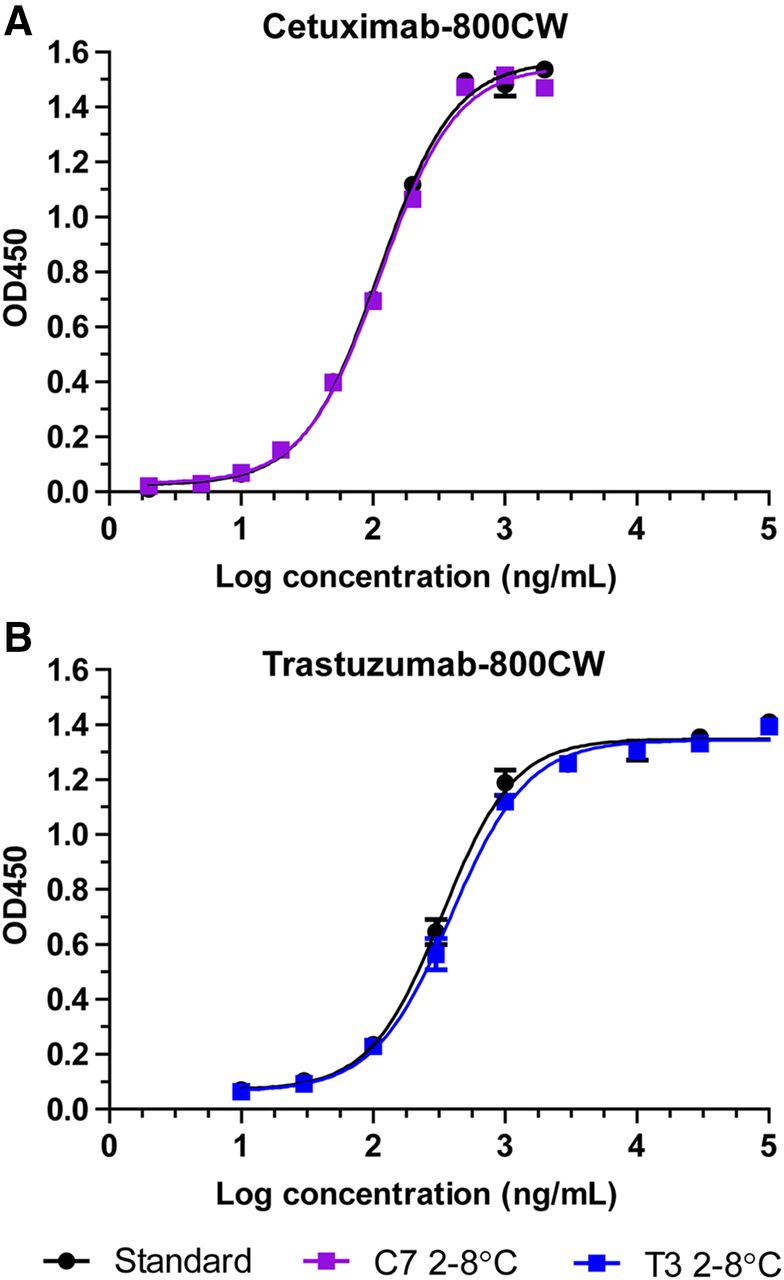
Representative binding curves for target affinity ELISA for cetuximab-800CW (A) and trastuzumab-800CW (B) after 3 mo of refrigerated storage. Black symbols and curve indicate reference standard of unlabeled antibody. Data are presented as average and SD of duplicate measurements. OD450 = absorption at 450 nm.
From the additional stability results (Supplemental Table 3), we identified abnormal chromatography results when testing after 2 mo in the room temperature batch of C4. An additional peak appeared at 280 nm at around 11 min, possibly indicating a low-molecular-weight protein or peptide variant. The peak was present in only the 5 room temperature samples. The exact nature of the peak identity was not clear, and it was not visible in other samples or at later time points.
In summary, we considered both the cetuximab C7 formulation (50 mM phosphate, pH 7.0; D/P = 2) and the trastuzumab T3 formulation (10 mM phosphate, pH 7.0; D/P = 1.0) feasible for clinical testing. Both tracers were stable and of high purity and retained their main mode of action for at least 3 mo when stored in the refrigerator in their chosen formulations. Further batches will be made at the scale of the stability study under cGMP conditions to complete phase 3, and the manufacturing process will be validated in phase 4. Toxicity testing can be performed with material produced during phase 4. In our case, since both cetuximab and trastuzumab are registered medicinal products with a well-known safety profile, and the nontoxicity of IRDye 800CW has been established previously (25), we chose to omit toxicity testing and apply for microdose clinical phase 0/1 studies instead.
DISCUSSION
Development of cGMP-compliant NIR tracers is a challenging exercise, as evident from the slow progress to clinical application despite promising results from preclinical and early clinical studies. We present a roadmap for a standardized approach to development and translation. The roadmap includes a buffer panel formulation study, followed by a focused long-term stability study, and was used successfully to translate both cetuximab-800CW and trastuzumab-800CW to a product fit for clinical testing.
Molecular NIR fluorescence is a novel imaging modality with several advantages over the established modalities such as PET, CT, and MRI. Using existing, approved antibodies to target NIR dye distribution provides an interesting opportunity because the pharmacokinetic and pharmacodynamic properties are already known from studies performed during drug approval, facilitating tailoring of the tracer for clinical use (26,27). Because of developmental challenges and lack of established guidelines for development or implementation, the number of tracers reaching the clinical trial phase has remained limited. Among tracers based on IRDye-conjugated antibodies, only bevacizumab (20,28,29), girentuximab (30), cetuximab (19), and panitumumab (31,32) have running or completed clinical trials.
However, in general, very few details are given on the development and formulation of these tracers (14,24,33–35). Several publications have addressed the translation and clinical implications of NIR imaging, but these discuss mostly the camera technology and the design of clinical trials (31,32,36,37), leaving researchers with little guidance on the steps required to progress a tracer from experiment to clinical product. The roadmap we present can fill this gap in the available literature by giving researchers a bird’s-eye view of the steps leading up to the first clinical-grade production.
Validation of analytic methods for antibody-based tracers is problematic, as in most cases there will be no reference standard with which the product samples can be compared. The use of a commercially available registered drug product provides a satisfactory reference standard for the protein; however, identification and quantification of impurities remain an open issue.
As shown for both cetuximab-800CW and trastuzumab-800CW, buffers were selected (C7 and T3) with optimal balance between buffer complexity and product stability. When screening of large numbers of additives and excipients for compatibility is desired, our method may be inefficient, as it is best suited to selecting a formulation in early development from a smaller panel of options. By incorporating ample variation into the buffer panel of phase 2, one can explore the limits of the buffer conditions tolerated by the product. Whereas the panel is based around known compatible excipients of the carrier protein to minimize the chance of essential incompatibility, shifts in excipient compatibility can result from dye conjugations, as shown by the incompatibility of our trastuzumab-800CW with our trehalose formulations (T2, T4, T7, T9). Trehalose is used as an excipient in Herceptin (trastuzumab’s clinical formulation) but was no longer compatible after IRDye conjugation. This loss of compatibility may be due to a shift in isoelectric point because of dye conjugation or to an interaction between IRDye 800CW and trehalose. The known sensitivity of trastuzumab to deamidation and aggregation in solution (38) might additionally explain these observations. Another limitation of this approach is expected when applied to a new, not yet marketed antibody, as the compatible excipients are not yet fully known, making this approach more challenging for initial buffer discovery.
The roadmap is based around requirements from the EP and legislation by the European Medicines Agency. Therefore, the exact execution of the phases, and the required content for the milestone reports, may differ slightly if the tracer is not produced in Europe. However, the roadmap primarily provides handholds for tracer development and a strategy for product translation, which can be applied in any region of the world.
CONCLUSION
Using a roadmap for antibody-based tracer design, development, and formulation, we translated cetuximab-800CW and trastuzumab-800CW from experimental conjugates to cGMP-compliant investigational medicinal products. Both tracers have demonstrated long-term stability and suitability for human use. Clinical phase 0/1 trials may be conducted using these tracers to detect tumors during image-guided surgery. The proposed roadmap may be applied to other antibody-based tracers as well and can guide researchers in developing a product that is suitable for human use.
DISCLOSURE
Wouter Nagengast and Annelies Jorritsma-Smit are supported by the Dutch Cancer Society (RUG2012-5415 and RUG2014-7290, respectively). Wouter Nagengast and Gooitzen van Dam received an unrestricted research grant from SurgVision B.V. Gooitzen van Dam is a member of the scientific advisory board of SurgVision. No other potential conflict of interest relevant to this article was reported.
Footnotes
Published online Jan. 10, 2019.
- © 2019 by the Society of Nuclear Medicine and Molecular Imaging.
REFERENCES
- Received for publication June 25, 2018.
- Accepted for publication September 6, 2018.


