


Abstract
The integration of myocardial scar models in 3-dimensional (3D) mapping systems may provide a novel way of helping to guide ventricular tachycardia (VT) ablations. This study assessed the value of 201Tl SPECT perfusion imaging to define ventricular myocardial scar areas and to characterize electrophysiology voltage-derived myocardial substrate categories of scar, border zone (BZ), and normal myocardium regions. Scar and BZ regions have been implicated in the genesis of ventricular arrhythmias. Methods: Ten patients scheduled for VT ablation underwent 201Tl SPECT before the ablation procedure. 3D left ventricular (LV) scar models were created from the SPECT images. These scar models were registered with the LV voltage maps and analyzed with a 17-segment cardiac model. Scar location and scar burden were compared between the SPECT scar models and voltage maps. In addition, 201Tl SPECT uptake was quantified using a 68-segment cardiac model and compared among voltage-defined scar, BZ, and normal segments. Results: 3D models of LV myocardium and scar were successfully created from 201Tl SPECT images and integrated in a clinical mapping system. The surface registration error with the electrophysiology voltage map was 4.4 ± 1.0 mm. The 3D scar location from SPECT matched in 72% of the segments with the voltage map findings. All successful ablation sites were located within the SPECT-defined scar or within 1 cm of its border, with 73% of the successful ablation sites within 1 cm of the scar border. Voltage measurements in SPECT-defined scar and normal areas were 1.2 ± 1.7 and 3.4 ± 2.8 mV, respectively (P < 0.001). The fractional SPECT scar burden area (18.8% ± 5.2%) agreed better with the abnormal (scar plus BZ) voltage area (20.8% ± 15.7%) than with the scar voltage area (5.8% ± 5.8%). Mean normalized 201Tl uptake was 55% ± 21% in the voltage-defined scar, 63% ± 20% in BZ, and 79% ± 17% in normal myocardial segments (P < 0.05 for scar or BZ vs. normal). Conclusion: 3D SPECT surface models of LV scar were accurately integrated into a clinical mapping system and predicted endocardial voltage-defined scar. These preliminary data support the possible use of widely available 201Tl SPECT to facilitate substrate-guided VT ablations.
Patients with internal cardiac defibrillators (ICD) may present with frequent shocks for ventricular tachycardia (VT) that are an appropriate response to the arrhythmia. Radiofrequency ablation of VT is required in many of these patients because of the side effects and decreasing long-term efficacy of antiarrhythmic medications. A substrate-guided approach is required in 60%–90% of patients because of the multiple morphologies and hemodynamic intolerance of VT (1,2). In these approaches, linear ablation lines are placed across and along the myocardial scar and its border zone (BZ) to interrupt conducting channels of surviving myocardium (1,3,4). The current gold standard of scar delineation consists of voltage mapping, which is limited by catheter contact, mapping density, and inability to accurately characterize intramyocardial scar (5).
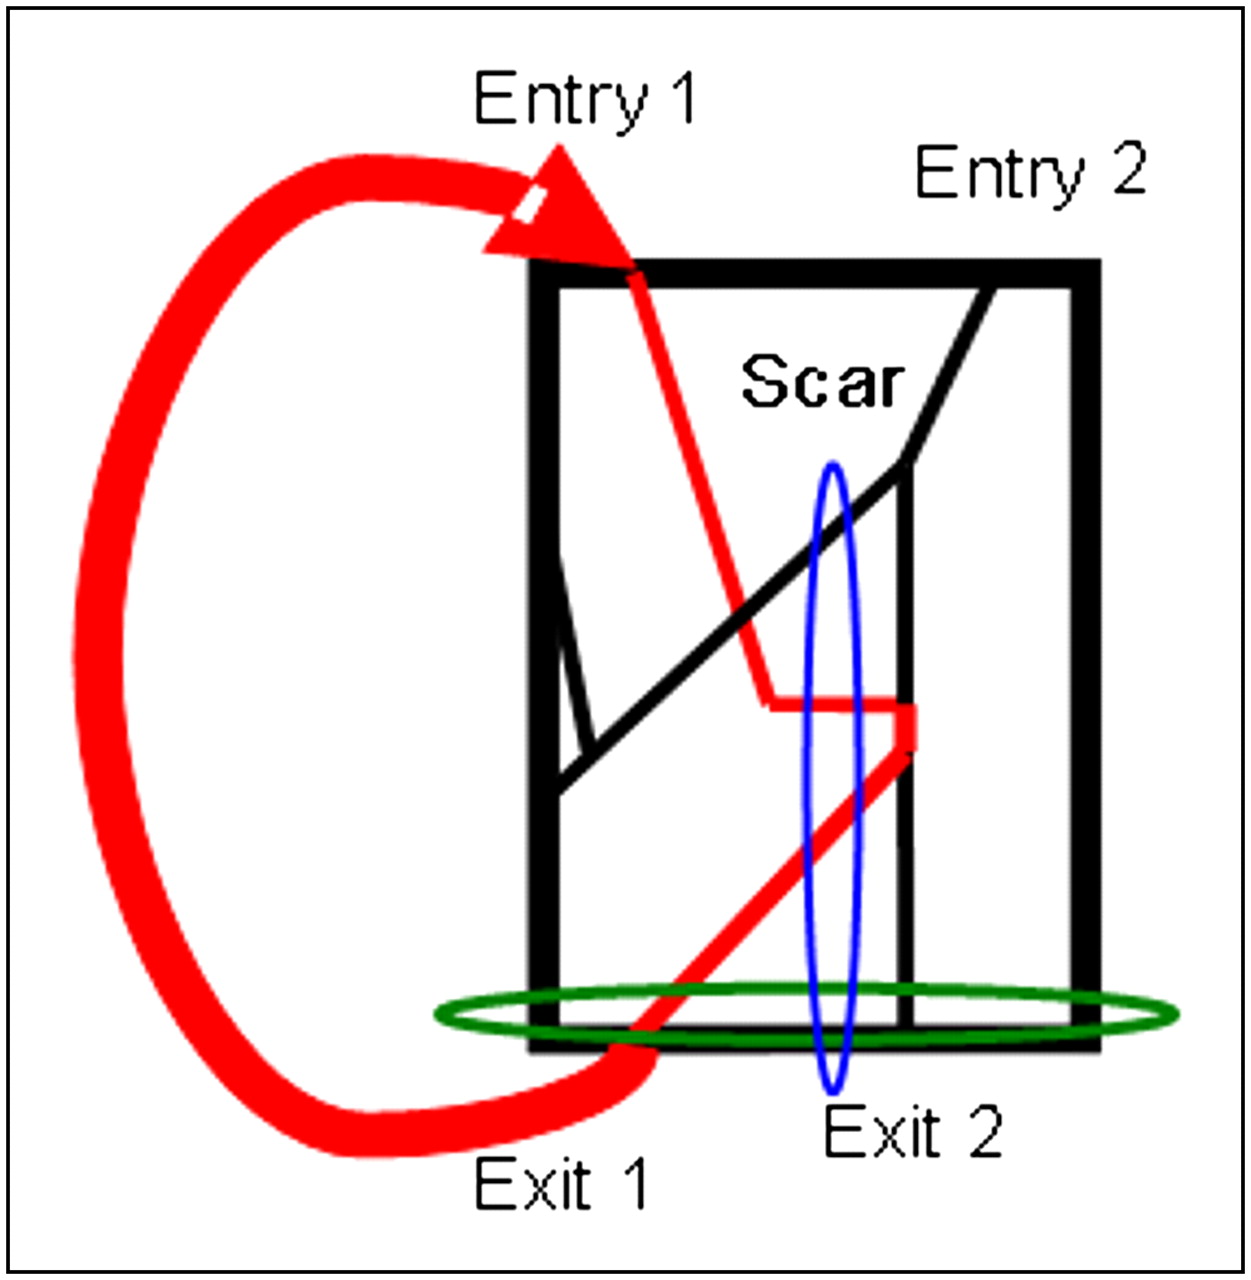
Current understanding of reentrant VT assumes conduction channels within a myocardial scar. An electrical wavefront enters one of the surviving bundles of myocardium, conducts along those channels, and exits at a remote site (Fig. 1). Patients frequently have many surviving channels, resulting in multiple reentrant circuits and VTs. After a VT is induced, the 12-lead morphology is noted on the electrocardiogram. Pacing along the BZ is used to match the QRS morphology of the VT in all 12 leads (pace mapping) to identify the VT exit site. A common treatment is to create lesions tangent to the scar border to eliminate identified and potential unidentified exit sites. Alternatively, ablation lines from the exit site to the scar center or deeper inside the scar can interrupt conducting channels.

Schematic diagram of reentrant VT with multiple entry and exit sites. Myocardial scar is represented by black rectangle. with slow conduction pathways indicated by red and black lines within scar. VT wavefront within and surrounding scar is indicated in red. Ablation of both exit site 1 and exit site 2 (green ellipse) is needed to terminate VT. Ablation line from scar center to inferior scar border (blue ellipsoid) will interrupt some conducting pathways.
In previous work, we investigated the integration of scar models from 18F-FDG PET into a clinical electrophysiology mapping system and found good correlations between the PET scar models and the electrophysiology voltage maps (6,7). Though PET offers advantages over SPECT in terms of superior resolution and reduced image noise, SPECT is a well-established and validated technique for identifying myocardial scar and is more widely available (8,9).
The present study evaluated the clinical feasibility of creating 3-dimensional (3D) scar models from 201Tl SPECT images to help guide VT ablations and integrating them into an electrophysiology mapping system using an image integration module (CartoMerge Image Platform Expansion; Biosense Webster). The program features used in our study are in the commercially distributed version of CartoMerge. This work may enable a widespread clinical use of 3D SPECT scar models, especially in centers that do not have access to PET. In addition, normalized 201Tl activities were compared with electrophysiology-derived tissue classifications in a finely segmented model of the heart, and a receiver-operating-characteristic (ROC) study evaluated the capability of SPECT to differentiate between electrophysiology-derived abnormal- (scar or BZ) and normal-tissue categories.
The eventual goal is to provide the electrophysiologist a preprocedural model of the scar and BZ so that time-intensive voltage mapping can be performed more quickly and concentrated in cardiac regions responsible for arrhythmogenesis. In addition, the SPECT-derived scar model may be useful to identify anomalous voltages due to suboptimal mapping catheter contact.
MATERIALS AND METHODS
Data from 10 ICD patients who underwent 201Tl scanning before VT ablation between 2006 and 2010 were used in this retrospective study. All study protocols were reviewed and approved by the University of Maryland Institutional Review Board.
SPECT Datasets
All patients had left ventricular (LV) dysfunction and cardiomyopathy requiring ICD placement. Depending on the underlying cause of the cardiomyopathy, ischemic versus nonischemic, rest 201Tl SPECT studies were acquired as part of standard clinical protocols: single-day rest–redistribution (3 studies), rest–stress (1 study), or stress–redistribution–reinjection rest (6 studies). The 4 rest-first studies were acquired after intravenous injection of 111–203.5 MBq (3.0–5.5 mCi) of 201Tl, whereas the stress–reinjection rest studies had 111–162.8 MBq (3.0–4.4 mCi) of 201Tl administered for the stress study, followed later by 37–44.2 MBq (1.0–1.2 mCi) of 201Tl administered for the rest study. The time interval between rest or reinjection 201Tl and subsequent image acquisition was approximately 30 min.
The studies were acquired on 2 different SPECT systems, an SMV Summit DST system (3 studies) and a Philips Skylight SPECT scanner (7 studies). Both scanners had dual-detector heads and were equipped with low-energy high-resolution collimators. Projection data were acquired over 180° with 32 projections and 30, 40, or 50 s/angle. The acquisition matrix size was 64 × 64, and projection pixels were 6.4 or 6.8 mm on a side. Average energy windows were 26% centered on 73 keV and 20% centered on 166 keV. Image reconstruction was by filtered backprojection or by iterative image reconstruction. The voxel size was the same as the projection pixel size. Attenuation correction was not performed.
Voltage Map and VT Ablation
All voltage maps were created using the CartoMerge 3D mapping system and a 3.5-mm Navistar cooled-tip catheter (filling threshold of 15 mm). Bipolar electrograms were filtered at 30–500 Hz. Standard clinical voltage criteria were used to define 3 tissue classifications: scar (<0.5 mV), BZ (0.5–1.5 mV), and normal (>1.5 mV) myocardium. Abnormal tissue was defined as either scar or BZ—that is, voltage less than 1.5 mV.
Voltage mapping and pacemapping with limited activation or entrainment mapping were used to identify the scar substrate and ablation sites. Substrate modification was performed as clinically indicated using linear lesion sets along the scar border and connecting to the scar center as defined by the voltage maps.
Comparison of SPECT Activities with Voltage Maps
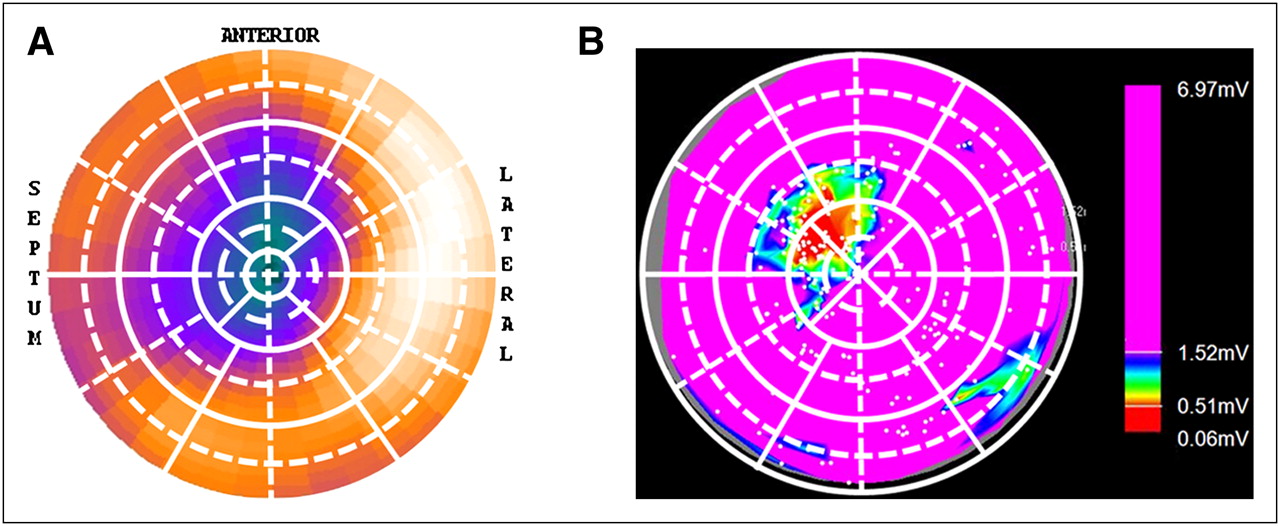
Regional myocardium perfusion and sarcolemmal integrity, as reflected by the Na-K adenosine triphosphatase transport system, were assessed using rest 201Tl SPECT images. These images were analyzed using the PCARD module of PMOD (PMOD Technologies Ltd.). This program traced rays outward from the LV axis at 36 equally spaced angles in each of 20 planes between apex and base, and the maximum voxel value along each ray was obtained. These 720 raw data values were used to create a polar map of local tracer uptake. A 68-segment LV model was created by subdividing the standard 17 cardiac segments (10) into 4 subregions (Fig. 2) and averaging the appropriate polar map values. Smaller segments will increase the number of homogeneous segments, aiding the comparison of the SPECT and electrophysiology values.

A 68-segment analysis and polar plots for representative patient. (A) Polar plot of SPECT image indicating apical and anteroseptal scar area (dark green-purple). White grid on polar plot shows 17 segments (solid lines) and division into 4 subregions (dashed lines). (B) Regional view of corresponding voltage map indicating anteroseptal scar area (red) surrounded by normal myocardium (pink). White grid on regional view shows corresponding segments (solid lines) and their subdivisions (dashed lines). Subendocardial apical region is sampled by SPECT but not by electrophysiology.
Mean uptakes for the 17-segment model was also computed. The SPECT segment with peak uptake was considered normal, and its uptake was used as 100% to normalize both the 17- and 68-segment 201Tl SPECT datasets.
The same 68-segment model was used for the voltage data. Average normalized 201Tl uptake was computed in voltage segments that were homogeneous scar (all voltages < 0.5 mV), homogeneous BZ (all voltages > 0.5 and < 1.5 mV), and homogeneous normal (all voltages > 1.5 mV). Homogeneous segments were used to investigate the properties of the 3 electrophysiology-derived tissue classifications while avoiding segments with a mixture of properties.
An ROC curve was used to assess the ability of normalized 201Tl uptake to predict myocardial abnormality using the 68-segment data. Voltage values were used as the gold standard to define abnormal (scar or BZ < 1.5 mV) and normal (>1.5 mV) myocardial segments. 201Tl uptake was treated as a continuous variable, and the 201Tl classification threshold for normal or abnormal was varied from 0% upward to generate the ROC curve.
3D SPECT Scar and Surface Model Generation
3D SPECT scar and surface models in the form of surface mesh files were created from the SPECT images. Short-axis cardiac images in Digital Imaging and Communications in Medicine format were read into Amira 5.2.1 (Visage Imaging, Inc.). Then an experienced cardiologist masked to the voltage data manually drew contours to define epicardial or endocardial LV surfaces, endocardial right ventricular surfaces, and perfusion defects. Threshold or gradient criteria were not used. Surface mesh files were created from the contours by Amira. MATLAB R2009a (The MathWorks Inc.) converted the mesh files into a format readable by CartoMerge.
Comparison of 3D SPECT Scar and Surface Models with Voltage Maps
The 3D cardiac LV surface model from SPECT was uploaded and superimposed with the LV electroanatomic map using CartoMerge Image Platform Expansion. Registration was performed with automatic surface registration and visual alignment using the 12-o’clock position of the mitral valve. The registration error for a particular voltage point was the 3D Euclidean distance between that point and the closest apex of the surface mesh to which the electrophysiology map was being registered. Registration accuracy was compared using the average registration error over all voltage points.
3D SPECT scar surface models and voltage maps were compared using a 17-segment cardiac model (6). Segments were visually classified by an experienced cardiologist. For electrophysiology voltage maps, segments containing only voltages less than 0.5 mV were defined as scar. Segments with some voltages less than 0.5 mV and some voltages 0.5–1.5 mV and no voltages greater than 1.5 mV were defined as partial scar. Segments with all voltages greater than 1.5 mV were defined as normal. Segments with some voltages greater than 1.5 mV and some less than 1.5 mV were excluded because of intrasegmental heterogeneity. For SPECT scar models, segments completely within the scar were classified as scar, and segments containing scar and nonscar regions were classified as partial scar. All other SPECT segments were classified as normal.
Matching percentages of scar and partial-scar segments between SPECT and electrophysiology were calculated. The scar surface area and LV scar burden (scar surface area/total LV surface area) were compared between the voltage map and 3D SPECT scar surface models using the CartoMerge surface measurement tool. Mean electrophysiology voltages in SPECT-defined scar and normal segments were computed.
Statistics
SPSS (IBM) for Windows 16.0 and Excel 2007 (Microsoft) were used for statistical analyses and to generate the ROC curves. Means and SDs of continuous variables are expressed as mean ± SD unless otherwise noted. Comparisons were conducted with a 2-tailed t test. Differences were considered significant at a level of P less than 0.05.
RESULTS
Patient Characteristics
All patients were men, with an average age of 67 ± 10 y (Table 1). Eight of the 10 patients had ischemic cardiomyopathy. Previous myocardial infarctions were located at the inferior (n = 4), inferoseptal (n = 2), anteroseptal (n = 1), and apical (n = 1) walls. Two patients had nonischemic cardiomyopathy. The average time between 201Tl SPECT and the ablation procedure was 25 ± 42 d.
Patient Characteristics (n = 10) at Time of VT Ablation
Electrophysiologic Voltage Mapping
Endocardial voltage maps were created in all 10 patients, with 163 ± 66 mapping points. All patients with ischemic cardiomyopathy had abnormal or scar segments. The nonischemic cardiomyopathy patients had no voltage abnormal or scar segments.
VT Ablation
An average of 2.5 ± 1.4 VTs per patient was inducible during programmed electrical stimulation. On the basis of the 12-lead morphology of the clinical VT or rate or morphology of the ICD recordings, 16 of 25 VTs were deemed to represent clinical or presumed clinical VT and were targeted for ablation. Of those clinical VTs, 69% had a right bundle branch block morphology with right inferior (n = 1), right superior (n = 3), or left superior (n = 7) origin. The remaining 31% had a left bundle branch block morphology with right inferior (n = 1), left inferior (n = 1), or left superior (n = 3) origin. Cycle lengths of the clinical VTs were 418 ± 79 ms. Radiofrequency ablation eliminated 15 of 16 (94%) clinical or presumptive clinical VTs.
Activation and entrainment mapping were used in 3 patients, pacemapping and limited activation mapping were used for 6 patients because of hemodynamic disability, and VT was not inducible in 1 patient. No procedure-related complications occurred in any of the 10 procedures.
Comparison of SPECT Activities with Voltage Map
Thirty segments were classified as scar, 28 as BZ, and 250 as normal using the 68-segment model and the previously described voltage criteria. One hundred twenty-one segments were heterogeneous, and 251 had no electrophysiology voltage points. Mean normalized 201Tl uptake was 55% ± 21% in scar segments, 63% ± 20% in BZ segments, and 79% ± 17% in normal segments. Some normalized 68-segment 201Tl uptake values were greater than 100% because the peak 17-segment value was used as a robust normalization value for normal tissue. There were statistically significant differences in mean 201Tl uptake between scar and normal (P < 0.05) and between BZ and normal (P < 0.05) segments. There was no significant uptake difference between scar and BZ segments (P = 0.14).
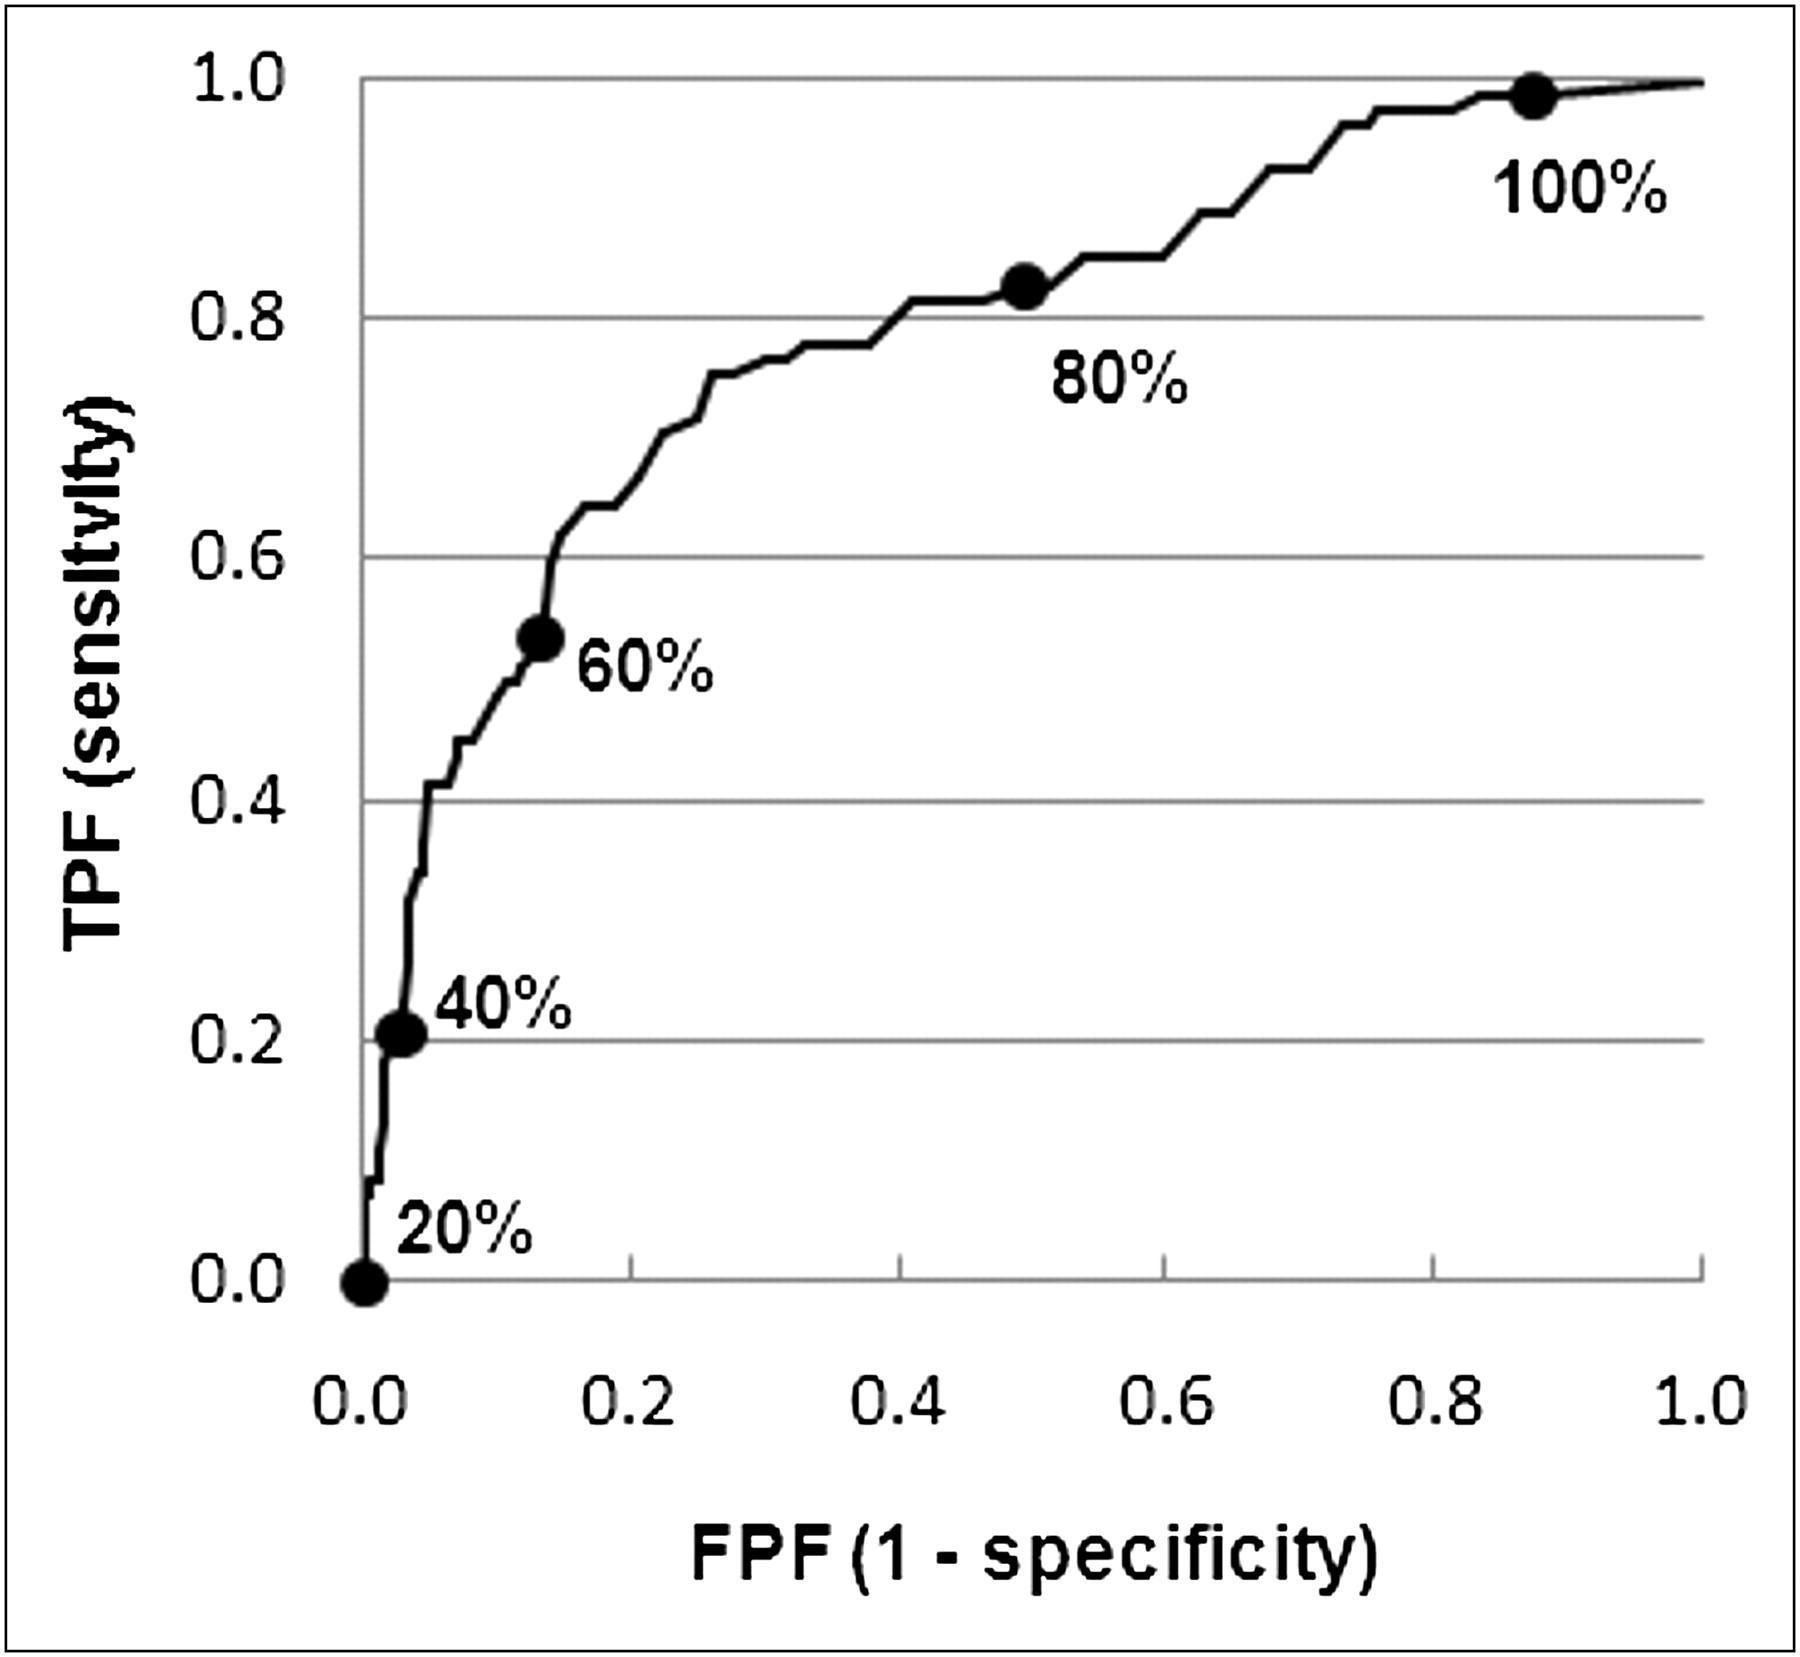
For the ROC analysis, there were 82 homogeneous abnormal segments (all voltages < 1.5 mV) and 250 homogeneous normal segments (all voltages > 1.5 mV). The ROC curve is in Figure 3, and the area under the curve was 0.79 ± 0.03. The choice of an operating 201Tl uptake threshold is task-dependent. A threshold of 70% maximized the sum of sensitivity plus specificity, with a sensitivity of 76% and a specificity of 74%; at this threshold, the accuracy was 74%. The maximum accuracy was 82% at a threshold of 48%, where sensitivity was 41% and specificity was 95%.

ROC curve for 201Tl uptake to predict abnormal voltage segments (<1.5 mV). Large dots indicate points on curve for different normalized 201Tl cutoff values. FPF = false-positive fraction; TPF = true-positive fraction.
3D SPECT Scar and Surface Models and Registration with Voltage Maps
Surface models of LV anatomy and scar were generated in all cases. The 3D SPECT LV endocardium or epicardium surface mesh models were accurately displayed and registered in the clinical mapping system (Figs. 4 and 5). Registration errors were evaluated in 9 of the 10 patients but not in 1 patient in whom a scar prevented an accurate SPECT LV surface model near the apex. The position error with visual alignment was 6.5 ± 2.4 mm (Table 2). The addition of surface shell registration improved the registration accuracy to 4.4 ± 1.0 mm (P < 0.05). From visual analysis, less than about 10% of the individual point-to-shell distances were 10 mm or greater, mostly at the mitral valve plane, which has low uptake and is incompletely represented in the SPECT images and derived surface models.

For representative patient, SPECT images in short-axis (A) and horizontal-long-axis (B) views indicating inferior defect. Corresponding 3D SPECT surface models of left ventricle (blue) in short-axis (C) and horizontal-long-axis (D) orientations indicate inferior scar (red/brown).

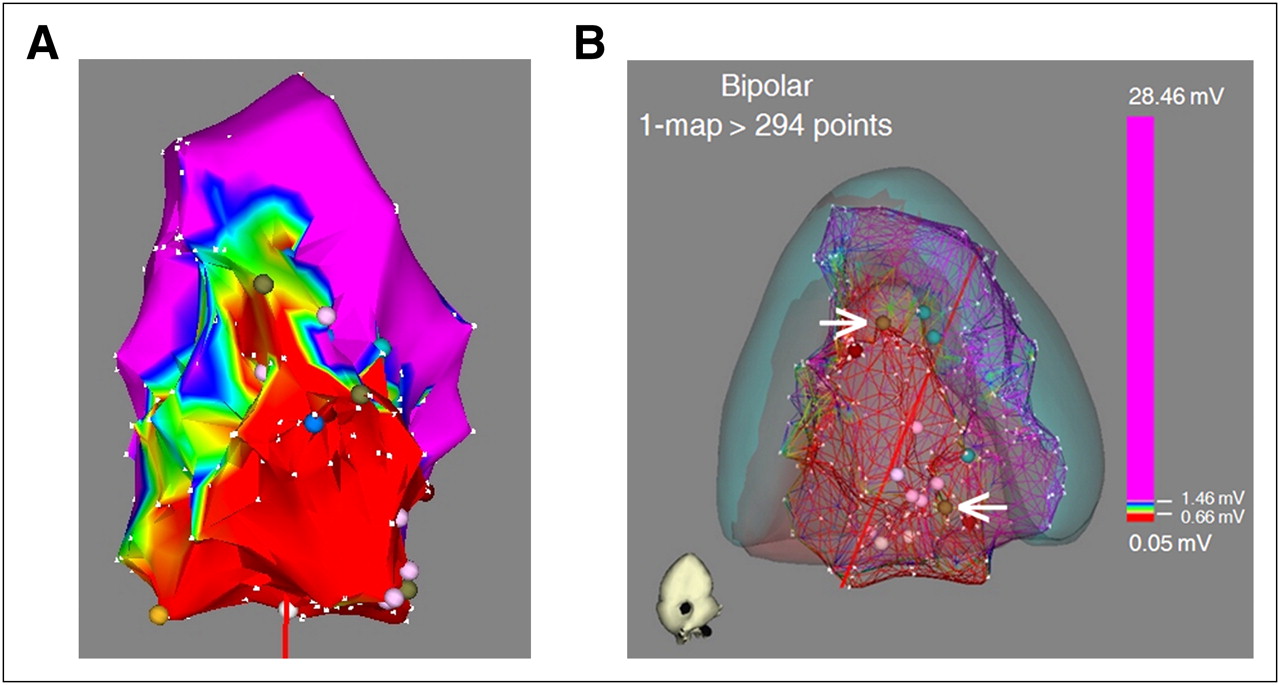
Integration of corresponding voltage map with 3D SPECT surface models from Figure 4. (A) Voltage map indicating inferior scar (red area) defined as bipolar voltage less than 0.5 mV. (B) 3D SPECT LV (blue) and scar (red/brown) surface models integrated with voltage map showing matched scar location and size between 2 modalities. Successful ablation sites (brown markers; white arrows) were located along scar border.
Average Position Error Between SPECT LV Model and Electrophysiology Voltage Map for Different Registration Algorithms, Visual Alignment, or Visual Alignment Followed by Surface Registration
Comparison of 3D SPECT Scar Model with Voltage Map
Scar and partial-scar segments from SPECT and electrophysiology were visually classified in 9 of 10 patients; because 1 patient had an incomplete voltage map, all segments could not be assessed (Table 3). The scar or partial-scar segment classification for the SPECT-defined scar model matched in 28 of 39 segments (72%) with scar or partial scar from electrophysiology voltage mapping. For the 9 patients with complete voltage maps, the myocardial scar area (<0.5 mV) averaged 15.6 ± 17.1 cm2, with an LV scar burden of 5.8% ± 5.8%. The abnormal myocardium area (voltage < 1.5 mV) averaged 53.0 ± 45.7 cm2, with an LV burden of 20.8% ± 15.7%. The 3D SPECT scar model had an area of 43.7 ± 11.4 cm2, with an LV scar burden of 18.8% ± 5.2%. The SPECT-defined scar area and LV burden were between the electrophysiology-derived scar and abnormal voltage values and agreed better with the abnormal voltage area values.
Scar Location According to 17-Segment Model of American Heart Association (10)
For these same 9 patients and the 17-segment model, there were 1,428 total voltage points, an average of 9.9 ± 10.1 voltage points per segment and 138 segments with one or more voltage points. Twenty SPECT segments were visually classified as scar and 100 as normal. There were 320 voltage measurements within the SPECT visually classified scar segments, with an average voltage of 1.2 ± 1.7 mV. In the normal SPECT segments, there were 890 voltage points, with an average voltage of 3.4 ± 2.8 mV. The voltage difference was significant (P < 0.001).
Of the 10 patients, ablations were performed in 9 (VT was not inducible in 1 patient), with 1 of the ablations performed in the right ventricle. For the 8 patients with LV ablations, there were 11 successful ablation sites, all within the SPECT scar surface model or outside the scar and within 1 cm of its border. Eight of the 11 sites (73%) were within 1 cm of the SPECT scar border, either inside or outside the scar.
DISCUSSION
The novel findings of this study are, first, that 201TI SPECT signal intensities can successfully differentiate between voltage-defined abnormal (scar or BZ) and normal myocardium; second, that 3D scar surface models can be successfully generated from 201Tl SPECT images and accurately registered with the electrophysiology voltage maps; third, that 3D scar models from 201TI SPECT well match the location and extent of abnormal LV myocardium from the current gold standard of voltage mapping; and fourth, that most ablation sites are within 1 cm of the border of the 3D SPECT scar model.
Cardiac Imaging of Myocardial Scar
Cardiac imaging has the potential to significantly facilitate VT ablations in patients with structurally abnormal hearts. Up to 90% of these ablations have to be performed with substrate guidance because of hemodynamic instability or the multitude of inducible ventricular arrhythmias (1). SPECT delineation of myocardial scar has the ability to assist in mapping of electrophysiology, identifying falsely low electrophysiology voltages due to suboptimal catheter contact, and planning the ablation approach (5).
Anatomic Scar Imaging
Although MRI is the current gold standard for scar imaging, ICDs in most VT patients are a contraindication for MRI (11). ICD artifacts and the risk of nephrogenic systemic fibrosis present further challenges (5,12). Alternatively, CT has the potential for comprehensive scar evaluation (13), but inconsistent delayed enhancement in chronic infarcts, associated contrast nephropathy, and metal artifacts limit its current application.
Rationale for Using SPECT 3D Scar Models
Nuclear medicine has been used for decades for myocardial scar delineation. PET is an established technique to distinguish viable from nonviable myocardium, assess ischemia, and guide revascularization (14). Similarly, SPECT has been used to accurately assess myocardial perfusion and delineate myocardial ischemic or scar tissue (8,9). Importantly, SPECT and PET are not affected by limitations applicable to MRI or CT described previously.
Recently, we showed that PET-derived myocardial scars can be successfully registered to display scars for VT ablations (6,7). Although PET has spatial resolution superior to SPECT (15,16), the availability of PET is limited because of higher costs. SPECT cameras, however, are nearly ubiquitous in clinical cardiology settings. SPECT is well validated for its diagnostic accuracy in detecting myocardial scar (8) and has high agreement (83%) with contrast-enhanced MRI as a reference standard for viability assessment of transmural scars (8). However, segments with a subendocardial scar on contrast-enhanced MRI may have normal perfusion and metabolic uptake, perfusion and metabolic defect mismatch, mild perfusion and metabolic defect match, or severe perfusion and metabolic defect match (8).
Correlations of Myocardial Scar Area or Burden with Electrophysiology Voltages
In this study, SPECT could robustly detect electrophysiology voltage-defined myocardial scars. Regional 201Tl SPECT uptake differed significantly between abnormal (scar or BZ) and normal voltage segments. However, there was not a significant uptake difference between scar and BZ segments, possibly due in part to the limited spatial resolution of SPECT and to registration errors between SPECT and electrophysiology voltage maps.
3D LV and scar models were successfully created from SPECT images and integrated into a clinical mapping system, which can provide a perspective display of LV myocardium and scar, thus assisting the electrophysiologist with procedure planning (e.g., choosing transseptal vs. retrograde LV access) and enabling focused mapping in the myocardial scar area. Additionally, a clinical mapping system may allow detection of falsely low voltage recordings due to imperfect catheter contact, which might be as high as 4% (5) in normal SPECT uptake locations.
The SPECT-defined scar area and LV scar burden was larger than the voltage-defined scar (<0.5 mV) area or burden but smaller than the abnormal voltage (<1.5 mV) area or burden. Technical limitations could be partially responsible for these results and are detailed in the “Limitations” section. Alternatively, decreased voltage in the BZ (0.5–1.5 mV) is commonly assumed to be due to myocardial fibrosis interspersed with normal myocardium. Endocardial voltage mapping will have a threshold for fibrosis detection different from that of imaging techniques. For example, a layer of preserved endocardial myocardium may result in preserved local bipolar voltage, whereas the pathology of the residual LV wall could result in decreased 201TI uptake. Similarly, the amount of diffuse transmural fibrosis needed to reduce the voltage or 201TI uptake might be different. Our results are consistent with findings of contrast-enhanced CT to define the LV scar substrate. The area of first-pass hypoperfusion CT or late gadolinium-enhancement MRI approximated the area of less than 1.5 mV better than the area of less than 0.5 mV in patients with ischemic cardiomyopathy (13,17).
All successful ablation sites were located within the SPECT-defined scar or within 1 cm of its border, with 73% of the successful ablation sites within 1 cm of the scar border. This potentially allows an image-guided approach to VT ablation. Correlating the possible exit location derived from the 12-lead morphology of the clinical or induced VT with the border of the SPECT scar model that has been integrated in the clinical mapping system may allow identification of an acceptable pace-map site without the performance of a full LV voltage map. Indeed, a similar approach using MRI scar models allowed the early identification of at least 11 of 12 pace-map sites in 64% of patients (17).
Use of 201Tl Versus 99mTc Tracers
For ICD patients with LV dysfunction being evaluated for the presence and extent of myocardial scar and viability with a view toward VT ablation, 201Tl is generally considered superior to 99mTc-labeled perfusion tracers. The retention of these blood flow tracers in the myocardial cell requires intact cell membranes and viable cells. Although the advantage of thallium over 99mTc-labeled perfusion tracers is its higher extraction fraction of 85%, compared with 60% for 99mTc-sestamibi and 54% for 99mTc-tetrofosmin, this advantage comes at the expense of a relatively higher radiation dose. However, if the diagnostic accuracy of the presence and extent of scarred and viable myocardium differs between the radiotracers because of differences in extraction fraction and cell membrane properties, then the benefits from proper VT ablation mapping far exceed the theoretic long-term risk of increased radiation dose from 201Tl versus 99mTc agents. In future studies it would be of interest to determine the concordance between scar and BZ areas detected with 99mTc-labeled perfusion tracers and voltage mapping.
Clinical Relevance of 201Tl SPECT Before VT Ablation
Currently, a scar and its BZ are painstakingly defined by acquiring voltage measurements throughout the LV endocardium. Though it has spatial resolution limitations and will not replace electrophysiologic mapping, scar imaging with 201Tl can indicate the approximate location of the scar and BZ. This ability will allow the electrophysiologist to concentrate mapping in these key areas. 201Tl images will provide a general guide to additional pace-mapping locations along the scar border to attempt to match the 12-lead morphology of the paced QRS complex with that of the clinical VT and with placement of ablation lesions. 201Tl imaging can detect voltage measurements that are falsely low due to imperfect catheter contact and that would otherwise be labeled as scar and possibly result in inappropriate ablation lesions.
Limitations
Rotational errors due to the symmetric LV shape are a potential explanation of regional mismatch of SPECT and electrophysiology voltages; however, alignments with the right ventricular voltage map were used to minimize inaccuracies. The current spatial resolution of SPECT (∼12 mm) could lead to blurring of scar edges or nondetection of small scar regions, underestimating myocardial scars. However, the overall correlation of scar presence and location was acceptable and provided clinically useful information regarding procedural planning and focused mapping strategies.
201Tl SPECT image quality and quantitative accuracy could be improved by attenuation correction, scatter correction, and iterative image reconstruction with resolution recovery for depth-dependent collimator response. Several new SPECT cameras also have greater cardiac sensitivity, which could be used to reduce scan time, reduce patient dose, or acquire more counts in the same imaging time to reduce image noise. Improved resolution would enable better scar region identification, and lower noise would improve identification of the scar border.
The endocardial surface from the voltage map is not smooth because all mapping point locations are on the surface. The resulting tentlike deformities could result in overestimation of the voltage map surface area (18).
Most patients in this study had ischemic cardiomyopathy. Nonischemic scar often involves mid- or epicardial wall segments and might not be accurately detected by endocardial mapping alone.
The SPECT scar and LV models were based on contours drawn by an experienced cardiologist. Further work is required to establish the intra- and interobserver reliability of this manual method. It would be desirable to automate this process to reduce variability and minimize user intervention, for example, using some threshold or gradient-based approach.
This work is a retrospective study of a small group of 10 patients, and a prospective study in a larger number of patients is needed to assess the robustness of the proposed methods.
CONCLUSION
Integration of 3D SPECT scar models can accurately predict areas of LV myocardial fibrosis, which encompass the successful VT ablation sites, possibly enabling more accurate and targeted voltage mapping and accelerated identification of potential ablation sites. The wide availability of SPECT could facilitate the clinical application of this novel approach.
DISCLOSURE STATEMENT
The costs of publication of this article were defrayed in part by the payment of page charges. Therefore, and solely to indicate this fact, this article is hereby marked “advertisement” in accordance with 18 USC section 1734.
Acknowledgments
This work was supported in part by a Scientist Development grant (0635304N) from the American Heart Association. No other potential conflict of interest relevant to this article was reported.
Footnotes
Published online May 10, 2012.
- © 2012 by the Society of Nuclear Medicine, Inc.
REFERENCES
- Received for publication June 24, 2011.
- Accepted for publication January 20, 2012.


Jump to section
Related Articles
Cited By...
- Electroanatomical Mapping at a Crossroads
- Challenging Nuclear Cardiology Research: Stimulating Discovery, Validation, and Clinical Relevance
- Cardiac Imaging in Patients With Ventricular Tachycardia
- Display of 3D Multimodality Cardiac Images With 2D Polar Maps: Simplicity Can Be a Virtue
- 123I-Meta-Iodobenzylguanidine Guanidine-Guided Ventricular Tachycardia Ablation: Will Expanding the Target Improve the Aim?
- Global and Regional Myocardial Innervation Before and After Ablation of Drug-Refractory Ventricular Tachycardia Assessed with 123I-MIBG