


Article Figures & Data
Figures
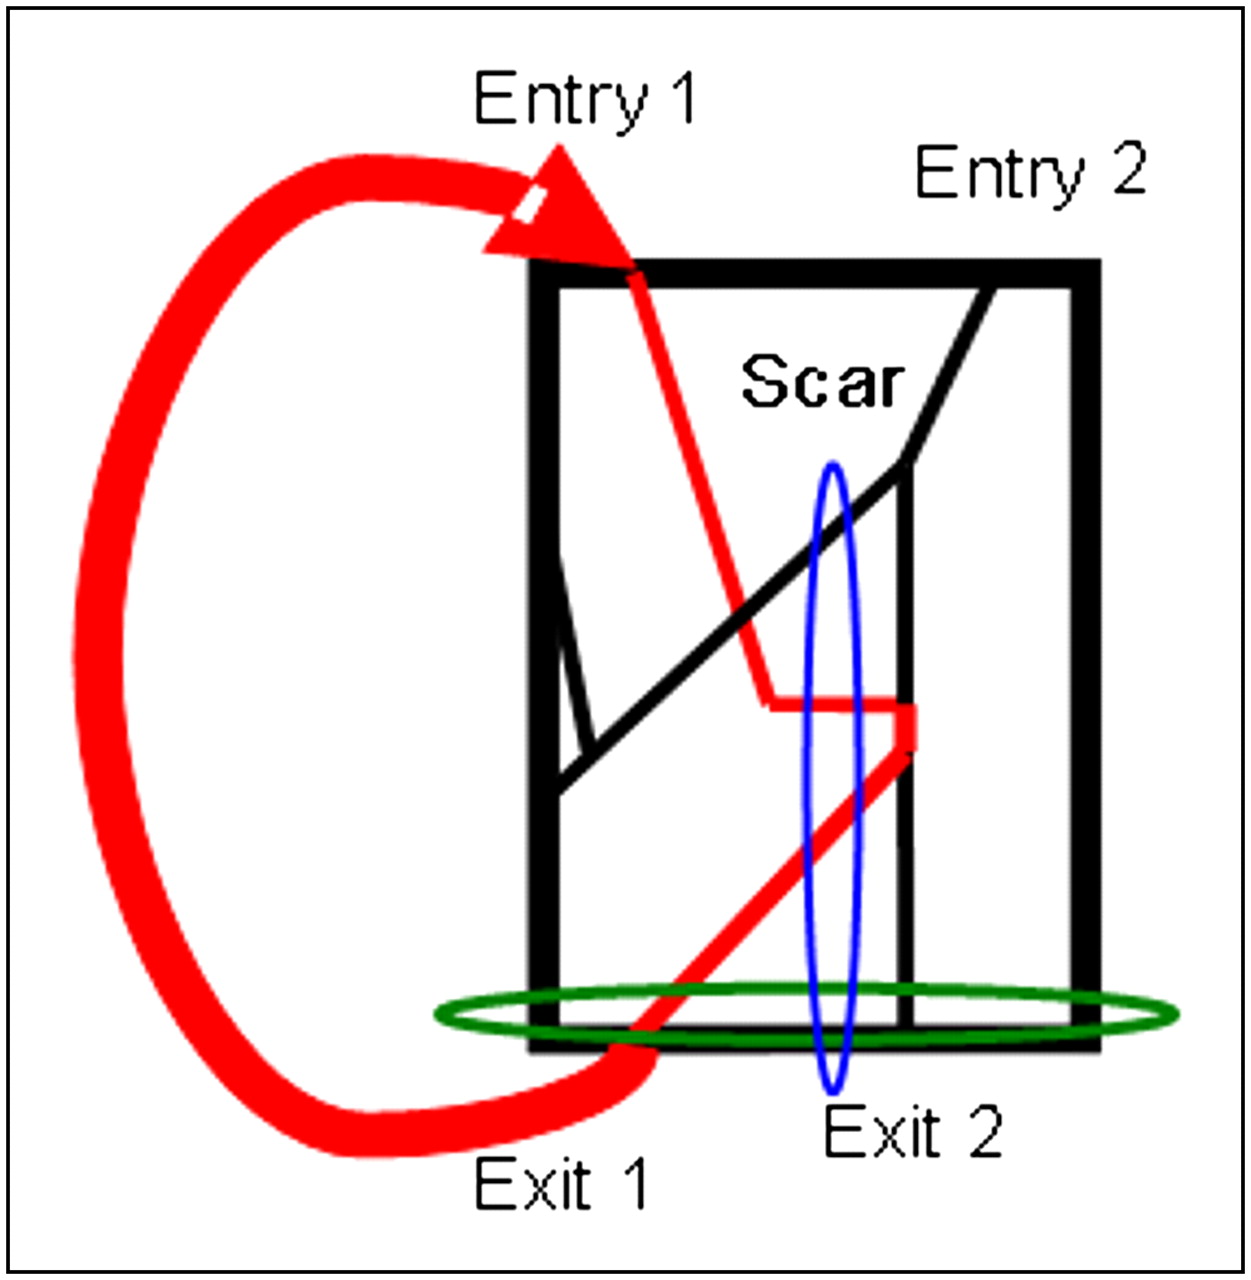
- FIGURE 1.
Schematic diagram of reentrant VT with multiple entry and exit sites. Myocardial scar is represented by black rectangle. with slow conduction pathways indicated by red and black lines within scar. VT wavefront within and surrounding scar is indicated in red. Ablation of both exit site 1 and exit site 2 (green ellipse) is needed to terminate VT. Ablation line from scar center to inferior scar border (blue ellipsoid) will interrupt some conducting pathways.
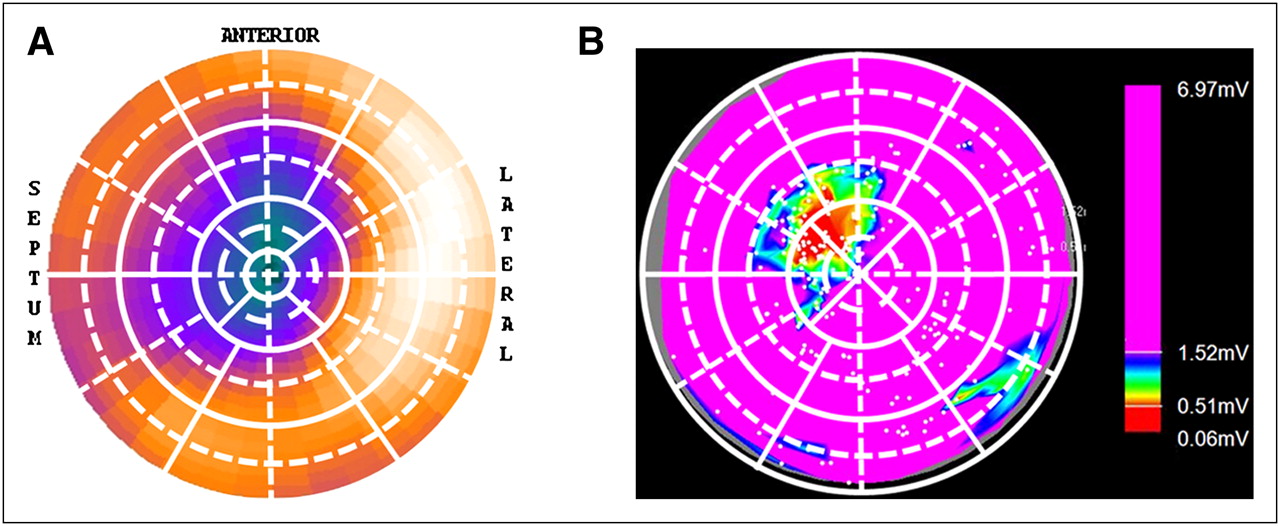
- FIGURE 2.
A 68-segment analysis and polar plots for representative patient. (A) Polar plot of SPECT image indicating apical and anteroseptal scar area (dark green-purple). White grid on polar plot shows 17 segments (solid lines) and division into 4 subregions (dashed lines). (B) Regional view of corresponding voltage map indicating anteroseptal scar area (red) surrounded by normal myocardium (pink). White grid on regional view shows corresponding segments (solid lines) and their subdivisions (dashed lines). Subendocardial apical region is sampled by SPECT but not by electrophysiology.
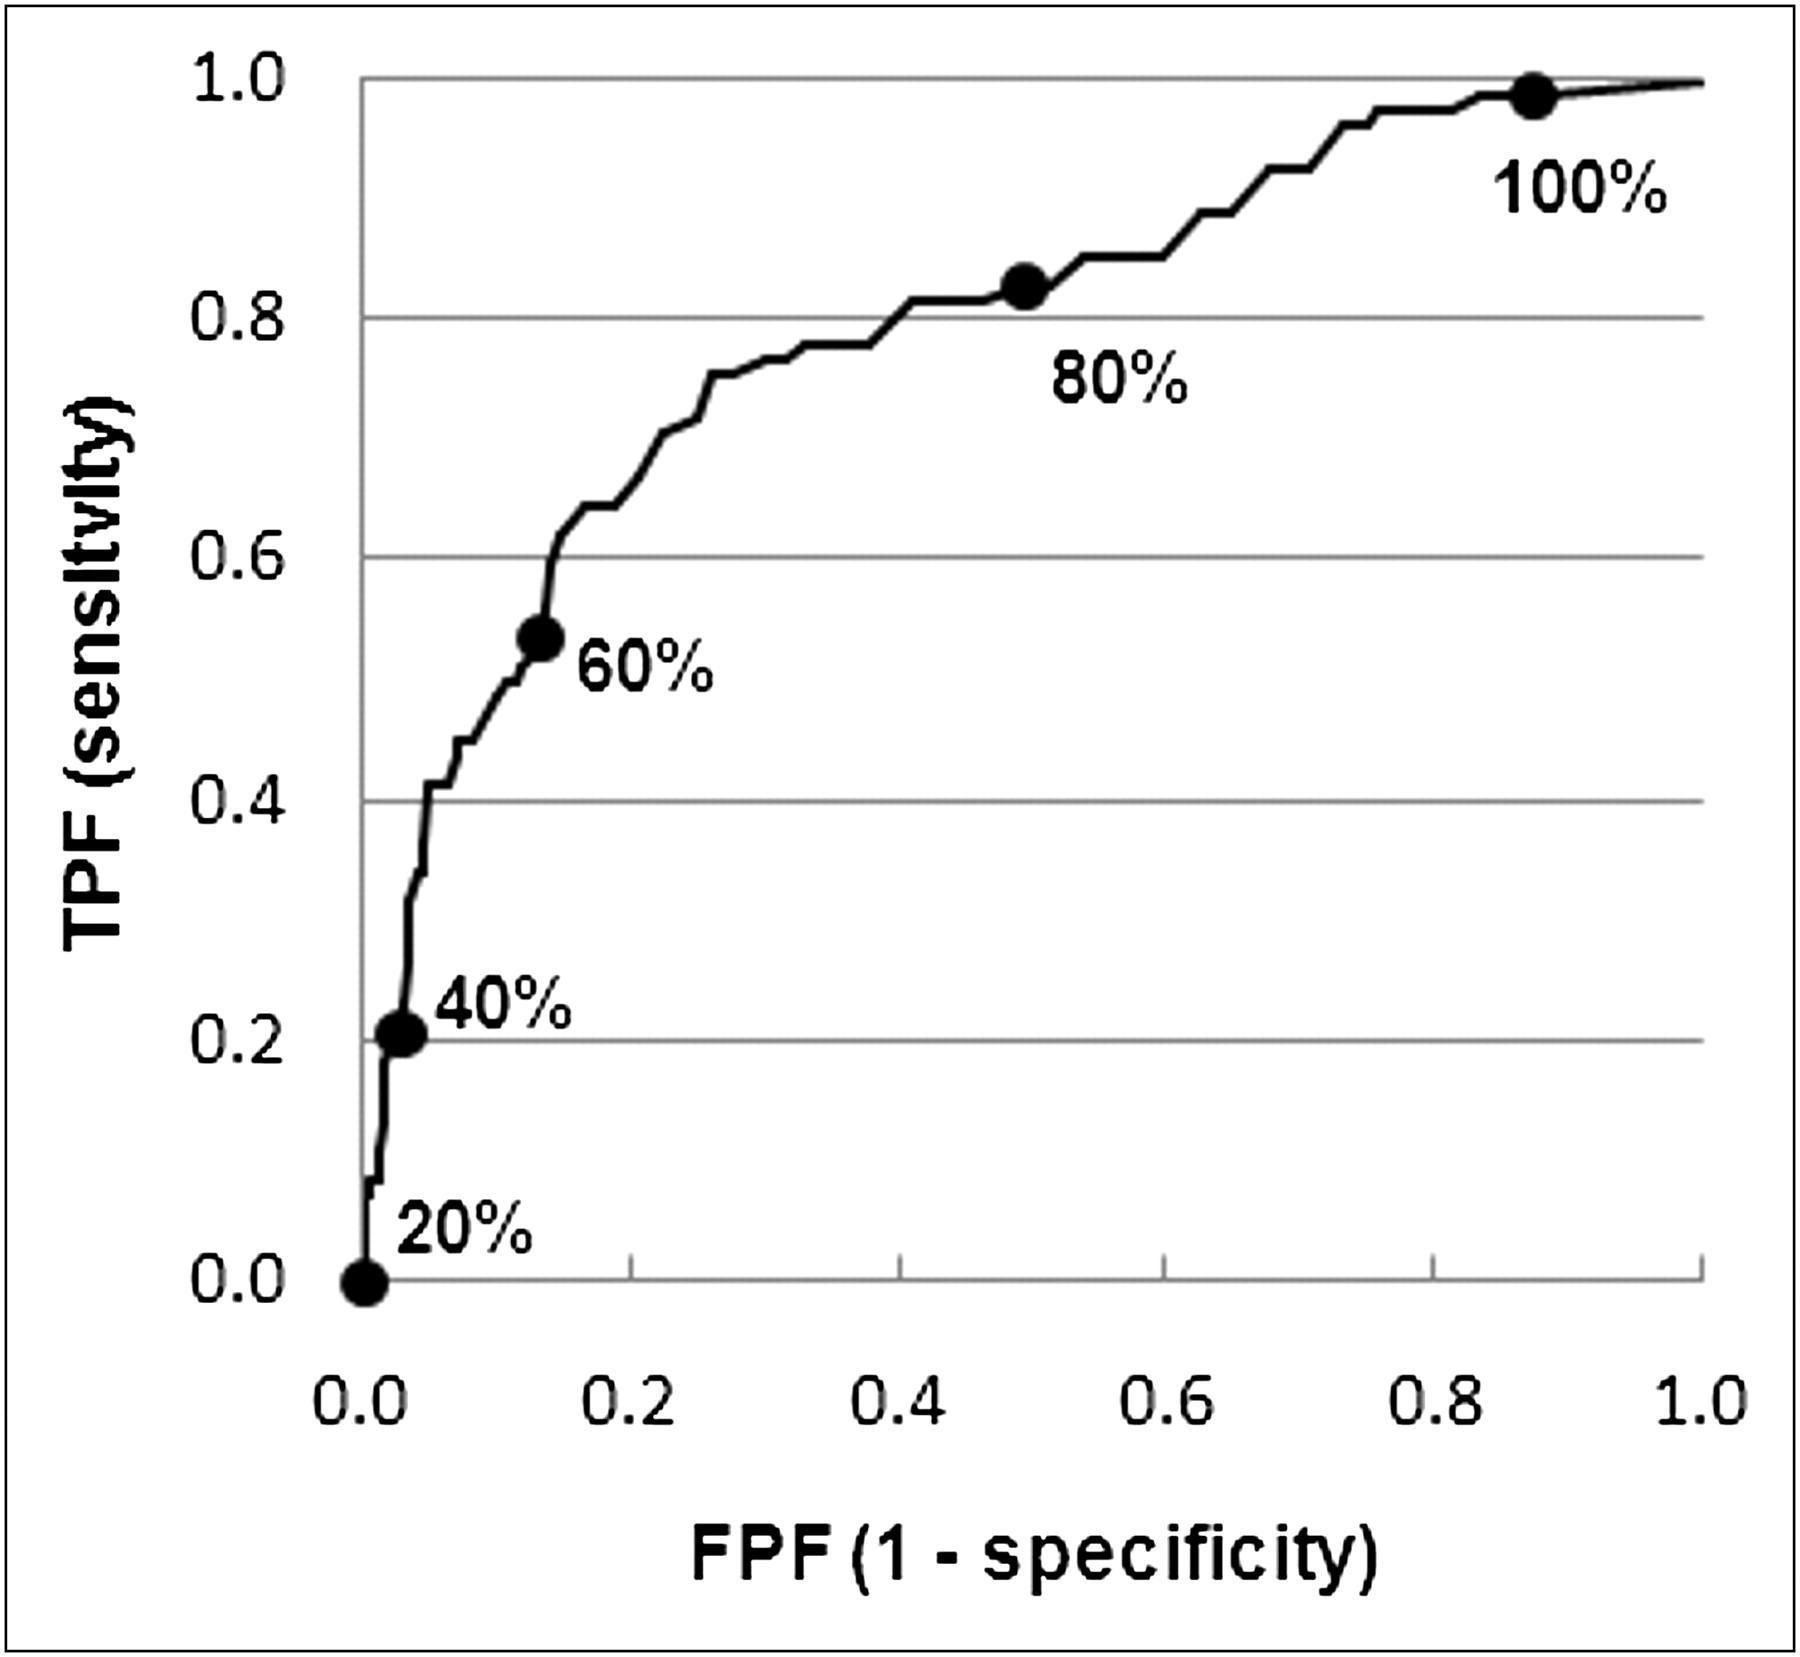
- FIGURE 3.
ROC curve for 201Tl uptake to predict abnormal voltage segments (<1.5 mV). Large dots indicate points on curve for different normalized 201Tl cutoff values. FPF = false-positive fraction; TPF = true-positive fraction.
- FIGURE 4.
For representative patient, SPECT images in short-axis (A) and horizontal-long-axis (B) views indicating inferior defect. Corresponding 3D SPECT surface models of left ventricle (blue) in short-axis (C) and horizontal-long-axis (D) orientations indicate inferior scar (red/brown).
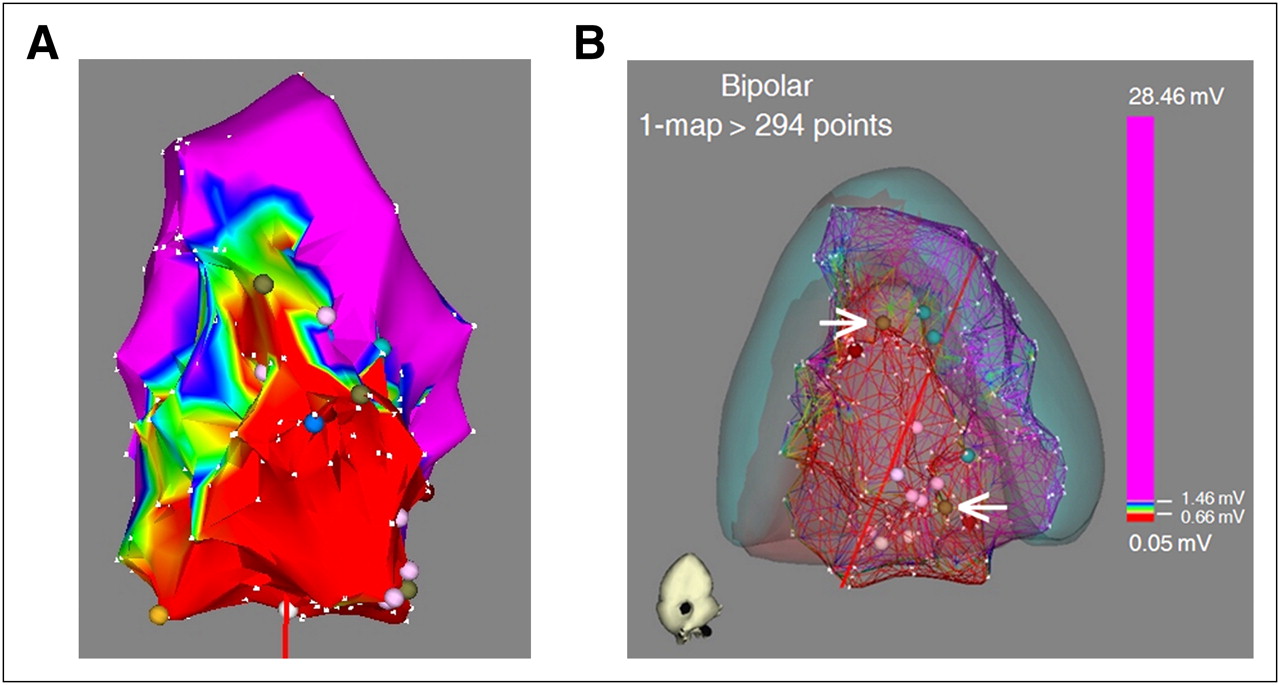
- FIGURE 5.
Integration of corresponding voltage map with 3D SPECT surface models from Figure 4. (A) Voltage map indicating inferior scar (red area) defined as bipolar voltage less than 0.5 mV. (B) 3D SPECT LV (blue) and scar (red/brown) surface models integrated with voltage map showing matched scar location and size between 2 modalities. Successful ablation sites (brown markers; white arrows) were located along scar border.


Tables
Characteristic Value Mean age ± SD (y) 67 ± 10 Sex (n) Male 10 Female 0 Ischemic cardiomyopathy (%) 80 Mean ejection fraction ± SD (%) 33 ± 10 Hypertension (%) 80 Diabetes (%) 30 Hypercholesterolemia (%) 40 Antiarrhythmic therapy (%) 90 β-blocker (%) 70 Amiodarone (%) 40 Sotalol (%) 10 - TABLE 2
Average Position Error Between SPECT LV Model and Electrophysiology Voltage Map for Different Registration Algorithms, Visual Alignment, or Visual Alignment Followed by Surface Registration
Registration method Patient Visual alignment (mm) Visual alignment plus surface registration (mm) 1 7.1 6.0 2 5.2 3.2 3 4.2 3.6 4 6.1 5.0 6 12.3 3.2 7 6.9 4.3 8 5.2 5.1 9 4.5 3.9 10 6.8 4.9 Mean ± SD 6.5 ± 2.4 4.4 ± 1.0 Difference between 2 methods is statistically significant (P = 0.034).
Scar segment Partial-scar segment Patient Voltage map 3D SPECT Voltage map 3D SPECT 1 4, 10, 15 4, 10 3, 5, 9, 11 3, 5, 9, 11, 15 2 None 4, 10 None 9, 11, 15 3 14 13, 14 13 None 4 2, 3, 8, 9, 14 8, 9, 10, 15 4, 10 2, 3, 4, 14 5 4, 10, 15 4, 10, 15 5, 9, 11, 14 5, 11 7 None 4 None 10 8 4, 10 4, 10, 11 None 15 9 3, 9 3, 9 4, 10 4, 10 10 4, 10 4 None 5


Jump to section
Related Articles
Cited By...
- Electroanatomical Mapping at a Crossroads
- Challenging Nuclear Cardiology Research: Stimulating Discovery, Validation, and Clinical Relevance
- Cardiac Imaging in Patients With Ventricular Tachycardia
- Display of 3D Multimodality Cardiac Images With 2D Polar Maps: Simplicity Can Be a Virtue
- 123I-Meta-Iodobenzylguanidine Guanidine-Guided Ventricular Tachycardia Ablation: Will Expanding the Target Improve the Aim?
- Global and Regional Myocardial Innervation Before and After Ablation of Drug-Refractory Ventricular Tachycardia Assessed with 123I-MIBG