


Abstract
The aim of this multicenter study was to investigate whether a computer-assisted diagnosis (CAD) system could improve performance and reduce interobserver variation in bone-scan interpretations of the presence or absence of bone metastases. Methods: The whole-body bone scans (anterior and posterior views) of 59 patients with breast or prostate cancer who had undergone scintigraphy for suspected bone metastatic disease were studied. The patients were selected to reflect the spectrum of pathology found in everyday clinical work. Thirty-five physicians working at 18 of the 30 nuclear medicine departments in Sweden agreed to participate. The physicians were asked to classify each case for the presence or absence of bone metastasis, without (baseline) and with the aid of the CAD system (1 y later), using a 4-point scale. The final clinical assessments, based on follow-up scans and other clinical data including the results of laboratory tests and available diagnostic images (such as MRI, CT, and radiographs from a mean follow-up period of 4.8 y), were used as the gold standard. Each physician's classification was pairwise compared with the classifications made by all the other physicians, resulting in 595 pairs of comparisons, both at baseline and after using the CAD system. Results: The physicians increased their sensitivity from 78% without to 88% with the aid of the CAD system (P < 0.001). The specificity did not change significantly with CAD. Percentage agreement and κ-values between paired physicians on average increased from 64% to 70% and from 0.48 to 0.55, respectively, with the CAD system. Conclusion: A CAD system improved physicians' sensitivity in detecting metastases and reduced interobserver variation in planar whole-body bone scans. The CAD system appears to have significant potential in assisting physicians in their clinical routine.
Interpretation of diagnostic images is a difficult and complicated process. The rapid technical development in this field, from 2-dimensional static images to 3-dimensional, dynamic images and from anatomic images to molecular and functional imaging, makes it an even more demanding task. Furthermore, there is an increasing need for diagnostic examinations in the elderly population. Physicians are, therefore, facing an increasing workload but must still manage to read the diagnostic images carefully and avoid errors in interpretation that may otherwise lead to serious mistakes in the treatment of patients. In attempts to assist physicians, computer-assisted diagnosis (CAD) systems have been applied in the diagnostic fields for drawing the physicians' attention to pathologic changes, minimizing the risk that abnormal findings will be overlooked (1–4).
To investigate the variation in the interpretations of whole-body bone scintigraphy, our group recently performed a nationwide survey (5). Thirty-seven observers, with various levels of experience working at 18 of the 30 hospitals in Sweden performing bone scans, participated. The study showed moderate interobserver agreement (mean κ, 0.48) between the observers and sensitivities for the presence of metastases ranging from 52% to 100%. The variation in interpretations was, therefore, substantial, even for such a well-established and widely used diagnostic method.
In an effort to assist the physicians in accurately interpreting whole-body bone scans, we developed a completely automated CAD system based on image-processing techniques and artificial neural networks (6). The CAD system showed an encouragingly high sensitivity (90%) and specificity (89%) in a test group. The important issue, however, was not the performance of the CAD system per se but whether physicians benefit from it. The purpose of this multicenter study was, therefore, to investigate whether physicians benefit from the advice of our CAD system by reducing interobserver variation and improving performance in the interpretations of bone scans for the presence or absence of bone metastases. We accomplished our purpose with a masked, multicenter, multiple-reader, multiple-case, 3-factors-fully-crossed design, that is, all readers classifying all cases both without and with CAD.
MATERIALS AND METHODS
Patients
We retrospectively selected 59 patients (18 women and 41 men; mean age, 65 y; range, 43–86 y) with a diagnosis of breast or prostate cancer who had undergone whole-body bone scintigraphy because of suspected bone metastatic disease and who had at least one follow-up bone scan. We included the follow-up examinations because these images could improve the accuracy of the gold-standard interpretation. The images were selected during the period August 1999–January 2001 at Sahlgrenska University Hospital, Gothenburg, Sweden. These bone scans have been used previously in a nationwide survey in which the interobserver variation and performance in interpretations for the presence or absence of bone metastases were investigated (5).
To avoid skewed material, the patients were selected to reflect the spectrum of pathology found in everyday clinical work, that is, patients with breast or prostate cancer coming for either their first bone scintigraphy or a follow-up. We have recently studied this type of patient group and found that approximately one third of the cases had clear-cut benign findings (estimated probability of 0.05 or lower), one third were difficult cases with an intermediate probability of metastases (0.06–0.94), and one third were clear-cut cases with obvious metastases (estimated probability of 0.95 or higher) (7). We aimed to achieve approximately the same relation between the 3 groups when selecting the bone scans for the present study. Patients in the 3 groups—classified as benign findings, difficult cases, and obvious metastases—were included consecutively, until the quota of one third was completed for each group.
Bone Scintigraphy
Bone scans were obtained approximately 3 h after intravenous injection of 99mTc-methylene diphosphonate (600 MBq) (Amersham). Whole-body images, anterior and posterior views (scan speed, 10 cm/min; matrix, 256 × 1024), were obtained with a γ-camera equipped with a low-energy high-resolution collimator (Maxxus; General Electric) and stored on a computer system (Star Cam RMX; Maxxus). Energy discrimination was provided by a 15% window centered on the 140-keV peak of 99mTc.
Observers
All physicians in Sweden who interpret bone scans as part of their daily routine were invited to participate in a nationwide survey 1 y before the present study (5). Thirty-seven observers from 18 of the 30 nuclear medicine departments in Sweden agreed to take part, and the results of that study were used as baseline results in the present study. These 37 observers were invited to join the present study, and 35 physicians, of an estimated 100–125 physicians, from 18 of the 30 nuclear medicine departments in Sweden, agreed to participate. Eighteen of the observers worked at university hospitals and the other 17 at regional hospitals. At the time of the baseline study, the physicians were asked to estimate their own experience of bone-scan interpretations in 1 of the 3 groups: inexperienced (<800 bone-scan interpretations), moderately experienced (800–5,000 bone-scan interpretations), or experienced (>5,000 bone-scan interpretations). Five of the physicians regarded themselves as inexperienced, 19 as moderately experienced, and 11 as experienced.
A compact disk containing the 59 bone scans was sent to the physicians in the same way as in the baseline study, except this time a CAD system was included. The scans were presented in a different randomized order, compared with the order in the baseline study. As in the baseline study, the physicians were instructed to visually review the anterior and posterior bone-scan images on a computer screen, using customized software also included on the disk. The Digital Imaging and Communications in Medicine–based software displayed the bone scans in gray scale using 256 steps from white to black and all pixels of the images (1,024 × 256 pixels) without zooming, so that all relevant image information was available to the physicians. The pixel values of the bone scans were below 256, except for the bladder in some of the patients, and pixel values in this range could therefore be displayed properly. The lower and upper window levels could be adjusted in the same way as on a conventional nuclear medicine workstation. The physicians classified the bone scans for the presence or absence of bone metastases using a 4-grade scale.
The observer reviewed a case and was then given a recommendation by the CAD system in the form of grades 1–4. Thereafter, the physician made the final classification.
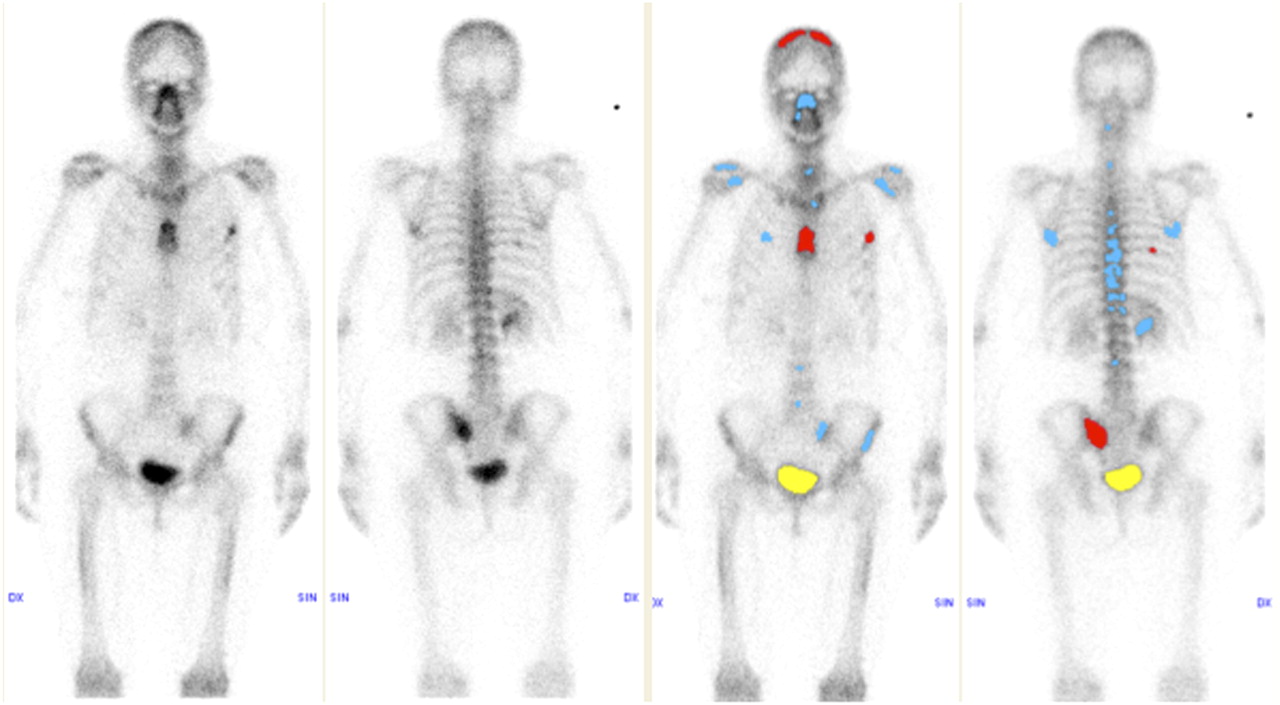
The CAD system, which has been described in detail elsewhere, performs a completely automated detection and analysis of hot spots and also classifies the complete examination based on the hot-spot analysis (6). The method for interpretation of bone scans consists of image-processing techniques and artificial neural networks. The program is fed with the anterior and posterior images in digital format, and no manual steps are required. The first steps are image segmentation, hot-spot detection, and feature extraction. The resulting image features are used as input to artificial neural networks classifying hot spots. A second set of neural networks is used to classify the whole bone scan on the basis of the results of the hot-spot networks. In the user interface, hot spots classified as possible metastases were shown in red, and hot spots classified as benign (e.g., degenerative changes, fractures, and symmetric hot spots) appeared in blue; the bladder was shown in yellow (Fig. 1).

On advice of CAD system, 30 of 35 physicians, compared with 17 physicians without assistance of CAD system, classified this case as TP: 47-y-old woman with breast cancer. Multiple focal increases in pathologic radiotracer uptake can be visualized. Radiography of left thorax verifies bone metastases, and medical record stated metastases in bone, liver, and lungs.
The physicians were given brief information regarding the CAD system, including the sensitivity (95%) and specificity (72%) of the system in a training group of more than 800 cases. The 59 bone scans in the present study material were also used as the test group for CAD and were therefore excluded from the training group in the development of the system. The performance of the CAD system in the study material was not presented to the physicians.
The physicians made their classifications in a masked manner. That is, only age and sex were presented together with the images; no clinical data, results from other imaging modalities, or classifications from the baseline classification were available to the physicians.
Gold Standard
Final clinical assessment of each patient, made by the same experienced physician for all 59 cases, was used as the gold standard classification for the presence or absence of bone metastases. These assessments were based on all bone-scan images, including the follow-up scans; the patients' medical records, including the results of laboratory tests; and available diagnostic MRI, CT, or radiographic images. A biopsy result was available in 1 case. The follow-up scans were used to observe whether hot spots had disappeared, remained unchanged, or decreased or increased in size and intensity. The following diagnostic criteria were applied for the final clinical assessment:
Grade 1 means the absence of bone metastases, in which the scintigraphic pattern is normal or shows hot spots typical of degenerative changes or fractures. There are no clinical or radiographic data indicating bone metastases.
Grade 2 means bone metastases cannot be ruled out with certainty. There is one or more visible hot spots, which have disappeared, remained unchanged, or decreased in size and intensity on the follow-up scan. The patients in this group all underwent cancer therapy between the first and the follow-up scans, when hot spots could either be healed fractures or degenerative changes or metastases. When available, radiographic modalities in the suspected regions leaned away from malignancy, and the gathered clinical judgment leaned toward the low probability of bone metastases.
Grade 3 means bone metastases are probable. There are visible hot spots, with localization, distribution, and intensity not typical of degenerative changes or fractures. Scintigraphic follow-up is not substantially changed. Radiographic modalities are equivocal, but the overall clinical judgement indicates probable bone metastases.
Grade 4 means a definite presence of bone metastases. There are typical scintigraphic or radiographic patterns for bone metastases. The patient's medical record states bone metastases as a secondary diagnosis.
The follow-up scans and the computerized medical record were updated until May 2006, resulting in a mean follow-up of 4.8 y (range, 11 mo to 6 y 9 mo). Twenty-two patients died during the follow-up period. The gold-standard classifications were completed before the disks for the baseline study were sent to the nuclear medicine units.
In the final clinical assessments, 32 patients were classified as grade 1 (5 women and 27 men), 6 as grade 2 (1 woman and 5 men), 0 as grade 3, and 21 as grade 4 (12 women and 9 men). The 38 patients classified as grade 1 or 2 were considered as having no bone metastases, and the 21 patients classified as grade 3 or 4 were considered as having bone metastases in the calculations of sensitivity, specificity, and accuracy.
Statistical Methods
The percentage agreement (PA) and the κ-coefficient (which measures agreement beyond that expected by chance) were calculated. The classifications made by the 35 physicians were pairwise compared with each other (595 pairs in total) (interobserver variation) and with gold standard (performance).
Disagreement between 2 physicians could be systematic or random. To quantify the disagreement between paired ordered categoric classifications, we used a method by Svensson et al. (8,9). Two types of systematic variation are possible. In the first type, variation is due to overestimation or underestimation of the classifications, and the second type is due to concentration of the classifications. Systematic overestimation occurs when 1 observer classifies cases as being more abnormal than does another observer, or, conversely, this is a case of systematic underestimation by the other observer. Systematic concentration occurs when 1 observer uses the middle part of the 4-point scale (cannot be ruled out or probable) more often than does another observer, who uses the grades absence or definitely bone metastasis more often. Overestimation or underestimation is reflected by the variable relative position (RP) and concentration by the variable relative concentration (RC). The possible values for RP and RC range from −1 to 1, and a value of 0 indicates that no systematic disagreement is present. A positive RP value reflects systematic overestimation of the classifications, whereas a negative RP value reflects a systematic underestimation. The RC value is positive if systematic concentration to the middle part of the 4-point scale is present, and a negative RC value reveals systematic concentration to extreme values. When the physicians were compared pairwise, absolute values for RP and RC were presented; that is, the signs of the values changed depending on which of the physicians was placed on the x-axis. When the physicians were compared with the gold standard, the gold standard was always placed on the x-axis.
The pattern of random differences was quantified using the variable of relative rank variance (RV). Random errors could be caused by guessing or losing concentration. The possible values for RV are between 0 and 1, with 0 indicating no random contribution. The influence of the CAD system on interobserver variation was studied in the following way: For each of the 595 pairs of physicians, their agreement or disagreement was quantified both at baseline and with CAD (Table 1). Mean changes between without and with CAD were calculated for all 595 pairs, but no significance tests were applied because the observations were dependent on each other.
Interobserver Variation at Baseline and with CAD System for 595 Pairs of Physicians
The influence of the CAD system on performance was analyzed in the following ways. Friedman rank sum test was used to test the significance level between baseline and when the physicians used the CAD system for PA, κ, RP, RC, and RV (Table 2).
Performance of Physicians (n = 35) at Baseline and with CAD System
The number of false-negative (FN) interpretations (compared with gold standard) at baseline that were changed to true-positive (TP) with the CAD system, and vice versa, were counted. The significance of an imbalance in these numbers describing the change in sensitivity was evaluated using a McNemar test. False-positive (FP) and true-negative (TN) interpretations were analyzed in the same way to describe changes in specificity (Table 3).
Data for Physicians (n = 35) at Baseline and with CAD System
The performance of each physician was measured as the area under the receiver-operating-characteristic (ROC) curve. The differences in ROC areas without and with the CAD system for all physicians were calculated using a multireader, multicase ROC ANOVA trapezoidal area analysis (Dorfman-Berbaum-Metz multiple reader multiple case, version 2.2) (10–16). The statistical analysis of the differences treats both readers and cases as random samples, and the results, therefore, apply to the population of readers and cases (Table 3).
Differences in performance without and with CAD among the 3 groups of inexperienced, moderately experienced, and experienced readers were tested using the Kruskal–Wallis method (Table 4).
Physicians' Mean Values in Performance Without CAD Versus With CAD
RESULTS
Interobserver Variation
Pairwise agreement and disagreement between the 35 physicians was analyzed in 595 unique pairs both at baseline and after the use of the CAD system. On average, PA between the paired readers increased from 64% (range, 41%−88%) at baseline to 70% (range, 44%−95%) with the CAD system and mean κ increased from 0.48 (range, 0.16–0.82) to 0.55 (range, 0.25–0.92). Mean PA, κ, RP, RC, and RV values for all 595 pairs are presented in Table 1. Absolute values of RP and RC were used in the analysis of interobserver variation.
As shown in Table 1, 406 of 595 pairs increased their PA, 41 pairs remained unchanged, and 148 pairs decreased in PA after the use of the CAD system. The same trend can be seen for κ; that is, most physicians (418) increased their agreement with the CAD system.
For systematic (RP and RC) and random (RV) variations, the main reasons for the disagreement in the classifications between the paired physicians when using the CAD system, compared with baseline, was still systematic overestimation or underestimation of the classifications (mean absolute value of RP, 0.079) and concentration of the interpretations on a certain part of the 4-point scale (mean absolute value of RC, 0.11). Some random variations also contributed to the disagreements. The CAD system helped to decrease the interobserver variations between the physicians for most pairs (Table 1).
Performance
The average PA, κ, RP, RC, and RV values for the comparisons between the 35 physicians and the gold standard, both at baseline and with the CAD system, are presented in Table 2. In comparison with the gold standard, the physicians showed a significant increase in PA from 66% without CAD to 73% with CAD and a significant increase in κ-values from 0.49 without CAD to 0.58 with CAD. The RP values show that some physicians overestimated and others underestimated the presence of metastases, compared with the gold standard, but most readers were close to zero; the mean value for the whole group was 0.010. No significant difference in RP was observed between the classifications made at baseline and with the CAD system. The main reason for disagreement at baseline was that the physicians concentrated (RC) more on the middle of the 4-point scale (grades 2 and 3), in contrast to the gold standard. The disagreement in concentration was still present with the CAD system but significantly reduced; that is, the physicians used the more uncertain middle part of the 4-point scale (cannot be ruled out or probable) less often. In addition, the contribution of random errors (RV) decreased significantly from 0.010 to 0.005 (P = 0.01).
The sensitivities and specificities for the 35 physicians are illustrated both at baseline (Fig. 2A) and with a CAD system (Fig. 2B). The sensitivities for the physicians increased significantly with the CAD system, from an average of 78% to 88% (P < 0.001) (Table 3). When the physicians' interpretations were compared from baseline with the final interpretation with CAD, 94 classifications were changed from FN to TP, and 16 classifications were changed from TP to FN. A change from FN to TP was seen both in the 6 patients included as difficult cases (50 classifications) and in the 15 patients included as obvious metastases (44 classifications). The specificities did not change significantly with the CAD system (Table 3). Forty-eight cases were changed from TN to FP, and 34 cases were changed from FP to TN, from baseline to the final interpretation with CAD. The following formula was used in the calculations of accuracy at baseline (Table 3): and with CAD:

Sensitivities and specificities for 35 physicians when classifying bone-scan images without (A) and with (B) CAD system.
The physicians performed better with than without the CAD system, expressed as an increased area under the ROC curve from 0.925 to 0.961 (P = 0.005) (Table 3).
No significant difference was observed in performance among the 3 groups (inexperienced, moderately experienced, or experienced physicians) (Table 4).
Eleven of the observers who participated in this study classified themselves as experienced. If this group had been used as an expert panel and the majority rule was applied to their interpretations to reach an alternative gold standard, 53 of the 59 cases would have had the same classification regarding presence or absence of bone metastases. In 2 of the other 6 cases, nearly all (10/11) the experienced physicians classified the increased uptake as benign. One of these patients had a positive biopsy result, and the other showed increased uptake in lesion size and intensity on the follow-up scans. In the remaining 4 cases, there was more disagreement among the 11 experienced physicians: 3 cases with 6 votes against 5 and 1 with 7 votes against 4.
DISCUSSION
Main Findings
The present multicenter study demonstrates that physicians can benefit from a CAD system by reduced interobserver variation and improved interpretations of bone scans for the presence or absence of bone metastases. Performance improved for the detection of bone metastases when CAD was used. Sensitivity increased significantly from an average of 78% without CAD to 88% with CAD, and interobserver variation decreased with CAD. The area under the ROC curve increased from 0.925 without CAD to 0.961 with CAD (P = 0.005). These findings are in accordance with previously presented results in this field. Lindahl et al. studied 3 physicians interpreting 135 myocardial perfusion scintigrams without and with a CAD system and found both improved performance, expressed as increases in the areas under the ROC curves from 0.65 to 0.70 and from 0.79 to 0.82 for 2 vascular territories, and significantly less interobserver variation with CAD (17). Tägil et al. studied 7 physicians interpreting 97 myocardial perfusion scintigrams first without and then with a CAD system and they also found both improved performance, expressed as increased sensitivity for ischemia from 81% without CAD to 86% with the CAD system, and less interobserver variation with CAD (18).
In mammography screening, double readings have been used in some centers in the United States and Europe to increase sensitivity in the detection of breast cancer. However, this procedure is time-consuming and costly from a radiologist workforce perspective. Gromet investigated the efficacy of single reading (without CAD) to double reading and to single reading with CAD and found that the sensitivity increased from 81.4% to 88.0% to 90.4%, respectively (2). Gromet concluded that CAD enhances the performance of a single reader, yielding increased sensitivity, with only a small increase in recall rate. Gromet has routinely converted from double reading to single reading with CAD in screening mammograms (2). In a recent review presenting computer-aided diagnosis in medical imaging, Doi summarized the results of 6 prospective studies on the usefulness of CAD for detection of breast cancers in screening mammography. All 6 studies indicated an increase in the detection rates from 1.7% to 19.5% in finding cancers (1).
Golding et al. summarized in a review the current state of the art of CAD techniques for the detection and characterization of solitary pulmonary nodules and their potential applications in the clinical work-up. These authors concluded that CAD, serving as a second reader, may provide better sensitivity for small nodules, easier enumeration and better documentation, improved interobserver and interscan consistency in follow-up examinations, and a more objective assessment of significant temporal change in lesion size and number (3). Furthermore, Halligan et al. investigated the effect of CAD assistance on radiologists in the interpretation of CT colonography and found significantly increased sensitivity in detecting polyps, particularly of small and medium size, and significantly reduced interpretation time (19). Interestingly, all readers saw more small polyps with CAD, despite the fact that the CAD system flagged only 33.8% of these lesions.
Study Limitations
No obvious bias was found in our method of including physicians in the study, but bias cannot be ruled out. There is a trade-off between the number of observers who will agree to participate in a study such as this and the number of cases each observer is asked to read. We decided to include as many cases as could be read in approximately 1 h. If all physicians in the country participated and if each of them read an even larger number of cases, the study would have been strengthened, but its outcome was superior to that of many similar trials. In earlier studies, usually only a few (3–10) readers were included, some of them working at the same hospital, and in some studies only experienced readers were selected to join (2,17–19). The aim of our study was to investigate the effect of the CAD system on the average physician who normally interprets bone scans. Therefore, our approach was to include a high number of physicians, who had various levels of experience and worked at different hospitals, and ask them to interpret bone scans that reflected the spectrum of pathology found in everyday clinical work.
The question of whether clinical information has a major impact on decision making has been raised. The aim of the baseline (5) and the present studies was to assess the observer's skillfulness in pattern recognition—the ability to take into account numbers of hot spots and their distribution, localization, and intensity—rather than to investigate the physician's variation in interpreting clinical information. Our intention was to exclude the uncertainty of whether errors in interpretations are either due to incomplete or even wrong clinical information or due to misinterpretations of the images. Peters et al. studied clinical auditing in nuclear medicine in a 2-phase investigation (20). In phase 1, either a brief clinical history or no clinical history was available to the auditor, and in phase 2 all clinical information was given. Before embarking on phase 2, the results from phase 1, as an auditing exercise, were discussed by all 6 physicians. The final results showed no significant difference between the 2 phases in the nontrivial errors, in which the physicians failed to report increased uptake in scans in cancer patients. These 2 actions—providing the clinical information and discussing the erroneous classifications—seem not to be enough to enhance the ability of the physician in detecting lesions. Therefore, our CAD system could be a complement in alerting the observers to pathologic uptake.
At the current stage, the CAD system is developed to assist physicians in the interpretation of whole-body bone scans. Other imaging modalities, such as SPECT/CT or MRI, are sometimes used to further improve diagnostic accuracy when whole-body bone scans fail to demonstrate metastases. Future CAD systems may be able to analyze combinations of image series from the same patient, such as a whole-body bone scan and a SPECT/CT study of, for example, the pelvic region.
Histologic verification is considered to be one of the most accurate gold standards, but this procedure is practically impossible to perform on each hot spot found on bone scans. In the development of the CAD system, we used an experienced physician's interpretation for the training group, adding follow-up bone scans and radiologic information in difficult cases whenever available. The gold standard applied for the 59 patients used as the test group for CAD (6) and for the physicians in the present study was based on final clinical assessment made by the same expert physician as in the training group and could constitute a bias. However, the gold standard in the test group was based not only on the bone-scan images but also on the follow-up scans; the patient's computerized medical record, including the results of laboratory tests; and all available diagnostic images (MRI, CT, and radiography) for a mean follow-up duration of 4.8 y. If we had used the 11 experienced physicians as an expert panel and the majority rule was applied to their interpretations to reach an alternative gold standard, 53 of the 59 cases would have had the same classification regarding presence or absence of bone metastases as our gold standard, based on nearly a 5-y follow-up period. In the 6 cases that were diagnosed differently from our gold standard, follow-up had an important impact on the final diagnosis, indicating that our gold standard—based on final clinical assessment—is less dependent on the experience of this 1 expert physician.
Clinical Implications
CAD is a different concept from automated computer diagnosis as stated by Doi (1). The system can be used by physicians but does not replace them, and the physician is still responsible for lesion analysis and the final interpretation of an examination. The synergistic effects obtained by combining the physician's competence with the computer's capability of considering multiple factors and avoiding distractions and extraneous factors such as what the last few cases looked like can result in more accurate interpretations. Physicians can benefit from the advice of a CAD system, even though the CAD advice is not always correct. This can be illustrated by 2 cases from the present study. The case shown in Figure 1 was correctly classified as metastases by the CAD system, and with the computer's advice 30 physicians, instead of 17 without CAD advice, made a correct interpretation. Figure 3 shows an example of a patient with fractures, misclassified by the CAD system as having metastases but correctly classified by 33 of 35 physicians, despite FP CAD advice. We found that the high specificity reported by the physicians at baseline was not statistically affected by FP CAD classifications; this finding is supported by Taylor et al., who tested a CAD system for interpretation of CT colonography (21).

A 63-y-old man with prostate cancer. Increased radiotracer uptake can mainly be seen in rib or costal cartilages, which disappeared on follow-up scan. Localizations suggest fractures. CAD system classifies this patient as having metastases, but majority of physicians (33/35) interpreted images correctly, despite erroneous advice from CAD system.
No significant difference was observed in performance among the 3 groups of physicians (Table 4). An explanation could be that few observers were in each group; however, the study was not designed specifically to answer this question.
Our CAD system was designed to propose the classifications “cannot be ruled out” or “bone metastases probable” in a minority of cases. This interpretive style of the CAD system resulted in the physicians' use of the definite diagnosis “absence of bone metastases” or “definite presence of bone metastases” more often. These results show that a CAD system can influence the interpretive style of physicians, but we acknowledge that there can be different opinions regarding how frequently uncertainty should be indicated in clinical reports.
CONCLUSION
A CAD system can reduce interobserver variation and improve the physician's sensitivity in detecting metastases in planar whole-body bone scans. The CAD system appears to have significant potential in assisting physicians in their clinical routine.
Acknowledgments
The study was approved by the Research Ethics Committee at Gothenburg University. Lars Edenbrandt and Andreas Järund are employed by, and shareholders in, EXINI Diagnostics AB, which provides CAD software for nuclear medicine studies. The CAD system described in this study will be incorporated in a commercially available software package developed by EXINI Diagnostics AB. The Sahlgrenska Academy (ALF-grants) funded this study.
Footnotes
-
COPYRIGHT © 2009 by the Society of Nuclear Medicine, Inc.
References
- Received for publication October 9, 2008.
- Accepted for publication December 2, 2008.


Jump to section
Related Articles
Cited By...
- A Preanalytic Validation Study of Automated Bone Scan Index: Effect on Accuracy and Reproducibility Due to the Procedural Variabilities in Bone Scan Image Acquisition
- Analytic Validation of the Automated Bone Scan Index as an Imaging Biomarker to Standardize Quantitative Changes in Bone Scans of Patients with Metastatic Prostate Cancer
- The Science and Practice of Bone Health in Oncology: Managing Bone Loss and Metastasis in Patients With Solid Tumors