


Abstract
The synaptic vesicle glycoprotein 2A (SV2A) is found in secretory vesicles in neurons and endocrine cells. PET with a selective SV2A radiotracer will allow characterization of drugs that modulate SV2A (e.g., antiepileptic drugs) and potentially could be a biomarker of synaptic density (e.g., in neurodegenerative disorders). Here we describe the synthesis and characterization of the SV2A PET radiotracer 11C-UCB-J ((R)-1-((3-(11C-methyl-11C)pyridin-4-yl)methyl)-4-(3,4,5-trifluorophenyl)pyrrolidin-2-one) in nonhuman primates, including whole-body biodistribution. Methods: 11C-UCB-J was prepared by C-11C-methylation of the 3-pyridyl trifluoroborate precursor with 11C-methyl iodide via the Suzuki–Miyaura cross-coupling method. Rhesus macaques underwent multiple scans including coinjection with unlabeled UCB-J (17, 50, and 150 μg/kg) or preblocking with the antiepileptic drug levetiracetam at 10 and 30 mg/kg. Scans were acquired for 2 h with arterial sampling and metabolite analysis to measure the input function. Regional volume of distribution (VT) was estimated using the 1-tissue-compartment model. Target occupancy was assessed using the occupancy plot; the dissociation constant (Kd) was determined by fitting self-blocking occupancies to a 1-site model, and the maximum number of receptor binding sites (Bmax) values were derived from baseline VT and from the estimated Kd and the nondisplaceable distribution volume (VND). Results: 11C-UCB-J was synthesized with greater than 98% purity. 11C-UCB-J exhibited high free fraction (0.46 ± 0.02) and metabolized at a moderate rate (39% ± 5% and 24% ± 3% parent remaining at 30 and 90 min) in plasma. In the monkey brain, 11C-UCB-J displayed high uptake and fast kinetics. VT was high (∼25–55 mL/cm3) in all gray matter regions, consistent with the ubiquitous expression of SV2A. Preblocking with 10 and 30 mg/kg of levetiracetam resulted in approximately 60% and 90% occupancy, respectively. Analysis of the self-blocking scans yielded a Kd estimate of 3.4 nM and Bmax of 125–350 nM, in good agreement with the in vitro inhibition constant (Ki) of 6.3 nM and regional Bmax in humans. Whole-body biodistribution revealed that the liver and the brain are the dose-limiting organs for males and females, respectively. Conclusion: 11C-UCB-J exhibited excellent characteristics as an SV2A PET radiotracer in nonhuman primates. The radiotracer is currently undergoing first-in-human evaluation.
- 11C-UCB-J
- SV2A
- synaptic vesicle glycoprotein
- rhesus monkey
- PET
- epilepsy
- biomarker
- levetiracetam
- nonhuman primate
The synaptic vesicle glycoprotein 2A (SV2A) is a transmembrane protein expressed ubiquitously in secretory vesicles in all brain areas (1,2). SV2A is critical for synaptic function (3), but the mechanisms by which SV2A regulates neurotransmitter release are unclear. Mice deficient in SV2A develop seizures and die within 3 wk of birth (4). In addition to its well-established role as the target for the antiepileptic drug levetiracetam (5,6), dysfunction of SV2A has been implicated in other neurologic disorders such as Alzheimer's disease (7–9).
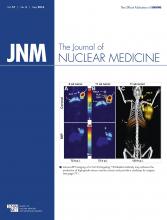
PET imaging can be used to measure differences in the density of a molecular target under various disease conditions. Therefore, PET imaging of SV2A could be used to measure brain levels of SV2A in patients with epilepsy, Alzheimer's disease, or other neurologic and psychiatric conditions in which SV2A may play a role, and potentially as a biomarker of synaptic density in neurodegenerative disorders. Radiotracer can also be used to measure a drug’s binding to its target, and PET imaging of SV2A could be used to characterize binding of levetiracetam or other SV2A-targeting drugs. A PET radiotracer should have high affinity and specificity for the target and fast kinetics. Although direct radiolabeling of levetiracetam (Fig. 1) is feasible (10), it is likely that its affinity is too low and its brain penetration not sufficiently fast to perform well as a PET tracer. Hence, we have developed several high-affinity SV2A ligands that penetrate the brain rapidly: UCB-A, UCB-H, and UCB-J (Fig.1) (11). UCB-A has been radiolabeled with 11C and tested in mini-pigs (12), rats (13), and rhesus monkeys (Nabulsi et al., unpublished data, 2012) but showed slow kinetics (prolonged retention in brain tissue) and may therefore not be suitable for PET imaging (unpublished data). UCB-H was radiolabeled with 18F and displayed good kinetics in rats (14) and nonhuman primates (15) and acceptable dosimetry in humans (16); however, its radiosynthesis has proven challenging and specific binding was relatively low. In this study, we report the radiosynthesis and characterization of 11C-UCB-J as a best-in-class SV2A PET tracer.

MATERIALS AND METHODS
Chemistry
Figure 2 depicts a brief synthesis scheme for the preparation of the unlabeled UCB-J reference standard (3), the trifluoroborate radiolabeling precursor (6), and the radiolabeled tracer (7). Both the precursor and the reference standard were prepared from commercially available or custom-synthesized starting materials. Details are described in the supplemental materials (available at http://jnm.snmjournals.org).

Synthesis of UCB-J, 11C-UCB-J, and the radiolabeling precursor: a. KI, NaH, THF, 50°C; b. NaH, THF, 50°C; c. Bis(neopentyl glycolato)diboron, Pd(dppf)Cl2, AcOK, dioxane, 110°C; d. KHF2, r.t.; e. Pd2(dba)3/(o-tolyl)3P, K2CO3, DMF/H2O, 100°C, 5 min.
In Vitro Binding Assays
Binding assays were performed as previously described (17–19). The selectivity of UCB-J was assessed by its ability to interact with various receptors, transporters, enzymes, and ion channels (>55 targets) when tested at a concentration of 10 μM. Details are described in the supplemental materials.
In Vitro and In Vivo Metabolism in Rats
Studies characterizing the pharmacokinetics, distribution, and metabolism of UCB-J included in vitro experiments, in vivo plasma pharmacokinetics, brain distribution, and metabolite profiling in rat plasma and brain are summarized in Table 1. Details are described in the supplemental materials. UCB-J metabolites were detected and identified using an ultraperformance liquid chromatography tandem mass spectrometry system.
Summary of Studies for Pharmacokinetics, Distribution, and Metabolism in Animals
Radiochemistry
11C-UCB-J was synthesized as previously reported (Fig. 2) (20). The radioligand was purified by reversed-phase high-performance liquid chromatography and formulated in 10 mL of normal saline containing 1 mL of ethanol. Details are described in the supplemental materials.
PET Imaging Experiments in Rhesus Monkeys
General PET Study Design
Experiments were performed in rhesus monkeys (Macaca mulatta) according to a protocol approved by the Yale University Institutional Animal Care and Use Committee. Three sets of scans were obtained: baseline scan with 11C-UCB-J, followed by a blocking scan after administration of levetiracetam at a dose of 10 (n = 2) or 30 mg/kg (n = 1); in vivo maximum number of receptor binding sites (Bmax)/dissociation constant (Kd) studies with coinjection of 11C-UCB-J and its unlabeled form at mass doses of 17, 50, and 150 μg/kg (n = 1 each), targeting approximately 25%, 50%, and 75% SV2A occupancy; and whole-body biodistribution scans (n = 2 males and 2 females).
PET Scans and Image Analysis Procedures
Rhesus macaques were sedated using ketamine and glycopyrrolate approximately 2 h before the first PET scan and kept anesthetized using isoflurane (1.5%–2.5%) for the duration of the experiments.
PET images of the brain were acquired using the FOCUS 220 PET scanner (Siemens Preclinical Solutions) with a reconstructed image resolution of approximately 1.5 mm. After a transmission scan, 11C-UCB-J was injected intravenously as a 3-min slow bolus by an infusion pump (PHD 22/2000; Harvard Apparatus). List-mode data were acquired for 120 min and binned into sinograms with the following frame timing: 6 × 30 s, 3 × 1 min, 2 × 2 min, and 22 × 5 min.
Scan data were reconstructed with a Fourier rebinning/filtered backprojection algorithm with corrections for attenuation, scanner normalization, radiation scatter, and randoms. Regions of interest were manually delineated on a single representative anatomic rhesus monkey MR image registered to a template image. The regions used in this study were amygdala, brain stem, caudate, cerebellum, cingulate cortex, frontal cortex, globus pallidus, insula, nucleus accumbens, occipital cortex, pons, putamen, substantia nigra, temporal cortex, and thalamus. Registration parameters were obtained to apply the regions of interest to individual PET scans (21), and regional time–activity curves were generated.
For the biodistribution scans, whole-body dynamic PET scanning was performed on the Siemens mCT scanner.
Metabolite Analysis, Arterial Input Function, and Log D Determination
Arterial blood samples were collected to calculate the plasma input function and to determine the unmetabolized parent fraction using the automatic column-switching high-performance liquid chromatography system (22). Plasma free fraction (fp) was measured in triplicate using the ultrafiltration method, and the log D was determined by modification of the previously published procedure (23). Additional details are provided in the supplemental materials.
Data Analysis
Regional time–activity curves of the brain were analyzed with the 1-tissue- (1T) compartment model. Fit quality was compared with the 2-tissue model and the multilinear analysis method (24) to calculate VT. For the blocking and displacement experiments, target occupancy was determined using the occupancy plot (25).
For the whole-body scans, decay correction was removed from the time–activity curves to reflect actual radioactivity in each organ, with cumulative radioactivity (Bq·h/cm3) computed as the integral of the data from the scan, using physical decay to add the tail portion after the scan period.
RESULTS
Chemistry
Synthesis details of both UCB-J (3) and the radiolabeling precursor (6) (Fig. 2) are described in the supplemental materials.
In Vitro Binding
In radioligand binding studies at 37°C, UCB-J displayed high SV2A binding affinity: pKi of 8.15 (7 nM) for humans and 7.6 (25 nM) for rats. As listed in Table 2, UCB-J exhibited a greater than 10-fold and greater than 100-fold selectivity for SV2A over SV2C and SV2B protein, respectively. Moreover, UCB-J at 10 μM lacked any significant interaction (<50% inhibition) with a wide variety of receptors, ion channels, enzymes, and transporters (Table 3). UCB-J is therefore a potent and selective SV2A ligand.
Affinity of UCB-J for SV2 Proteins at 37°C
Inhibition (%) of Radioligand Binding* to Selected Targets
In Vitro Permeability Measurement, In Vivo Distribution, and Metabolism in Rats
In the caco-2 assay, the apparent permeability (Papp) values for UCB-J were 323 and 246 nm/s, in the A > B and the B > A assays, respectively, confirming high cell membrane permeability and absence of active transport.
In rats, UCB-J rapidly distributed into the brain in an unrestricted manner, which is consistent with its high blood–brain barrier permeability. Brain concentrations were maximal at 5 min after the dose and rapidly equilibrated with plasma concentrations. Total brain-to-plasma ratios were 8.7, 8, and 12 at 5, 10, and 20 min, respectively. Free brain-to-plasma UCB-J ratios ranged from 1.1 to 1.6 without obvious evidence of active transport. The fraction unbound to plasma proteins was investigated at 1 μM and found to be 33% and 31% in rat and human plasma, respectively. The fraction unbound in rat brain homogenate varied with the concentration, ranging from 3% to 9%.
In rats, UCB-J was rapidly eliminated, with a high total plasma clearance (30 ± 10 mL/min/kg) consistent with the medium-to-high in vitro intrinsic clearance observed in the mouse (39 μL/min/mg protein), rat (46 μL/min/mg protein), monkey (82 μL/min/mg protein), and human (16 μL/min/mg protein). On the basis of mass spectrometry response, the parent compound UCB-J was the major component detected in rat plasma and brain.
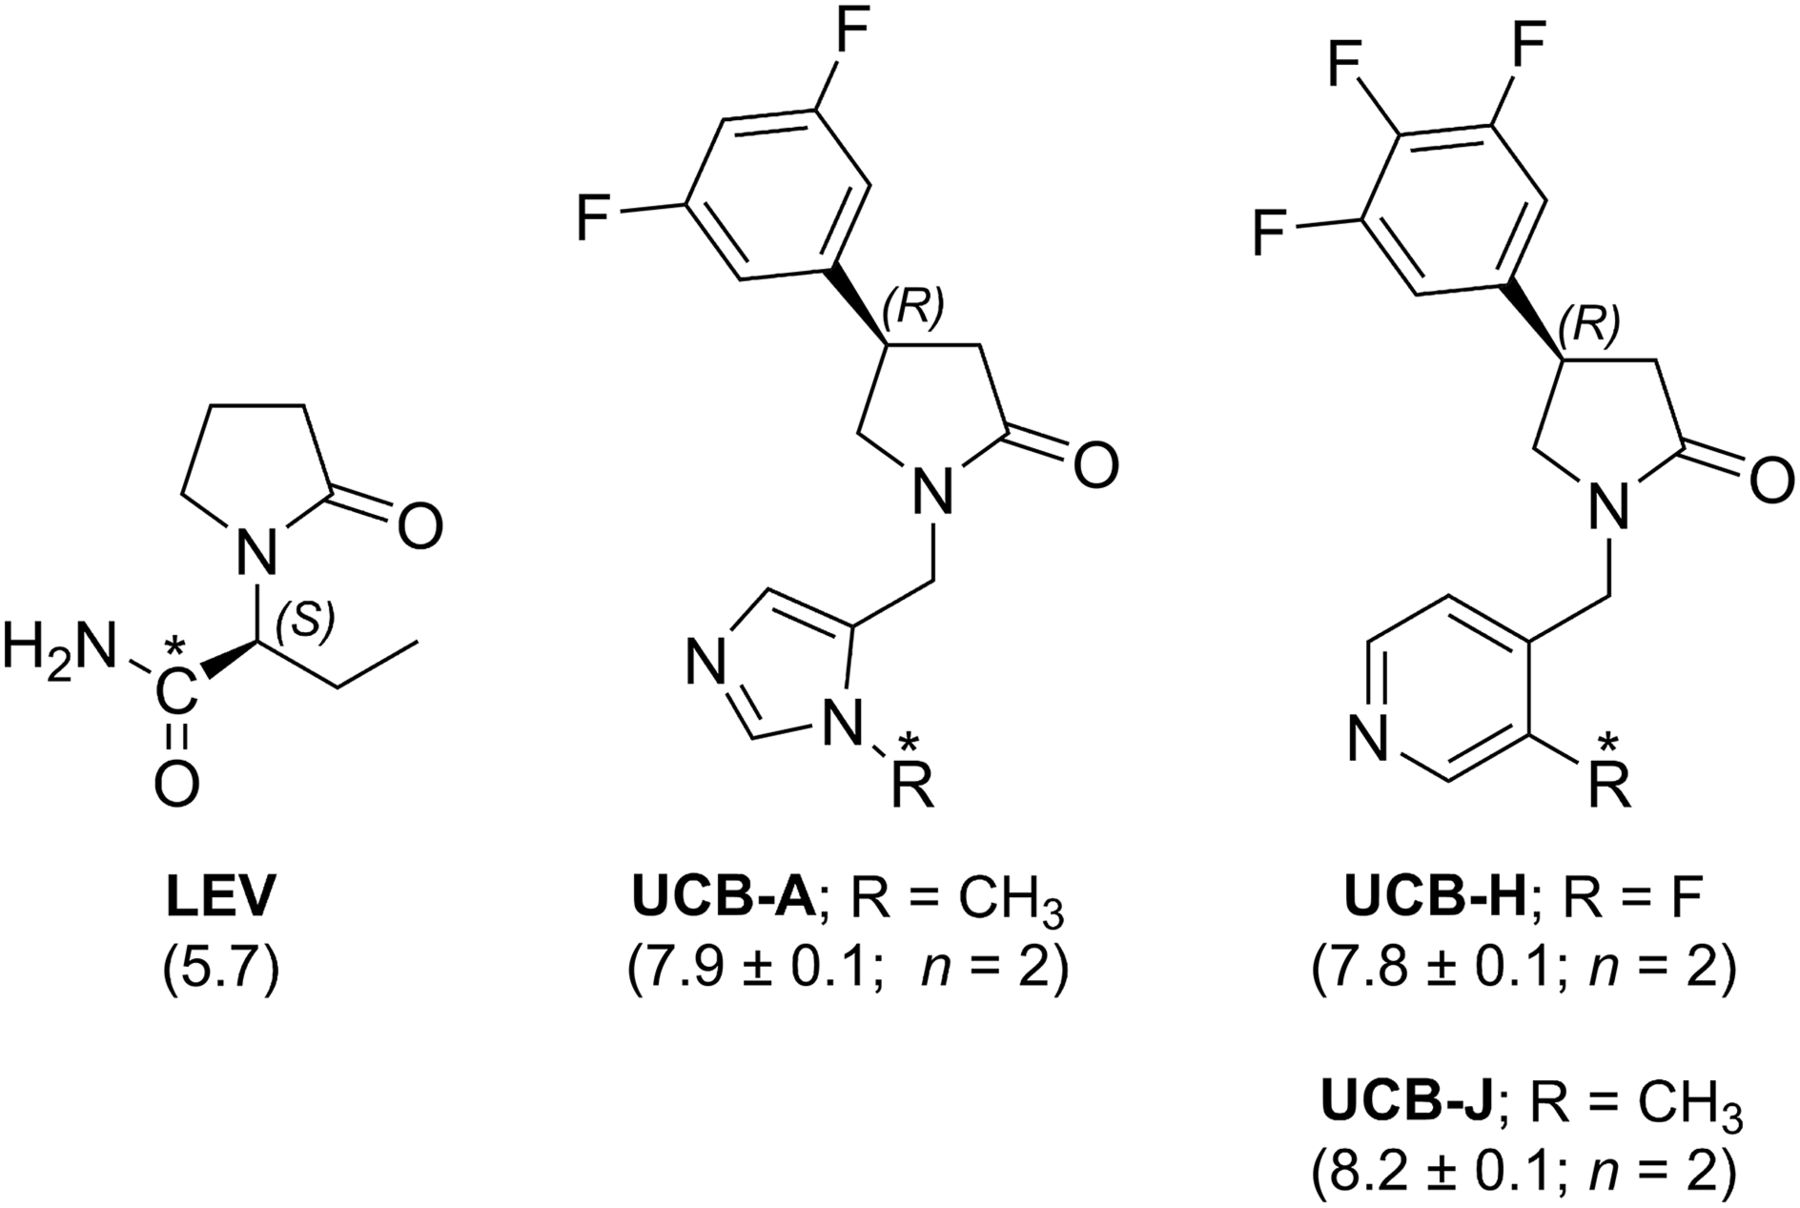
The metabolic clearance of UCB-J occurred by 3 major pathways as shown in Figure 3: N-oxidation (M1), methyl hydroxylation (M2), and N-dealkylation of the pyrrolidinone ring (M3). M1, M2, and M3 were found at 16.9%, 7.7%, and 1.3% (percentage of total detected material), respectively, from the 0- to the 2-h period.

Metabolic pathways in rat plasma after single intravenous dose of UCB-J (1 mg/kg).
In the rat brain, M1 and M2 were the only metabolites observed at trace levels (0.1% and 1.3%, respectively, average for the 0- to 2-h collection period). Qualitative mass spectrometry evaluation of the interspecies metabolism suggested that the metabolic clearance of UCB-J occurred primarily by hydroxylation on the methyl pyridine ring. No unique human metabolite was observed, suggesting that the metabolites observed in humans should be the same as those in rats. Overall, these data suggest that the circulating metabolites are polar and thus not likely to cross the blood–brain barrier.
Radiochemistry
11C-UCB-J was produced from 1 mg of precursor in a radiochemical yield of 11% ± 4% (based on trapped 11C-methyl iodide radioactivity), with a radiochemical purity of 99% ± 0.5%, chemical purity of 99.8% ± 2.4%, and specific activity of 566.1 ± 266 MBq/nmol at the end of synthesis (n = 16). The stability of 11C-UCB-J was evaluated at 150 min after the end of synthesis, with the radiochemical purity maintained at 99% or greater. Further details are reported in the supplemental materials.
PET Scans in Rhesus Monkeys
For the brain imaging study, the injected dose of 11C-UCB-J was 141 ± 42 MBq, with a specific activity of 252 ± 151 MBq/nmol at the time of injection (n = 11), and injected mass was 0.05 ± 0.04 μg/kg (n = 8). For the dosimetry scans, the injected radioactivity dose was 170 ± 15 MBq, with a specific activity of 371 ± 42 MBq/nmol at the time of injection and injected mass dose of 0.02 ± 0.01 μg/kg (n = 4).
In Vivo Metabolite Analysis in Monkeys
11C-UCB-J displayed fairly fast metabolism in Rhesus monkeys. The parent fraction in the plasma accounted for approximately 40% and about 25% of the radioactivity at 30 and 90 min after injection, respectively. The primary metabolite peak was more polar than the parent (retention time of ∼7 min, compared with ∼11 min for the parent compound). The fp was high, at 46.2% ± 2.5% (n = 11). The measured log D of 11C-UCB-J was 2.53 ± 0.02 (range, 2.46–2.56), in the optimal range for brain PET radiotracers.
Image Analysis and Kinetic Modeling
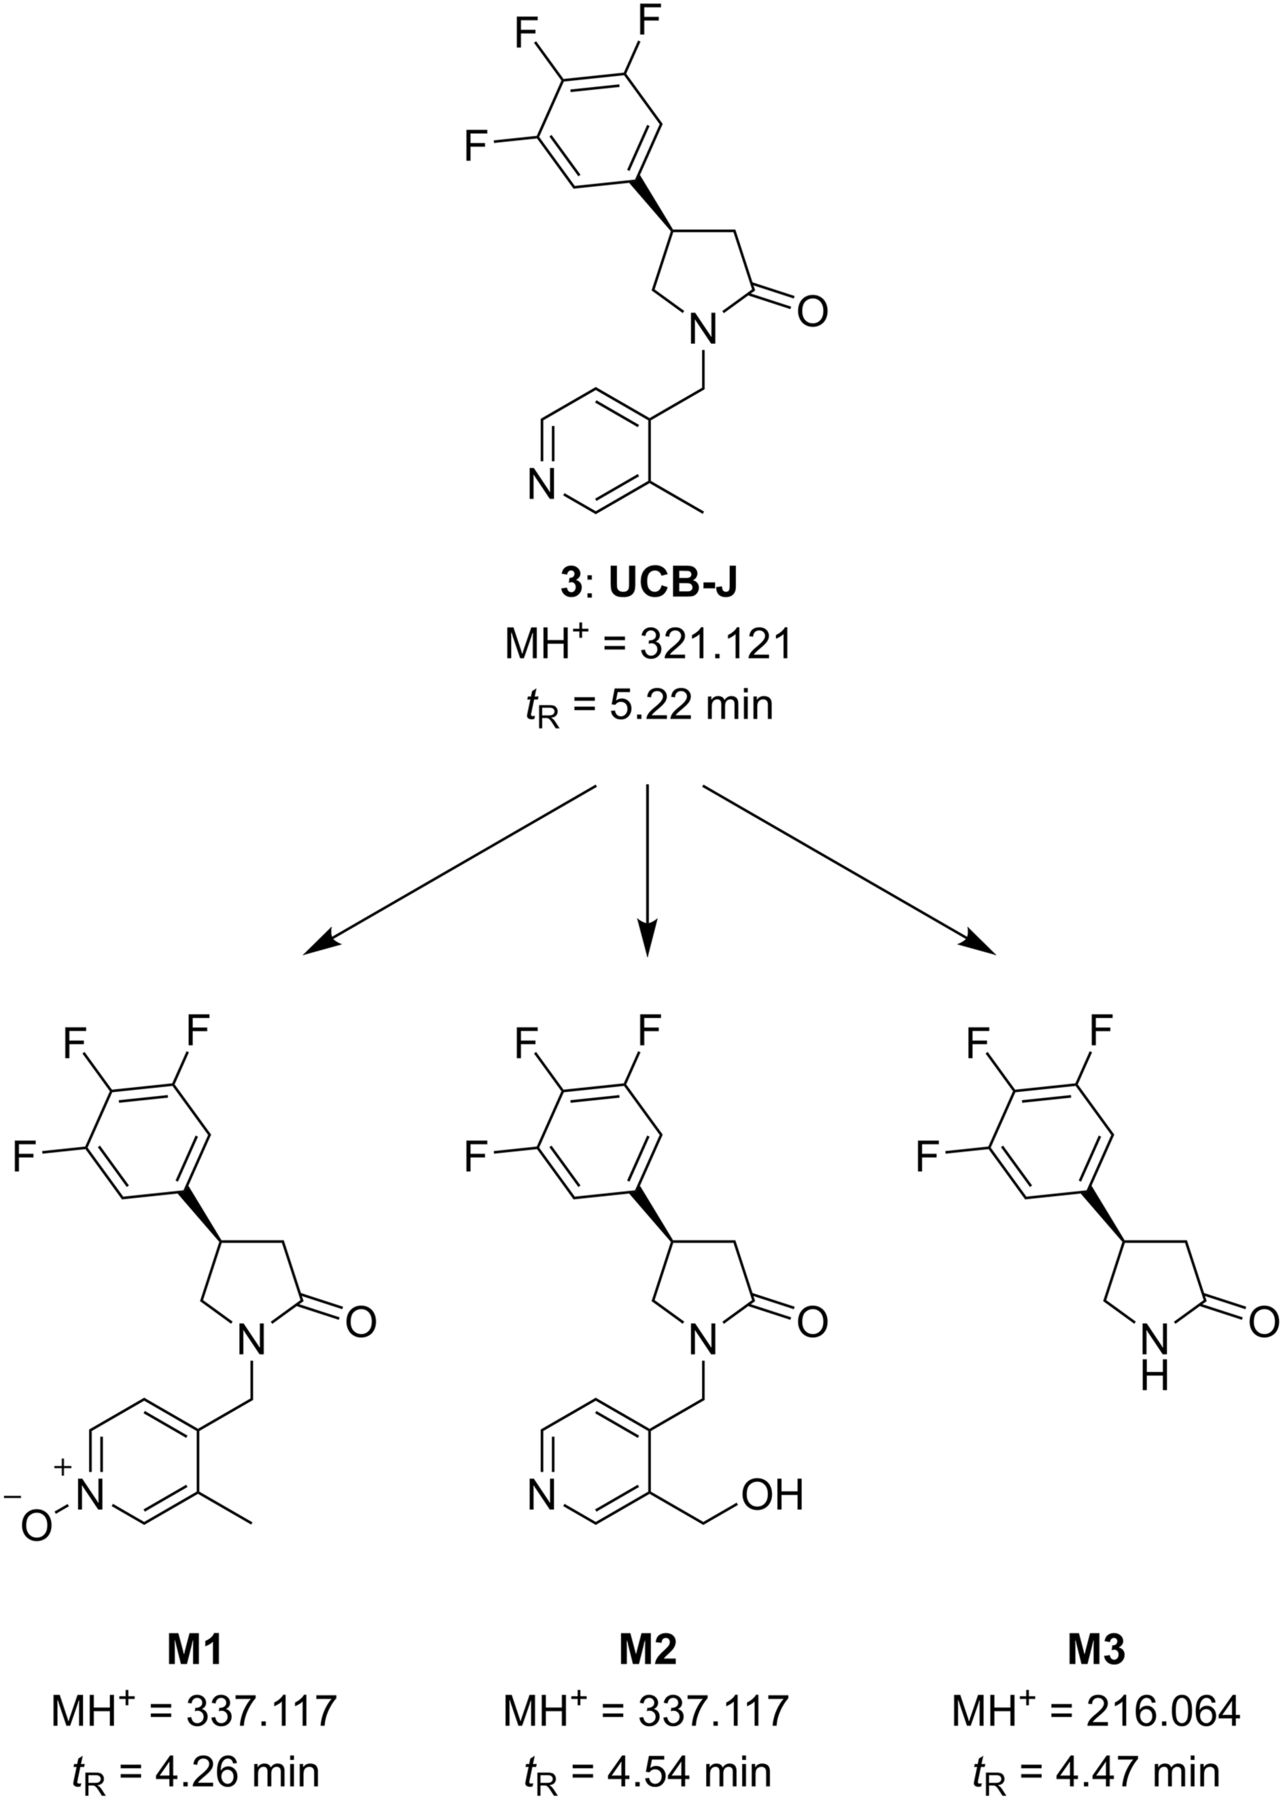
Representative PET images of 11C-UCB-J are shown in Figure 4. At baseline, high uptake was seen throughout the gray matter, consistent with the ubiquitous distribution of SV2A in the brain (Fig. 4A). Blockade of 11C-UCB-J binding by levetiracetam (Fig. 4B) and coinjected UCB-J (Fig. 4C) was evident in the images, as indicated by decreased activity levels.

Representative SUV images summed from 30 to 45 min after 11C-UCB-J injections: baseline (A), after pretreatment with levetiracetam (10 mg/kg) (B), and after coinjection with unlabeled UCB-J (150 μg/kg) (C).
Regional time–activity curves are presented in Figure 5. In the monkey brain 11C-UCB-J displayed a high uptake and rapid kinetics, with an SUVpeak of 5–8 in gray matter areas and peak uptake times ranging from 10 to 50 min (Fig. 5A). When the animal was pretreated with 10 mg/kg of levetiracetam, activity concentrations in brain regions peaked earlier and cleared faster (Fig. 5B), demonstrating substantial blockade of 11C-UCB-J binding by the drug.

Time–activity curves in selected brain regions from 11C-UCB-J baseline (A) and blocking (B) scans after pretreatment with levetiracetam (10 mg/kg).
The 1T model produced reliable VT estimates (low SE) with suitable fits. Multilinear analysis produced good fits with small differences in VT values from 1T (supplemental materials). Overall, the 2-tissue model produced VT estimates with high SE. Thus, the 1T model was the chosen method for analysis.
Regional VT values are listed in Table 4. The highest values are in the cortical areas; moderate in the caudate, putamen, and thalamus; and lower in other regions. Significant reduction in regional VT was seen with the administration of levetiracetam (10 and 30 mg/kg). In the self-blocking scans with UCB-J, a clear dose-dependent reduction in regional VT was observed, as depicted in Figure 6. Receptor occupancy calculated from the occupancy plots was 59% and 89% for the 10 and 30 mg/kg doses of levetiracetam, respectively. Occupancies of 46%, 68%, and 87% were found with self-blocking doses of 17, 50, and 150 μg/kg UCB-J.
Regional Binding Parameters for 11C-UCB-J at Baseline and After Preblocking with Levetiracetam

Bar graph representation of 11C-UCB-J self-blocking scans after coadministration of UCB-J (17, 50, and 150 μg/kg).
Determination of In Vivo Kd and Bmax
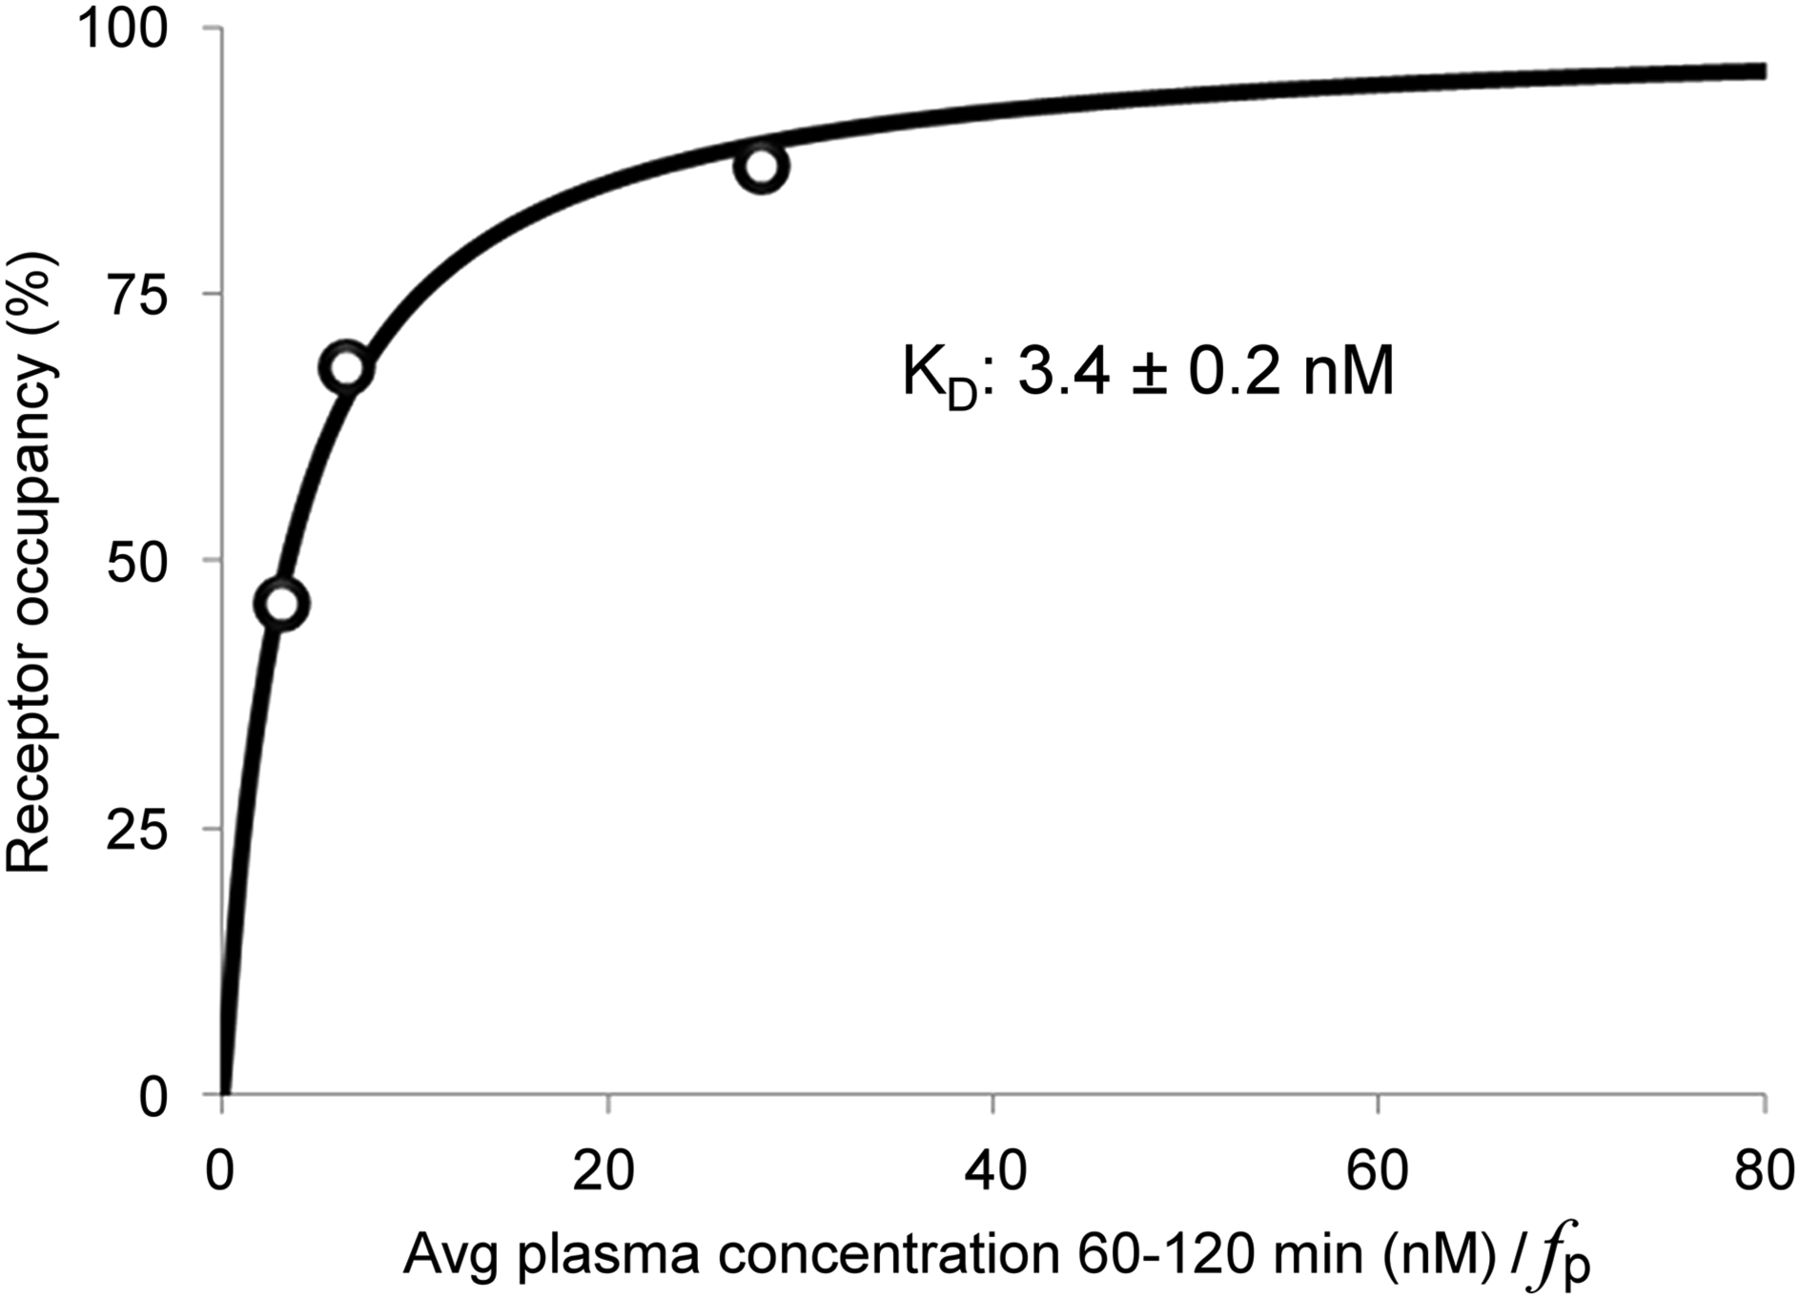
Estimates of Kd and Bmax were determined from baseline VT and receptor occupancy data from the self-blocking experiments. Figure 7 depicts the Kd estimation by fitting the receptor occupancy (RO) measurements as a function of free tracer concentration in plasma (CPF), computed as the average metabolite-corrected plasma values from 60 to 120 min, multiplied by fp, as follows: The estimated value of Kd was 3.4 ± 0.2 nM. To determine Bmax, the nondisplaceable distribution volume (VND) was first estimated from the x-intercept of the occupancy plots from 6 blocking scans (3 with levetiracetam and 3 with UCB-J) and determined to be 6.27 ± 0.60 mL/cm3. Then, Bmax (nM) was computed as
 Estimates of Bmax and Kd values are included in Table 4.

In vivo Kd estimate for UCB-J from 1T VT values. Avg = average.
Dosimetry
Visual evaluation of dosimetry scans detected early uptake in the liver and brain. Mid-scan uptake occurred in the kidneys and urinary bladder, with radioactivity remaining in the brain and liver. At the end of the scan, radioactivity was seen in the urinary bladder and gallbladder, with less remaining in the kidney and liver. Absorbed doses derived from the 70-kg reference male and 55-kg adult female phantoms are shown in Table 5. The liver is the dose-limiting organ, with a single-study dose limit of 2,500 MBq (68 mCi) for a male, whereas the brain is the dose-limiting organ for the female, with a single-study dose limit of approximately 2,750 MBq (75 mCi).
Mean Organ Radiation Dose (mGy/MBq) Estimates from 11C-UCB-J in 70-Kilogram Adult Male and 55-Kilogram Female Phantoms
DISCUSSION
In this report, we describe the synthesis and evaluation of a novel radiotracer for SV2A. Radiosynthesis of 11C-UCB-J involved the Suzuki–Miyaura cross-coupling of the 3-pyridyl trifluoroborate precursor with 11C-CH3I, which produced 11C-UCB-J in good yield and high chemical/radiochemical purity. To the best of our knowledge, this is the first report for the use of trifluoroborate in 11C radiolabeling. This is also the second report for the successful use of 1 mg of precursor in the cross-coupling reaction, rather than 2 mg or more, which is usually used. The 3-pyridyl boronic acid precursor also underwent efficient C-11C-methylation to give 11C-UCB-J. However, the protodeborylated product, which possesses affinity appreciable to SV2A (pKi = 8.0 ± 0.1) was always detected in the final product when the boronic acid precursor was used, but not present with the use of the trifluoroborate precursor. It is unclear whether this deborylated product is formed as a side reaction during the radiolabeling of the boronic acid precursor, which is known to occur particularly with electron-rich boronic acids (26), or by decomposition of the boronic acid precursor during work-up. Both base- and metal-catalyzed deboronation of boronic acids may occur under typical Suzuki–Miyaura cross-coupling reaction conditions (27,28).
Evaluation in rhesus monkeys showed that 11C-UCB-J displays excellent pharmacokinetic and imaging characteristics: brain uptake is high, with an SUVpeak of 5–8 in gray matter regions, leading to high-quality PET images; tissue kinetics are appropriate for an 11C tracer; fp is high, and thus can be reliably measured; time–activity curves are well fitted by the 1T model to produce stable measures of regional VT; and saturable and specific binding for SV2A is demonstrated by dose-dependent blockade with levetiracetam and unlabeled UCB-J.
As expected from the ubiquitous expression of SV2A in the brain, binding of 11C-UCB-J was seen in all gray matter areas, with high VT in cortical areas and lower in other regions. The lowest VT was found in the centrum semiovale (white matter), consistent with ex vivo autoradiography findings in the spinal cord (29). Therefore, we evaluated the potential utility of white matter as a reference region by analysis of the 4 scans from the self-blocking (in vivo Kd) study. Because of the high gray/white contrast, partial-volume correction was performed (supplemental materials). The corrected white matter VT values showed a minimal effect of unlabeled UCB-J and were in the range of 6–7 mL⋅cm−3, which is in excellent agreement with the VND value determined from the occupancy plots (6.3 ± 0.6 mL⋅cm−3). These results support the lack of specific SV2A binding in white matter. Thus, white matter may serve as a suitable reference region in kinetic analysis, without the need for arterial input function measurement.
The measured in vivo Kd value of 11C-UCB-J in this study (3.4 ± 0.2 nM) is in good agreement with the reported in vitro inhibition constant (Ki) value of 6.3 nM for human SV2A (11). Furthermore, the estimated regional density (Bmax) for neuronal SV2A protein in this study is 125–350 nM, which also is in close agreement with the reported regional Bmax values in the human brain measured in vitro (5).
In preparation for the use of 11C-UCB-J in humans, we performed whole-body distribution studies in rhesus monkeys to calculate organ radiation dosimetry. The organs receiving the largest dose were the liver for males (0.0199 mGy/MBq or 0.0735 rad/mCi) and the brain for females (0.0181 mGy/MBq or 0.0671 rad/mCi). The estimated effective dose equivalent (EDE) value of approximately 4.5 μSv/MBq for 11C-UCB-J EDE is in the lower range of EDE values (3.3–17.4 μSv/MBq) reported in a recent review of organ dosimetry for 11C-labeled radiotracer (30). Therefore, the maximum EDE from a single 740 MBq (20 mCi) administration of 11C-UCB-J is equivalent to 3.4 mSv (0.34 rem). Thus, multiple injections can be performed in healthy subjects per year.
In addition to studies with 11C-UCB-J, we also briefly evaluated 18F-UCB-H (15) in nonhuman primates to assess which tracer has higher specific binding (BPND); we compared their VT values at baseline in nonhuman primates, using a recently developed graphical method (31). Results indicated that 11C-UCB-J has higher BPND than 18F-UCB-H (supplemental materials).
CONCLUSION
We have described the synthesis and preclinical evaluation of the novel SV2A tracer 11C-UCB-J and demonstrated its suitability as a PET tracer for quantifying SV2A protein in nonhuman primates. 11C-UCB-J displayed high regional specific binding signals in rhesus monkeys and a favorable metabolic profile with suitable brain uptake kinetics. Clinical evaluation of 11C-UCB-J is currently under way.
DISCLOSURE
The costs of publication of this article were defrayed in part by the payment of page charges. Therefore, and solely to indicate this fact, this article is hereby marked “advertisement” in accordance with 18 USC section 1734. Research support was provided by UCB Biopharma. At the time this work was conducted, Joël Mercier, Stephane Carré, Marie-Christine Vandergeten, Anand Deo, Nathalie Price, Martyn Wood, Florian Montel, Marc Laruelle, and Jonas Hannestad were employees of UCB Biopharma. No other potential conflict of interest relevant to this article was reported.
Acknowledgments
We thank the staff of the Yale PET Center for their expert assistance.
Footnotes
↵* Contributed equally to this work.
Published online Feb. 4, 2016.
- © 2016 by the Society of Nuclear Medicine and Molecular Imaging, Inc.
REFERENCES
- Received for publication October 13, 2015.
- Accepted for publication December 25, 2015.


Jump to section
Related Articles
Cited By...
- Mechanisms Underlying Allosteric Modulation of Antiseizure Medication Binding to Synaptic Vesicle Protein 2A (SV2A)
- Imaging Synaptic Density in Aging and Alzheimer Disease with [18F]SynVesT-1
- Network-based Molecular Constraints on in vivo Synaptic Density Alterations in Schizophrenia
- Single-dose rapamycin increases brain glucose metabolism but reduces synaptic density in Long-Evans rats: A PET imaging study
- Imaging synaptic density in ageing and Alzheimers Disease with [18F]-SynVesT-1
- Assessment of the relationship between synaptic density and metabotropic glutamate receptors in early Alzheimers disease: a multi-tracer PET study
- Preclinical validation and kinetic modelling of the SV2A PET ligand [18F]UCB-J in mice
- An In Vivo High-Resolution Human Brain Atlas of Synaptic Density
- Repetitive mild closed-head injury induced synapse loss and increased local BOLD-fMRI signal homogeneity
- Uncovering the link between synaptic density and mental illness through in vivo imaging
- Kinetic models for PET displacement studies
- Synaptic Vesicle Glycoprotein 2A Is Affected in the Central Nervous System of Mice with Huntington Disease and in the Brain of a Human with Huntington Disease Postmortem
- Imaging of Synaptic Density in Neurodegenerative Disorders
- Erbb4 deletion from fast-spiking interneurons causes psychosis-relevant neuroimaging phenotypes
- Synaptic loss in behavioural variant frontotemporal dementia revealed by [11C]UCB-J PET
- Synaptic density and neuronal metabolic function measured by PET in the unilateral 6-OHDA rat model of Parkinsons disease
- A metabolically stable PET tracer for imaging synaptic vesicle protein 2A: Synthesis and preclinical characterization of [18F]SDM-16
- First-in-Human Evaluation of 18F-SynVesT-1, a Radioligand for PET Imaging of Synaptic Vesicle Glycoprotein 2A
- Simplified Quantification of 11C-UCB-J PET Evaluated in a Large Human Cohort
- In vivo synaptic density loss is related to tau deposition in amnestic mild cognitive impairment
- Characterization of 3 PET Tracers for Quantification of Mitochondrial and Synaptic Function in Healthy Human Brain: 18F-BCPP-EF, 11C-SA-4503, and 11C-UCB-J
- In Vivo Synaptic Density Imaging with 11C-UCB-J Detects Treatment Effects of Saracatinib in a Mouse Model of Alzheimer Disease
- Evaluation of 11C-LSN3172176 as a Novel PET Tracer for Imaging M1 Muscarinic Acetylcholine Receptors in Nonhuman Primates
- Evaluation of PET Brain Radioligands for Imaging Pancreatic {beta}-Cell Mass: Potential Utility of 11C-(+)-PHNO
- Imaging Synaptic Density: A Different Look at Neurologic Diseases
- Imaging synaptic density in the living human brain