


Abstract
18F-FDG PET/CT has shown increased accuracy, compared with morphologic imaging, in differentiating malignant peripheral nerve sheath tumors (MPNSTs) from benign neurofibromas (BNFs) in patients with neurofibromatosis type 1 (NF1). Delayed 18F-FDG PET imaging typically enhances malignant tumor to background. Our goal was to compare the effectiveness of early (1-h) and delayed (4-h) 18F-FDG PET/CT imaging in differentiating MPNSTs from BNFs in patients with NF1, with and without liver activity normalization. Methods: NF1 patients presenting new symptoms or enlarging lesions were clinically evaluated with early and delayed 18F-FDG PET/CT imaging. SULmax (maximum standardized uptake value derived for lean body) and SULmax/liver (lesion uptake adjusted to mean liver activity) were obtained for all sites identified with abnormal metabolic activity. Qualitative and quantitative evaluations, including receiver-operating-characteristic (ROC) comparison of early and delayed imaging sessions, were performed. Histopathology and clinical follow-up (1–9 y) were considered as a gold standard. Results: Forty-one NF1 patients with early and delayed 18F-FDG PET/CT scans were identified, and 93 lesions were retrospectively analyzed, representing 24 MPNSTs (all histologically confirmed) and 69 BNFs (26 histologically confirmed). Qualitative evaluation on early imaging showed sensitivity, specificity, positive predictive value, and negative predictive value for separating MPNSTs from BNFs of 91%, 84%, 67%, and 96% versus 91%, 81%, 63%, and 96%, respectively, on 4-h delayed imaging. The mean SULmax was significantly higher for MPNSTs than BNFs on both early scans (6.5 vs. 2.0, P < 0.01) and delayed imaging (8.3 vs. 2.3, P < 0.02). However, SULmax overlap between benign and malignant lesions persisted even after normalization to mean liver activity. ROC-derived best SULmax cutoffs were 3.2 on early (area under the curve, 0.973) and 4.1 on delayed scans (area under the curve, 0.978). ROC analysis for SULmax/liver improved test specificity (94% vs. 87%, P < 0.05) on early and (93% vs. 88%, P < 0.05) on delayed imaging. Conclusion: Qualitative interpretation of 18F-FDG PET/CT discriminates MPNSTs from BNFs in NF1 patients with similar accuracy on both early and delayed imaging. Quantitative data showed better sensitivity on delayed acquisition and best test specificity with lesion SULmax normalization to liver activity, more so than with delayed imaging at 4 h.
Neurofibromatosis type 1 (NF1) is one of the most common autosomal-dominant Mendelian diseases, with a worldwide estimated prevalence of 1 in 3,000 (1). The NF1 gene (cr17q11.2) codes a protein called neurofibromin, which is part of the p21-ras oncogene family (2). Clinical features in patients with NF1 typically include café-au-lait spots, cutaneous and plexiform neurofibromas (benign neurofibromas [BNFs]), optic glioma, Lisch nodules, and bone dysplasia (3). Individuals with plexiform neurofibromas harbor an increased risk of transformation into malignant peripheral nerve sheath tumors (MPNSTs), with a relative lifetime risk of 8%–13% (4,5).
Although of profound prognostic and therapeutic consequences, distinguishing between benign and malignant lesions proves to be difficult. Both benign and malignant lesions (especially in a synchronous context) have similar clinical manifestations such as changes in consistency or size, unremitting pain, or new neurologic findings (6). Morphologic imaging cannot reliably differentiate benign from malignant transformed lesions, especially in tumors with significant heterogeneity (7). Accurate histologic evaluation is often challenging due to tumor sampling error, leading to extensive and possibly repeated surgical interventions (8,9).
18F-FDG PET/CT metabolic imaging has been shown to be able to detect soft-tissue sarcomas, with positive correlation between tumor intensity uptake and histologic grade (10). However, when standard qualitative and quantitative 18F-FDG PET was applied in NF1, mixed success was noticed because of both false-negative (FN) and false-positive (FP) identification of MPNST (11–14). Modifications to PET acquisition and postimaging analysis have been attempted to improve test performance (Table 1), particularly by adding delayed PET imaging to the acquisition protocol and by normalizing lesion standardized uptake value (SUV) to normal tissue activity (11,14,15). The rationale for dual-time PET imaging is that the activity within benign lesions reportedly typically plateaus after 30 min whereas malignant tumors have rising SUVs over approximately 4 h, allowing for a better separation (16). However, this approach has residual FP and FN rates, it is resource-intensive, and it exposes the patients to additional radiation from CT.
Qualitative and Quantitative Performance of 18F-FDG PET in NF1
Qualitative PET evaluation in patients with NF1 has demonstrated overall good sensitivity (89%–100%) and specificity (72%–95%) in differentiating BNF from MPNSTs (17–19), although an explicit set of criteria for accurate visual interpretation has never been validated. Quantitatively, several SUV cutoffs have been proposed to best detect and separate malignant from benign lesions in NF1 patients (Table 1). The wide range for these quantitative uptake thresholds (1.5–6.1) may be due to differences in acquisition protocols (different imaging time points, partial-volume effects), scanner performance, and analysis methods (16,20). Such variability limits the use of 18F-FDG PET in clinical practice.
At Johns Hopkins University, our practice has been to acquire whole-body early (1-h after injection) and delayed (4-h from injection) imaging when possible for all NF1 patients. In this study, we assess the utility of visual and quantitative criteria derived from early and delayed whole-body 18F-FDG PET/CT scans to discriminate BNFs from MPNSTs.
MATERIALS AND METHODS
Patient Population
This retrospective study of clinically acquired PET scans was approved by the institutional review board committee. The radiology database was queried with the key words “NF1, neurofibromatosis or neurofibroma” from January 2003 until August 2013. Forty-one NF1 patients were identified with early (1-h) and delayed (4-h) PET scans and appropriate clinical data (Fig. 1). Seventy-four early and delayed PET sessions were evaluated, representing 41 baseline and 33 follow-up studies (18 patients with 1 follow-up, 6 with 2, and 1 with 3) with 93 lesions (24 MPNSTs and 69 BNFs) included (Table 2).

Flow diagram showing process of patients’ identification.
Patient, PET/CT Scan, and Lesion Characteristics
18F-FDG PET/CT Acquisition
After at least a 4-h fast, the patients received an intravenous injection of 18F-FDG according to a weight-based formula (for adults, 1.3 × 7.4 MBq/kg, and for children, 7.4 MBq/kg), with mean injected activity of 566.1 ± 181.3 MBq (range, 111–925 MBq). All 18F-FDG PET/CT scans were acquired with a vertex-to-toes protocol and were obtained on a Discovery Rx-VCT (GE Healthcare) lutetium oxyorthosilicate crystal, 64-slice scanner in 3-dimensional acquisition mode and 4.15 min per bed position. Reconstruction was performed using an ordered-subset expectation maximization algorithm, with a 128 × 128 matrix, 21 subsets, 2 iterations, 3-mm postreconstruction gaussian filter, standard Z filter, 4.7-mm pixels, and 3.27-mm slice thickness. PET data were reconstructed with and without CT-based attenuation correction and decay-corrected.
The mean baseline serum glucose was 93.1 mg/dL (±13.1) with mean uptake time of 65.3 min (±10.8) for the early and 248.3 min (±22.3) for the delayed scans.
Qualitative Lesion Identification and Evaluation
Early 18F-FDG PET/CT scans were evaluated by 1 board-certified nuclear medicine physician with 18 mo of additional clinical PET/CT fellowship training. Sites of abnormally increased metabolic activity were qualitatively dichotomized as either suspected malignant or benign. Interpretation criteria for malignant lesions were as follows:• Intensity rule = sites of abnormal metabolic activity associated with morphologic lesions and demonstrating significantly more intense 18F-FDG uptake relative to liver activity.
• Anatomic rule = sites of metabolic activity, satisfying the intensity rule, without obvious morphologic correlation, which were identified at concerning locations (musculature, nerve root/plexus) or appeared asymmetric, compared with the contralateral side.
All other sites of abnormal metabolic activity (with or without morphologic correlation) that did not satisfy the previously explained qualitative rules were interpreted as benign lesions.
The qualitative evaluation for the delayed scans was performed independently from the early qualitative analysis so that all the lesions could again be dichotomized as benign or suspected malignant.
Lesion Inclusion Criteria
On baseline early and delayed 18F-FDG PET/CT scans, lesions accepted for analysis were as follows: all sites fulfilling the qualitative criteria for a suspected malignant lesion; all additional sites with clinical or prior imaging suspicion for malignancy; and up to 5 lesions per scan, which were qualitatively evaluated as benign lesions (if >5 benign lesions were identified, the most 18F-FDG–avid or qualitatively concerning lesions were included).
Additionally included on the follow-up (7–29 mo) early and delayed PET/CT scans were new or increasingly suspicious lesions on follow-up clinical/morphologic examination and new sites of metabolic activity satisfying the qualitative criteria for suspected malignant lesions.
The duplicate lesions from the initial scan that were not of clinical/imaging concern and that appeared stable on follow-up PET/CT scans were not included in the analysis.
Quantitative Analysis
SUVs for lean body mass (SULmax) were measured on an Advanced Workstation (software 4.6; GE Healthcare) by placing a volume of interest on the axial PET images with CT cross-reference to ensure correct lesion localization. We tried to minimize differences in measuring lesion activity by starting with a predefined volume of interest. When necessary, manual adjustments were applied to accommodate lesions’ extensions and to avoid potentially contaminating intense activity within adjacent normal tissue. The SULmax represented lesion highest SUL and was measured on both the early and the delayed scans at the equivalent image level (20).
Mean liver uptake (calculated for each PET session) represented the average activity within a 30-mm spheric volume of interest placed in the right middle lobe of the liver. Normalization of lesion SULmax was performed to the corresponding PET session liver activity (lesion SULmax/liver SULmean [lesion uptake adjusted to mean liver activity]).
Statistical Analysis
Histopathology from biopsy or surgery and clinical follow-up (median, 3 y; range, 1–9 y) obtained from the pathology department and chart review was regarded as the gold standard. Sensitivity, specificity, positive predictive value, and negative predictive value were calculated using standard formulae. Descriptive statistics for lesion SULmax were performed using the SPSS software package (version 20.0; IBM).
Nonparametric Mann–Whitney–Wilcoxon tests as well as receiver-operating-characteristic (ROC) curves were applied for comparative analyses, with a significance level of 0.05.
RESULTS
Early and Delayed PET/CT Scans
Qualitative Analysis
There were 93 sites identified with abnormal metabolic activity, of which 89 were recorded from the 41 baseline and 4 from follow-up scans (Table 2).
Qualitative evaluation of the early imaging reported 60 sites as benign lesions and 33 as suspected malignant. Subsequent analysis of delayed 18F-FDG PET/CTs showed 58 benign and 35 suspected malignant; hence, 2 of 60 benign interpretations from early evaluation were interpreted as suspected malignant on late evaluation. Final histopathology and clinical follow-up revealed 69 BNFs and 24 MPNSTs, with surgical excision or biopsy available for 26 of BNF and 24 MPNST. We acknowledge that histopathology data are not available for all benign lesions because patients are not routinely referred for surgery if indices suggest a benign lesion. However, all patients were carefully evaluated, and none of the lesions showed changes compatible with malignant transformation during clinical or imaging follow-up (median, 3 y; range, 1–9 y).
The correlation with pathology and clinical follow-up revealed 11 FP and 2 FN interpretations on early 18F-FDG PET/CTs and 13 FPs and 2 FNs on delayed scans. The 2 discordant sites between early and delayed imaging proved to be FP interpretations on the delayed evaluation.
The sensitivity, specificity, positive predictive value, and negative predictive value for detection of MPNST versus BNF on early images were 91% (95% confidence interval [CI], 73–99), 84% (95% CI, 73–92), 67% (95% CI, 48–82), and 96% (95% CI, 88–99), respectively. On delayed images, the sensitivity and negative predictive value were similar, with a slightly decreased specificity of 81% (95% CI, 70–90) and positive predictive value of 63% (95% CI, 45–79).
Quantitative Analysis
The average early SULmax for the lesions identified on histology or follow-up as BNF was 2.0 (±0.9), and for those confirmed as malignant it was 6.5 (±2.9). On the delayed imaging, the average BNF SULmax was 2.3 (±1.2), and average MPNST SULmax was 8.3 (±3.8). Nonparametric Mann–Whitney U tests comparing the distribution and ranking of the SULmax showed a statistically significant difference between BNF versus MPNST on both early (P < 0.01) and delayed (P < 0.02) PET scans.
However, no statistical difference was noticed between the early and delayed SULmax for either BNFs (Z of −1.13, P = 0.26) or MPNSTs (Z of −1.8, P = 0.07). Whisker plots of SULmax for benign and malignant lesions from both the early and the delayed imaging are displayed in Figure 2.

Whisker plots (median value with first and third quartiles) for BNF and MPNST SULmax on early and delayed PET imaging. (A) Unadjusted. (B) Liver activity–adjusted SULmax.
The mean value of BNF SULmax change (delayed scans minus early scans) was 0.3 (±0.7), with a mean increase of 14% (range, −41% to +110%). For MPNST lesions, the average SULmax change was 1.9 (±1.2) corresponding to a mean 30% increase (range, −6% to +70%). There was statistical significance for both absolute and percentage change between the SULmax of BNF and MPNST (P < 0.05).
When the BNF SULmax were adjusted to liver activity (lesion SULmax/liver SULmean), the mean absolute change became 0.7 (±0.7), and the mean percentage change was 46% (±38). The mean liver-adjusted MPNST SULmax absolute change was 3.0 (±1.6), and the mean percentage change was 61% (±37). Statistical significance was reached only for absolute change (P < 0.05) but not for the percentage increase (P > 0.09) between the liver-adjusted SULmax for BNF and MPNST.
Histograms of absolute SULmax change in BNF and MPNST lesions between delayed and early images are presented in Figure 3.

Waterfall plots showing absolute differences between early and delayed SULmax of BNFs (green bars) and MPNSTs (red bars) representing raw data (A) and liver-adjusted data (B). Upward shift in all ΔSUL can be noticed with liver normalization, although significant overlap between ΔSUL for BNFs and MPNSTs persists.
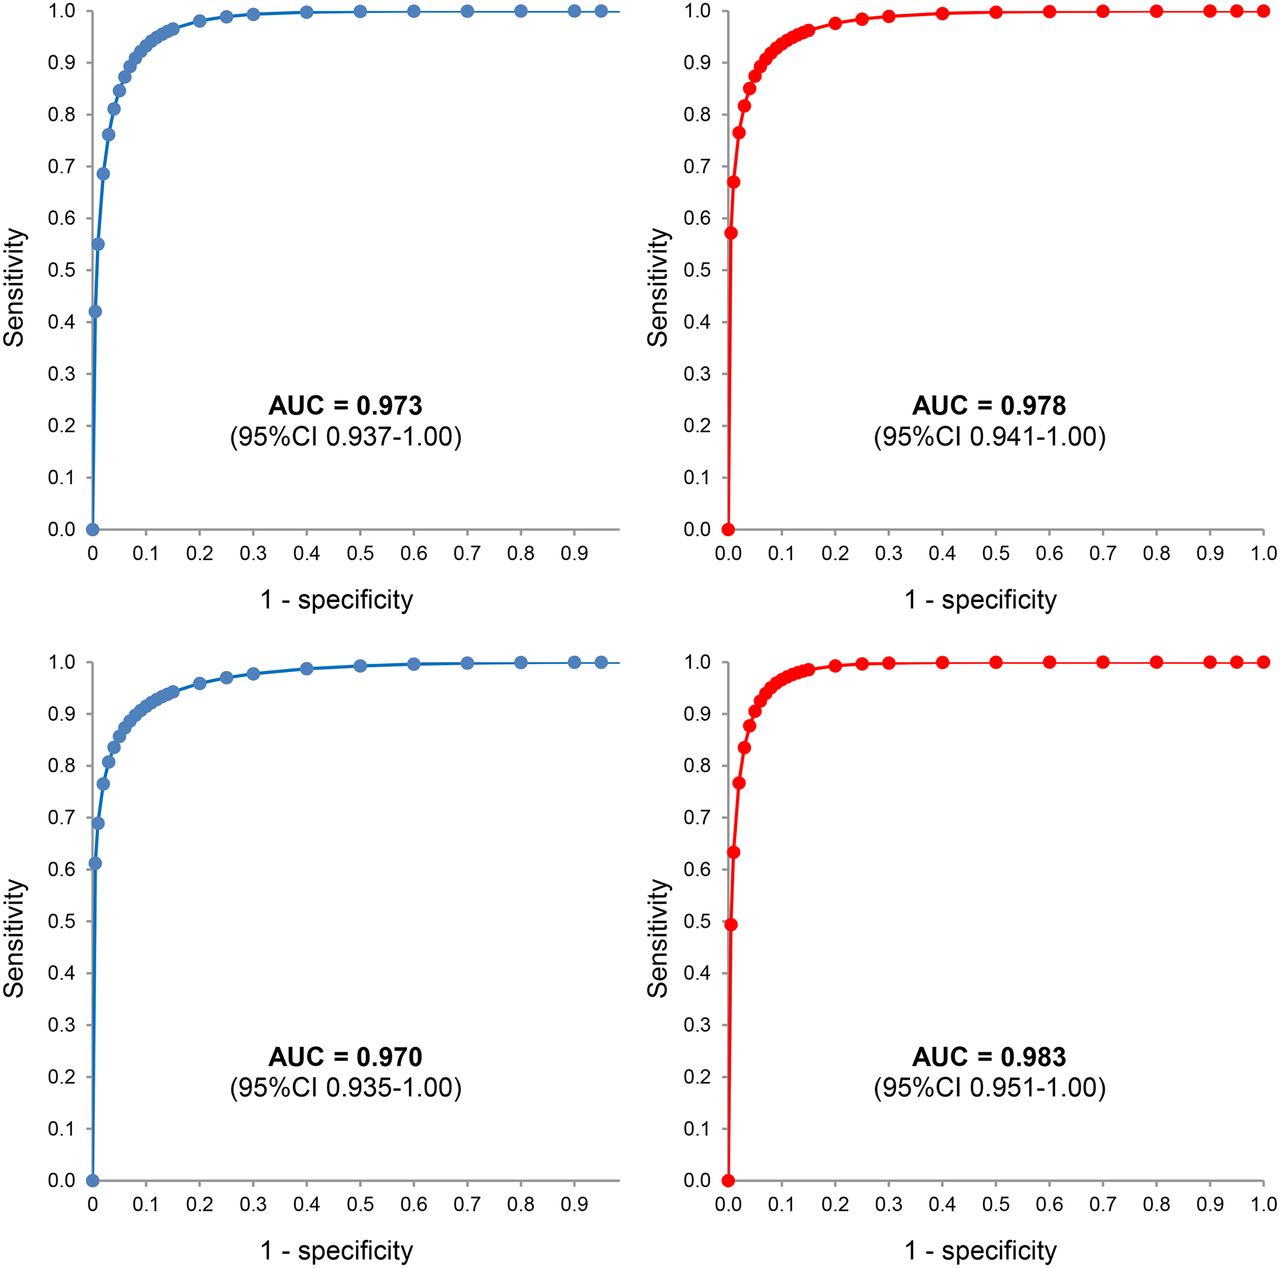
ROC analysis of lesion SULmax for the early PET/CT scans revealed an area under the curve (AUC) of 0.973 (95% CI, 0.937–1.00, P < 0.05), best SULmax cutoff of 3.2 (for 92% sensitivity and 87% specificity), and maximal sensitivity threshold of 2.5 (77% specificity). For the delayed imaging, the AUC was 0.978 (95% CI, 0.947–1.00, P < 0.05), with a best cutoff of 4.1 (96% sensitivity and 88% specificity) and a 100% sensitivity threshold of 3.3 (81% specificity) (Fig. 4).

ROC diagrams for early (blue curves) and delayed (red curves) scans for unadjusted (top) and liver activity–adjusted (bottom) lesion SULmax.
When lesion SULmax were normalized to liver activity, the AUC for early ROC evaluation was 0.970, with a best SULmax of 2.7 (92% sensitivity and 94% specificity), and delayed AUC was 0.983, with a best SULmax cutoff of 4.3 (96% sensitivity and 93% specificity). When lesion/liver uptake was examined for 100% sensitivity, the cutoffs were 1.5 (51% specificity) on early scans and 3.5 (87% specificity) on late scans.
ROC analysis for the absolute and percentage change of unadjusted lesion SULmax showed an AUC of 0.899 and 0.742, respectively. For liver-normalized absolute and percentage change, the AUC was 0.921 and 0.638, respectively.
DISCUSSION
18F-FDG PET has been reported to be a good, but imperfect, test for distinguishing benign from malignant tumors. Efforts to improve the diagnostic performance of the test have included serial acquisitions and quantitative analyses beyond simple qualitative assessments. Our retrospective study evaluated the added benefit of a late acquisition protocol and qualitative and quantitative interpretation of 18F-FDG PET imaging to differentiate MPNST from BNF in patients with NF1 (14).
Visual evaluation of metabolic activity within lesions was performed in the context of regional background/liver uptake, and it was adjusted toward the final radiologic interpretation according to the location and morphologic features from corresponding CT because this is consistent with clinical application of this technique. We achieved reasonable sensitivity and specificity (91% and 84%, respectively) for the early visual assessment (1 h), with similar sensitivity and slightly decreased specificity (80%) for the delayed visual evaluation (4 h). These results are consistent with prior reported performance values (11,12,14).
One intrinsic advantage of the qualitative approach is that no specific imaging process or patient information is required before attempting a successful interpretation. This method does not rely on lesion SUV measurement or fixed thresholding, which may vary substantially among scanners, reconstruction protocols, display/analysis software, and radiotracer uptake times (16,20). However, we observed that qualitative evaluation on delayed images did not improve PET diagnostic accuracy versus early images.
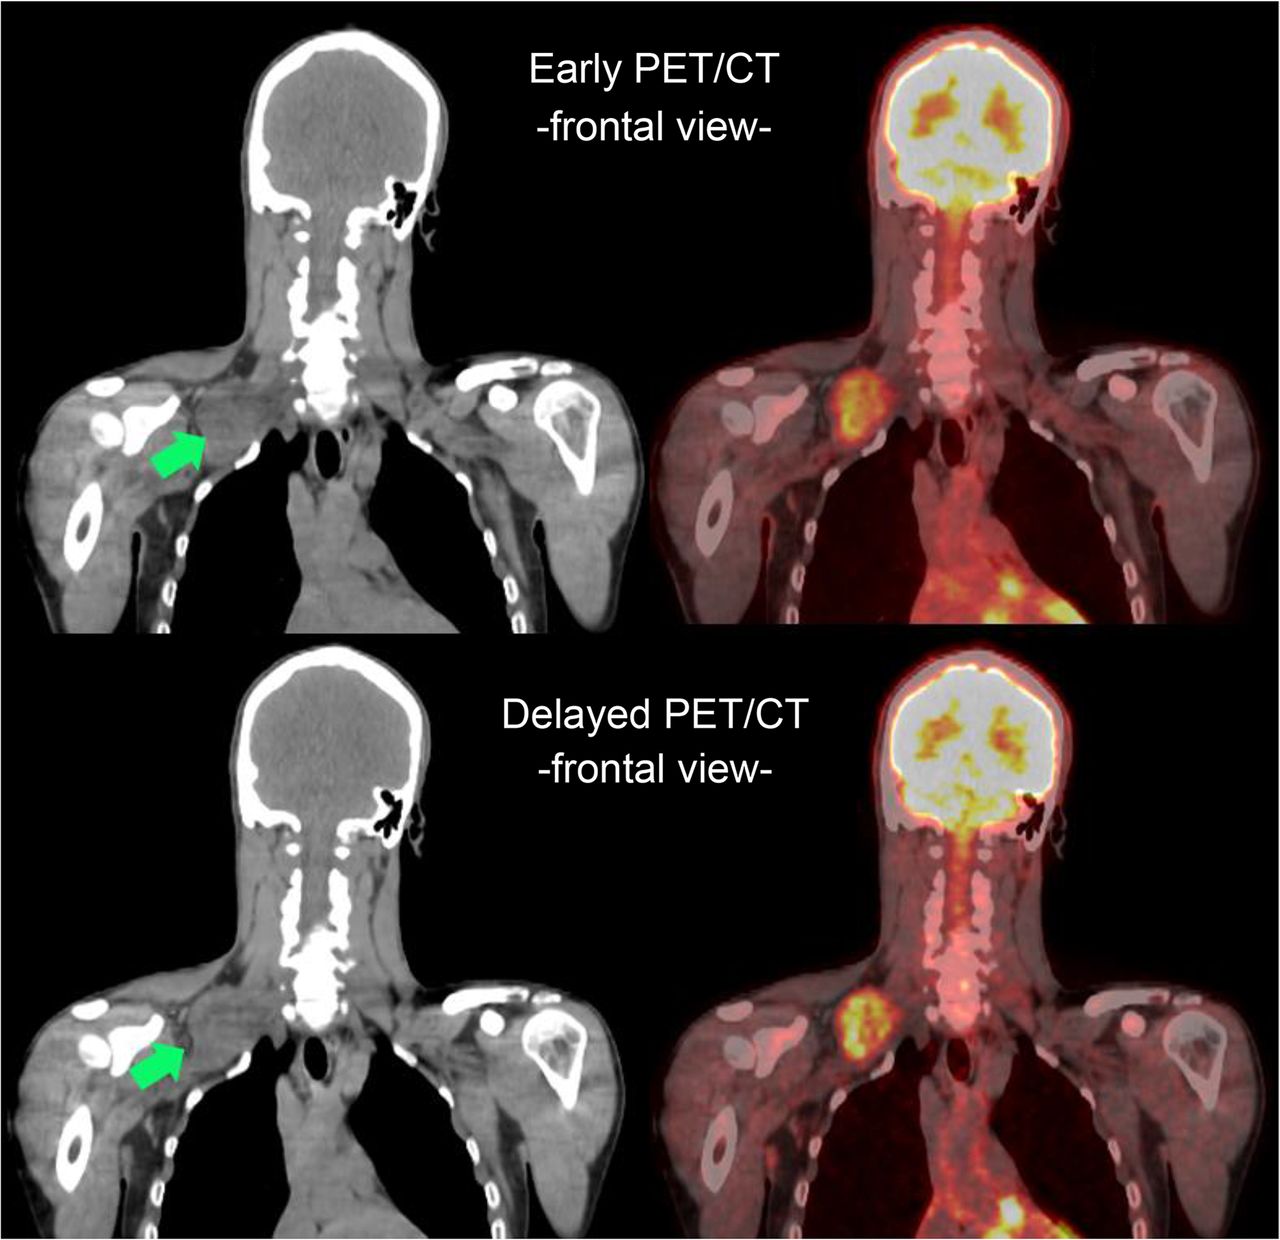
In fact, the slight drop in the performance of qualitative assessment on late imaging was driven by 2 FP interpretations, which were confirmed with histopathology (Fig. 5). The FP interpretation highlights a caveat of visual interpretation on delayed images: the increasing contrast between lesion 18F-FDG uptake and decreasing physiologic liver and soft-tissue background activity. Therefore, stable BNF metabolic activity can result in a more pronounced subjective interpretation, with wrong classification of benign lesions and hence decreased specificity. We acknowledge that a multiinterpreter qualitative analysis may yield results different from current single-interpreter evaluation, although strictly predefined qualitative interpretation criteria should limit the extent of divergent interpretation.

Early PET/CT imaging (upper) shows heterogeneously intense 18F-FDG uptake (early SULmax = 3.2) in brachial plexus lesion (green arrows), which demonstrates increased intensity (delayed SULmax = 5.0) on delayed PET/CT imaging (lower). Histology from surgical excision revealed benign plexiform neurofibroma and patient remained clinically asymptomatic on follow-up (>12 mo).
In the quantitative evaluation, we used the SULmax (derived from lean body mass) and not the more common maximum SUV (SUVmax; derived from patient weight) as a more reliable measure of tissue activity to account for variation of individual body habitus (20). There was a significant difference between mean SULmax for benign and malignant lesions on both early (P < 0.01) and delayed (P < 0.02) imaging, further supporting the hypothesis that PET can be used as an imaging discriminator for BNF and MPNST in NF1. The mean SULmax for BNFs and MPNSTs were 2.0 (±1.0) and 6.5 (±2.9) on the early PET and 2.3 (±1.2) and 8.3 (±3.8) on the delayed PET scans, respectively. Further work should evaluate lesion activity in the context of lesions’ size and deep versus superficial location.
Time-dependent analysis of benign lesion activity showed an unexpected pattern with increasing SULmax from early to delayed imaging for 59% (41/69) of all benign sites. In fact, the absolute measure was more than 1 unit in 8 cases (7 with pathologic correlate), and percentage ΔSULmax was above 30% in 16 BNF cases (12 with histologic proof). After normalization to liver activity, even more benign sites had interval-increased SULmax on delayed scans: 19 sites with absolute ΔSULmax/liver greater than 1 unit and 44 sites with percentage ΔSULmax/liver greater than 30%. It is important to note that prior studies have described a rather universal pattern of decreasing 18F-FDG uptake in benign NF1 lesions (14,21). This observation of increased SULmax on late imaging even in pathologically confirmed benign lesions challenges the hypothesis that late acquisition successfully overcomes the limitations in specificity of early 18F-FDG PET.
For the malignant sites, our analysis showed increasing 18F-FDG uptake from early to delayed scans in all but 1 lesion (percentage ΔSULmax, −6%), which was, in fact, identified on pathology as high-grade malignancy. Therefore, universal interpretation of decreasing/stable 18F-FDG uptake as BNF and increasing uptake as malignant could lead to FN and FP in quantitative PET evaluation (Fig. 6). Absolute and percentage change ROC analysis showed best performance in differentiating malignant versus benign for the absolute change liver-adjusted SULmax (AUC, 0.921). However, absolute and percentage change were inferior to test performance directly from raw or liver-adjusted BNF and MPNST SULmax (AUC, 0.970–0.983).

FN interpretation with quantitative evaluation. Early PET/CT imaging shows highly heterogeneous metabolic activity (early SULmax = 4.3) within pelvis (red arrowhead), which persists albeit with slightly decreased intensity (delayed SULmax = 3.7) on delayed imaging (red arrow). Initial fine-needle aspiration was inconclusive, and complete surgical excision showed MPNST. There are extensive bone deformities in this NF1 patient.
Computed best joint-operating cutoff points were 3.2 and 4.1 for early and delayed ROC curves, respectively. These are slightly higher than previously reported values (3.1 and 3.5, respectively) by Warbey et al. (22), even after accounting for different weight-based formulas used to compute SULmax and SUVmax (23). Nevertheless, review of the literature (Table 1) demonstrates a wide range of best SUVmax cut points (1.5–6.1), suggesting that an interinstitutional standardization is advisable before any multicenter cooperation.
Two recent studies have proposed that normalization of lesion 18F-FDG uptake to liver activity could improve PET performance in NF1 patients. Salamon et al. (15) reported increased test accuracy (100% sensitivity and 90% specificity) when a threshold of lesion/liver greater than 2.6 was used, whereas Combemale et al. (13) reported best results (97% sensitivity and 76% specificity) for a threshold of lesion/liver greater than 1.5.
When applied to our data, neither of these 2 normalized cutoff values appeared to improve 18F-FDG PET performance in discriminating BNF from malignant lesions: the first suggested threshold missed too many MPNSTs (90% sensitivity) whereas the second generated unnecessary surgical interventions (51% specificity). In our study, the best liver-normalized cutoff was 2.7 on early imaging (92% sensitivity and 94% specificity) and 4.3 on delayed imaging (96% sensitivity and 93% specificity). Similar to SUVmax cut points, lesion/liver thresholds will need to be selected and standardized at each institution and for each trial based on the emphasis desired on sensitivity versus specificity. The liver normalization has considerable potential advantages over the absolute determination of lesion activity, because determining relative values is easier than determining absolute radiotracer uptake.
In summary, we found in 41 NF1 patients with early and delayed acquisition of 18F-FDG PET and pathologic confirmation of diagnosis that for qualitative evaluation the addition of a delayed acquisition protocol did not substantially improve test accuracy in differentiating BNF versus MPNST. Further, direct comparison of lesion SULmax from early to delayed sessions was not helpful because of unpredictable and confounding increasing activity in more than 50% of BNF. ROC analysis did improve sensitivity over qualitative assessment, and liver normalization had an incremental benefit for test specificity. These effects were similar for both early and delayed acquisitions.
Our data suggest that there is not significant additive information from late acquisition to off-set the patient burden of extended periods of fasting, additional radiation exposure, or the institutional resource demands. On the basis of these results, we would suggest qualitative and quantitative assessment of 18F-FDG PET at 1 h, with the understanding that applying this single imaging strategy alone will yield rare FP and FN results and therefore require multidisciplinary collaboration for interpretation of the results in the setting of each clinical scenario. The calibration for liver activity thresholds and SUVmax cut points should be chosen on the basis of center-specific validated data and according to clinical priorities (i.e., sensitivity vs. specificity). Similarly, this means that if 18F-FDG PET is to be applied to multicenter clinical studies, intercenter calibrations and intracenter reliability are required before 18F-FDG PET could be used as an endpoint across sites and time points.
CONCLUSION
The qualitative interpretation of standard 18F-FDG PET images (at 60 min) provides good clinical utility for distinguishing BNF from MPNST (91% sensitivity and 84% specificity) in NF1 patients.
Quantitative data provided better sensitivity on delayed imaging, yet the highest specificity was achieved with lesion SULmax normalization to liver activity, more so than delayed acquisition.
Quantitation must be interpreted in the context of center-specific ROC analysis. Multiinstitutional standardization is advised for setting a meaningful best SUV/SUL cutoff for future therapeutic clinical trials in which 18F-FDG PET is used as an endpoint.
DISCLOSURE
The costs of publication of this article were defrayed in part by the payment of page charges. Therefore, and solely to indicate this fact, this article is hereby marked “advertisement” in accordance with 18 USC section 1734. No potential conflict of interest relevant to this article was reported.
Acknowledgments
We thank Julia Buchanan at Johns Hopkins for her helpful review and advice in the preparation of this manuscript.
Footnotes
Published online Feb. 5, 2015.
- © 2015 by the Society of Nuclear Medicine and Molecular Imaging, Inc.
REFERENCES
- Received for publication September 2, 2014.
- Accepted for publication November 21, 2014.


