


Abstract
Patients with secondary progressive multiple sclerosis (SPMS) are lacking efficient medication to slow down the progression of their disease. PET imaging holds promise as a method to study, at the molecular level and in vivo, the central nervous system pathology of SPMS. PET might thus help to elucidate potential therapeutic targets and be useful as an imaging biomarker in future treatment trials of progressive multiple sclerosis. The objective of this study was to evaluate whether translocator protein (TSPO) imaging could be used to visualize the diffuse inflammation located in the periplaque area and in the normal-appearing white matter (NAWM) in the brains of patients with SPMS. Methods: This was an imaging study using MR imaging and PET with 11C-PK11195 binding to TSPO, which is expressed in activated, but not in resting, microglia. Ten SPMS patients with a mean expanded disability status scale score of 6.3 (SD, 1.5) and eight age-matched healthy controls were studied. The imaging was performed using High-Resolution Research Tomograph PET and 1.5-T MR imaging scanners. Microglial activation was evaluated as the distribution volume ratio (DVR) of 11C-PK11195 from dynamic PET images. DVR estimations were performed with special interest in NAWM and gray matter using region-of-interest and parametric image–based approaches. Results: The DVR of 11C-PK11195 was significantly increased in the periventricular and total NAWM (P = 0.016 and P < 0.001, respectively) and in the thalamic ROIs (P = 0.027) of SPMS patients, compared with the control group. Similarly, parametric image analysis showed widespread increases of 11C-PK11195 in the white matter of SPMS patients, compared with healthy controls. Increased perilesional TSPO uptake was present in 57% of the chronic T1 lesions in MR imaging. Conclusion: The finding of increased 11C-PK11195 binding in the NAWM of SPMS patients is in line with the neuropathologic demonstration that activated microglial cells are the source of diffuse NAWM inflammation. Evaluating microglial activation with TSPO-binding PET ligands provides a unique tool to assess diffuse brain inflammation and perilesional activity in progressive multiple sclerosis in vivo.
Multiple sclerosis (MS) is a chronic demyelinating disease of the central nervous system (CNS), in which inflammation and neuronal damage inflict significant neurologic deficits on the affected individuals, who at the time of diagnosis are mostly young adults (1,2). In most cases, the disease is initially of the relapsing form (relapsing remitting MS), in which focal demyelination of the cerebral white matter (WM) represents the hallmark of the disease. With time, there is almost invariably progression into a secondary stage (secondary progressive MS [SPMS]), for which the clinical picture is of gradually increasing disability, which may or may not be superimposed with relapses (3). Neuropathology studies have been valuable in defining the various pathologic substrates of MS. The pathologic features consist of focal lesions, which can be detected both in the WM and in the gray matter (GM) and which vary in composition depending on the disease stage (4). The WM lesions in relapsing remitting MS are typically of the active-lesion type, and they are likely the pathologic correlate of clinical attacks (5). In SPMS, the plaques are mostly of the chronic active, slowly expanding (smoldering), or chronic inactive derivatives, with the classification depending on the presence and distribution of macrophages and activated microglial cells in the plaque edge (4). In SPMS, there is additionally diffuse inflammation and accumulating neurodegeneration throughout the WM and GM, with scattered activated microglial cells and lymphocytes, and the meninges are laden with B-cell folliclelike structures (6–8). The inflammation in SPMS is described as being compartmentalized within the CNS, instead of as inflammatory cells being brought in from the periphery as in relapsing remitting MS attacks (4,8,9). The observed tight correlation between inflammation and axonal injury suggests that inflammation plays a central role in contributing to neurodegeneration and disease progression (4,7,10).
MR imaging is the most sensitive technique for detecting focal WM lesions in vivo, and lesion-load measurement based on conventional T2-weighted MR imaging is used in diagnostics and in the monitoring of treatment (11). Conventional MR imaging can distinguish between acute and chronic lesions, with separation being based primarily on the evidence of blood–brain barrier breakdown by contrast enhancement. Quantitative MR imaging techniques, such as diffusion tensor imaging and high-field MR imaging, have shown promise in detecting subtle abnormalities in the normal-appearing WM (NAWM) and normal-appearing GM (NAGM) in vivo (12,13). What, however, is still entirely lacking from the investigational armamentarium of MS is the ability to identify the heterogeneity of chronic WM lesions in vivo. This would be of great value in the evaluation of the pathologic process in SPMS, in the estimation of the true inflammatory burden, and in identifying patients with progressive MS, who still have demonstrable periplaque inflammation. Importantly, these patients might benefit from active antiinflammatory treatment. Here, PET imaging, with the ability to detect activated microglial cells in vivo, might prove helpful (14).
In this study, we have applied PET imaging as a tool to detect microglial activation using the radioligand 11C-PK11195 binding to the 18-kDa translocator protein (TSPO), a molecule upregulated in activated microglial cells and macrophages but otherwise expressed at a low level in the CNS (15). We used 11C-PK11195 to detect diffuse inflammation in the NAWM of SPMS patients. We also demonstrated that TSPO imaging has the potential to differentiate between different types of chronic T1 hypointense WM lesions in vivo.
MATERIALS AND METHODS
Study Subjects
The study was performed as a clinical, cross-sectional PET and MR imaging study at the Turku PET Centre and Turku University Hospital. The study protocol was approved by the Ethical Committee of the Hospital District of Southwestern Finland, and a written informed consent form was obtained from all participants. On the basis of prior brain PET studies with 11C-PK11195 (15–18), it was estimated that 10 subjects per study group would suffice to reveal 15% group differences in 11C-PK11195 binding, with 90% power at a P level of less than 0.05. Ten SPMS patients (mean age ± SD, 49.8 ± 7.9 y; age range, 42–61 y; 7 women and 3 men) and eight healthy controls (mean age ± SD, 49.7 ± 10.5 y; age range, 39–66 y; 6 women and 2 men) were included in the final evaluation. The main inclusion and exclusion criteria, and information on the two excluded control subjects, are provided in supplemental material (supplemental materials are available at http://jnm.snmjournals.org). The mean expanded disability status scale score of the SPMS patients was 6.3 (SD, 1.5), and mean disease duration was 13.3 y (SD, 5.8 y).
MR Imaging and Data Analysis
The methodology for obtaining conventional MR images and MR image parameters and the preprocessing of the 3-dimensional (3D) T1 MR images for the parametric PET image analysis are described in the supplemental material.
11C-PK11195 Radioligand Production and PET Imaging
The radiochemical synthesis of 11C-PK11195 is described in the supplemental material. PET imaging using the 11C-PK11195 radioligand was performed with a brain-dedicated high-resolution ECAT HRRT scanner (CTI/Siemens) (19) with an intrinsic spatial resolution of approximately 2.5 mm (20). First, a 6-min transmission scan for attenuation correction was obtained using a 137Cs point source. Thereafter, 60-min dynamic imaging was started simultaneously with the intravenous, smooth bolus injection of the radioligand. Head movements during the scan were minimized using an individually shaped thermoplastic mask. The mean administered dose of 11C-PK11195 radioactivity was 480.3 MBq (SD, 17.8 MBq), with no significant differences between the groups (SPMS mean ± SD, 481.7 ± 18.8; control mean ± SD, 478.6 ± 17.7 MBq; P = not significant) and corresponding to a mean mass of 4.3 μg (SD, 1.4 μg).
PET Data Analysis
Image reconstruction was performed using 17 time frames (2 × 15, 3 × 30, 3 × 60, 7 × 300, and 2 × 600 s; total, 3,600 s) as described previously (21). The dynamic data were then smoothed using a gaussian 2.5-mm postreconstruction filter (22). The possible displacements between frames were corrected using mutual information realignment in statistical parametric mapping (SPM8, version 8; Wellcome Trust Center for Neuroimaging).
Manually delineated regions of interest (ROIs) were created using in-house–developed software (Carimas 2.4; Turku PET Centre) on the coregistered 3D T1 images. The ROIs included bilateral cortical ROIs in lateral frontal, lateral temporal, parietal, and occipital cortices (forming a combined ROI of the neocortex); bilateral medial temporal ROIs; deep GM ROIs in the thalamus and striatum; unilateral ROIs in the pons and posterior part of the sinus sagittalis superior; bilateral ROIs in the cerebellar cortex; and bilateral WM ROIs in periventricular NAWM (lateral and cranial WM in relation to the lateral ventricles). All the WM and GM ROIs were placed into areas outside demyelinating lesions—that is, in areas appearing normal in the reference MR imaging.
In addition to the manually delineated ROIs, a semiautomated approach for the analysis of the 11C-PK11195 binding in global NAWM, NAGM, and areas of MS pathology visible in conventional MR imaging (referred to as pathologic WM, including lesional WM with active and chronic plaques visible in T1, T2, and FLAIR [fluid attenuated inversion recovery]) was applied. At first, the MS lesions were identified using the Lesion Segmentation Tool (23), a toolbox running in SPM8. The initial threshold for the lesion-growing algorithm was set to 0.3, and the resulting lesion probability maps were transformed into binary masks consisting of voxels greater than a value of 0.9. Thereafter, an exclusive binary mask image of the deep GM, temporomedial regions, and cerebellum was created using the Automated Anatomic Labeling template (24). The mask image was warped to match the individual dynamic images using in-house–developed software that maps integer values from a template image to subject space by applying the inverse deformation fields resulting from Voxel-Based Morphometry (VBM8, version 8; Structural Brain Mapping Group) segmentation. Another mask image was created using the group of cortical GM regions in the Automated Anatomic Labeling template and multiplying the warped image by the segmented GM (thresholded using a value of 0.5). The acquired individual binary masks were used for the global ROI evaluation of the 11C-PK11195 dynamic images: first, the individual lesion masks were used for creating the corresponding lesional WM ROI, and second, the segmented GM and WM were cleaned using the exclusive masks combined with the lesion mask and consequently used to generate global NAGM and NAWM ROIs.
For the estimation of 11C-PK11195 distribution volume ratio (DVR), the time–activity curve corresponding to a reference region devoid of specific TSPO binding was acquired using a supervised cluster algorithm (SVCA) approach with 4 predefined kinetic tissue classes (SuperPK software, SVCA4 classification) (16,25). Kinetic classes describing binding in normal GM, normal WM, and vasculature were defined using data from control subjects. The high-specific-binding class was defined using thalamus region data from SPMS patients, because the thalamus has been shown to have an age-dependent increase in 11C-PK11195 binding (26), and binding is also increased in patients with MS (15). Then, the graphical Logan method was applied to the ROI-specific time–activity curves using the SVCA4 gray reference input (further details are given in supplemental material).
Parametric 11C-PK11195 DVR images were created using the Logan method with SVCA4 gray reference input. The DVR images were examined to provide similar regional results, compared with the results calculated from the regional average time–activity curves. The parametric images were normalized to the Montreal Neurologic Institute space using subject-specific transformation parameters from 3D T1 MR image preprocessing. To prevent the spill-over effect from the binding in the vasculature and soft tissue, the following procedure was performed. The parametric DVR images were multiplied by the average binary mask image created from the segmented GM and WM images of both control and SPMS patients using Masking toolbox in SPM8. Thereafter, the masked parametric images were smoothed with an in-house–created edge-preserving gaussian 3D filter (8 mm in full width at half maximum) before the statistical analysis using SPM8.
In addition, the 11C-PK11195 DVR images were assessed with respect to MS lesions by overlaying the DVR images with 3D T1 and FLAIR sequences to form fusion images using the Carimas software. Furthermore, the T1 hypointense lesions were classified by visual, qualitative assessment, in which the lesion was regarded as 11C-PK11195–positive if the signal surrounding the T1 hypointense lesion in the 11C-PK11195 DVR image was increased in more than half of the lesion’s circumference (in all axial slices), compared with the adjacent or contralateral NAWM. The analysis was performed using Carimas software.
Statistical Methods
The statistical analyses of PET, MR imaging, and clinical parameters were performed using SPSS (SPSS Statistics, version 21; IBM). The normality of distribution of the variables was checked using the Shapiro–Wilk test. Because of nonnormally distributed variables, and the small number of subjects per group, the nonparametric Mann–Whitney U test was used to estimate group differences. To evaluate the possible associations between different variables of interest, the Spearman nonparametric test for correlations was performed.
The voxelwise evaluation of differences in 11C-PK11195 binding between groups was performed by analyzing the normalized and smoothed parametric 11C-PK11195 DVR images. The statistical analysis was performed with SPM8 using an independent-samples t test to test for possible differences between groups. The group differences in voxel level with a P value of less than 0.001 (uncorrected), and in cluster level, with a P value of less than 0.001 (corrected for multiple comparisons; familywise error) were regarded as significant.
RESULTS
11C-PK11195 Binding in NAWM of SPMS Patients, Compared with Healthy Controls
All SPMS patients had widespread MS pathology in the WM, with a mean lesion load of 61 cm3 (SD, 44; Table 1), when evaluated using MR imaging. There was also significant brain atrophy, compared with healthy controls: the mean WM volume of SPMS patients was 713 cm3 (SD, 56) versus 783 cm3 (SD, 33) in healthy controls (P = 0.001). The respective mean GM volumes were 730 cm3 (SD, 67) and 824 cm3 (SD, 48) (P = 0.006).
Quantification of MR Imaging Lesions and Number of T1 Lesions with TSPO Uptake
The DVR of 11C-PK11195 was significantly increased among SPMS patients, compared with healthy controls, in the manually delineated ROIs of periventricular NAWM (median, 0.96; interquartile range [IQR], 0.91–1.02, in SPMS vs. median, 0.86; IQR, 0.83–0.89, in controls; P = 0.016) and thalami (median, 1.19; IQR, 1.12–1.21, in SPMS vs. median, 1.10; IQR, 1.08–1.13, in controls; P = 0.027) (Fig. 1). In other ROIs, no significant differences between groups were found (P = 0.534–0.790) (Fig. 1). Segmentation analysis yielded similar results—that is, there was increased 11C-PK11195 uptake within the segmented global NAWM ROI of the SPMS group, compared with controls (median, 0.96; IQR, 0.96–0.97, in SPMS vs. median, 0.92; IQR, 0.92–0.93, in controls; P < 0.001). Uptake in the abnormal WM (plaque areas derived from the Lesion Segmentation Tool) was significantly lower (DVR median, 0.88; IQR, 0.85–0.92), compared with the segmented global NAWM in SPMS patients (related-samples Wilcoxon signed-rank test, P = 0.008). Similarly, the voxelwise group comparison of parametric 11C-PK11195 DVR images revealed areas of significantly increased 11C-PK11195 binding in widespread areas of periventricular and subcortical WM (Fig. 2). Significant differences in the segmented cortical NAGM DVR were not found between the groups (P = 0.110). The differences in the 11C-PK11195 binding patterns between healthy controls and SPMS patients in individual level are visualized in Figure 3.
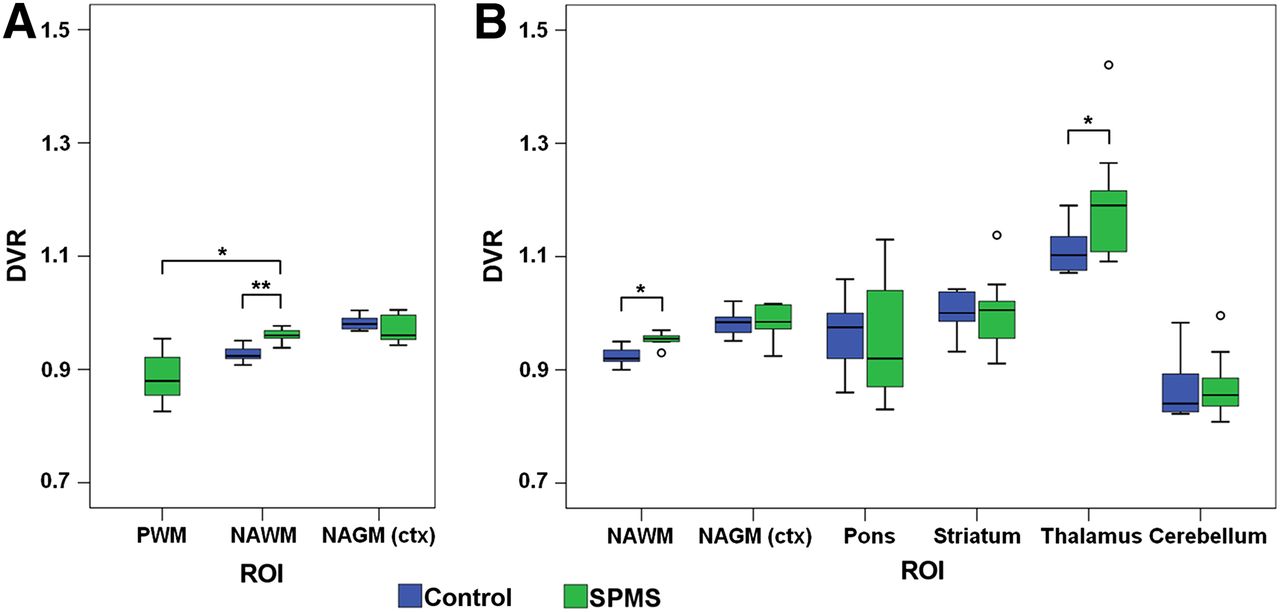
11C-PK11195 DVR in different ROIs of SPMS patients and healthy controls. Results are visualized as box plots showing median, minimum, maximum, first and third quartile limits, and outliers (○). (A) ROIs derived by semiautomated segmentation. (B) ROIs derived by manual delineation. NAWM = regions of normal-appearing periventricular WM and sentrum semiovale; NAGM (ctx) = combined ROI of bilateral ROIs in normal-appearing frontolateral, parietal, temporal, and occipital cortices; PWM = pathologic white matter. *P < 0.05. **P < 0.001.
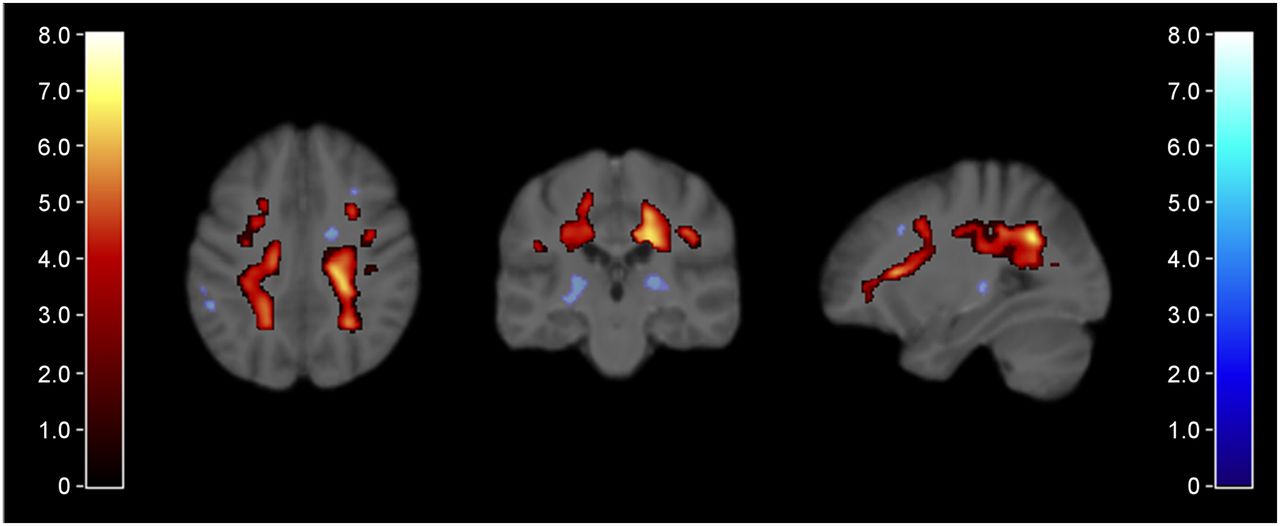
Results of SPM analysis of parametric 11C-PK11195 DVR images from healthy controls and SPMS patients. Areas of significantly increased 11C-PK11195 DVR in SPMS vs. control group indicated according to red color bar (T score > 3.8 corresponding to P < 0.001; independent-samples t test, familywise error correction for multiple comparisons, cluster extent threshold, 604 voxels) and rendered on study subjects’ average 3D T1 MR template. In addition, areas significant in voxel peak level but not significant after multiple comparisons are shown in blue (T score > 3.7 corresponding to uncorrected P < 0.001).
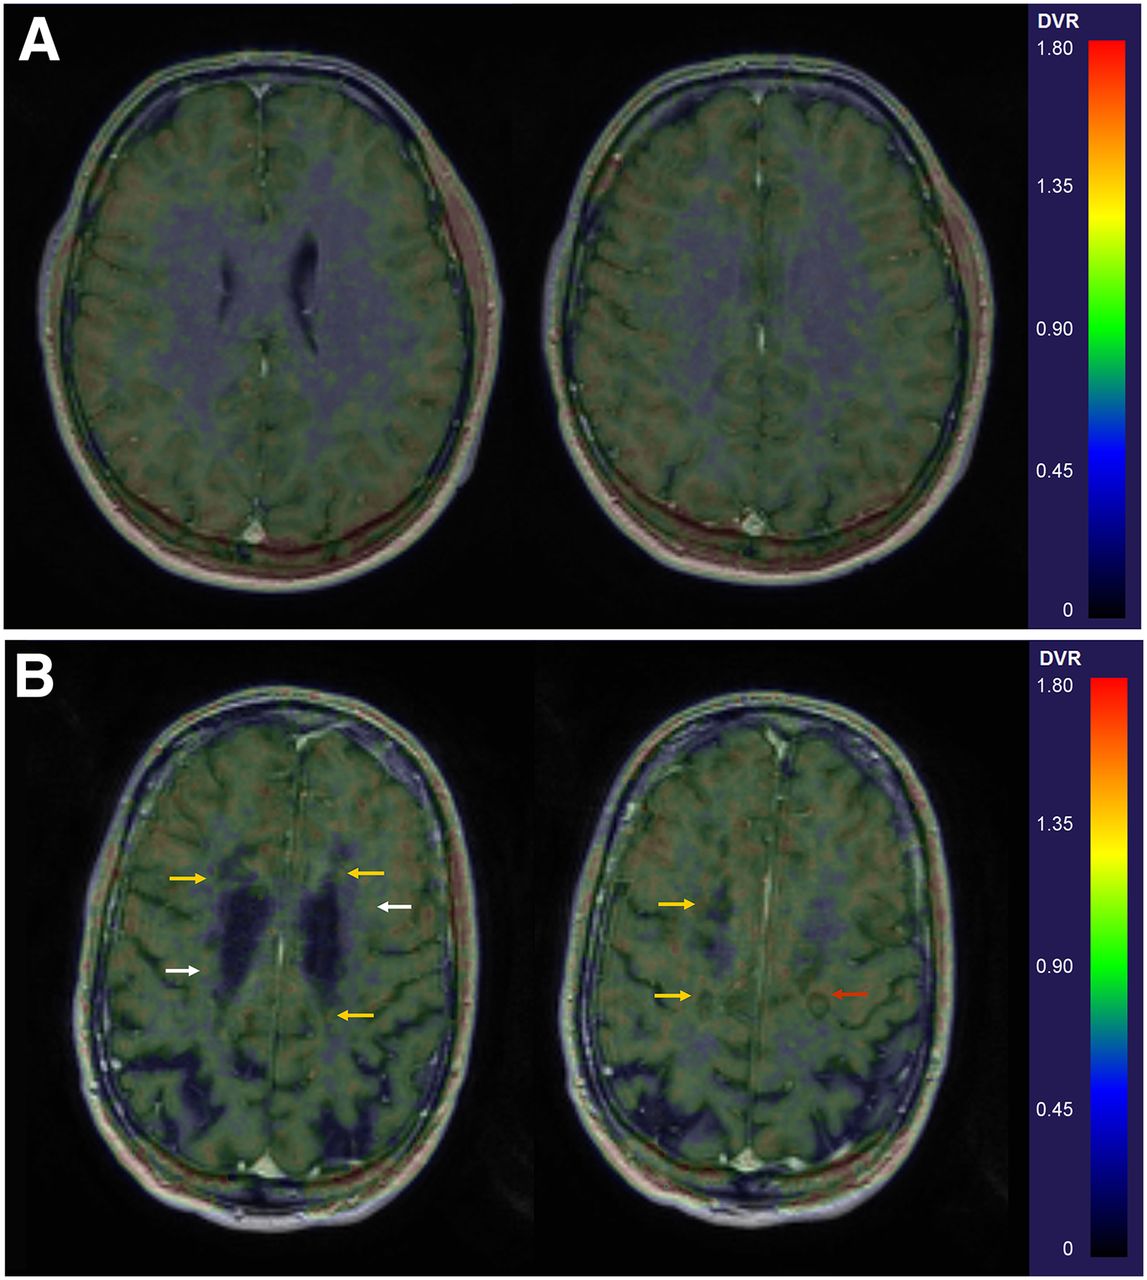
Differences in 11C-PK11195 binding of a healthy control (man, 42 y) (A) and an SPMS patient (man, 40 y; patient 10 in Table 1) (B). Fusion images of gadolinium-enhanced 3D T1 MR image coregistered with parametric 11C-PK11195 DVR images, with arrows indicating increased binding in WM (white arrows in NAWM, yellow in periplaque regions of T1 hypointense lesions, and red in and around a plaque with slight gadolinium enhancement).
11C-PK11195-Binding in Chronic Plaques
A pattern of increased TSPO binding in the periplaque area surrounding the borders of T1 hypointense plaques in the WM was noted in the parametric DVR images fused with 3D T1 and FLAIR images (Fig. 3), and on quantification, increased periplaque binding was observed in an average of 57% of the chronic T1 lesions (Table 1). All but one patient had chronic lesions both with and without periplaque binding (Table 1). In active plaques with gadolinium enhancement, increased binding was observed in the core of the lesions but not in the area surrounding them. Additionally, focal areas with increased PK binding were found in the NAWM (Fig. 4).
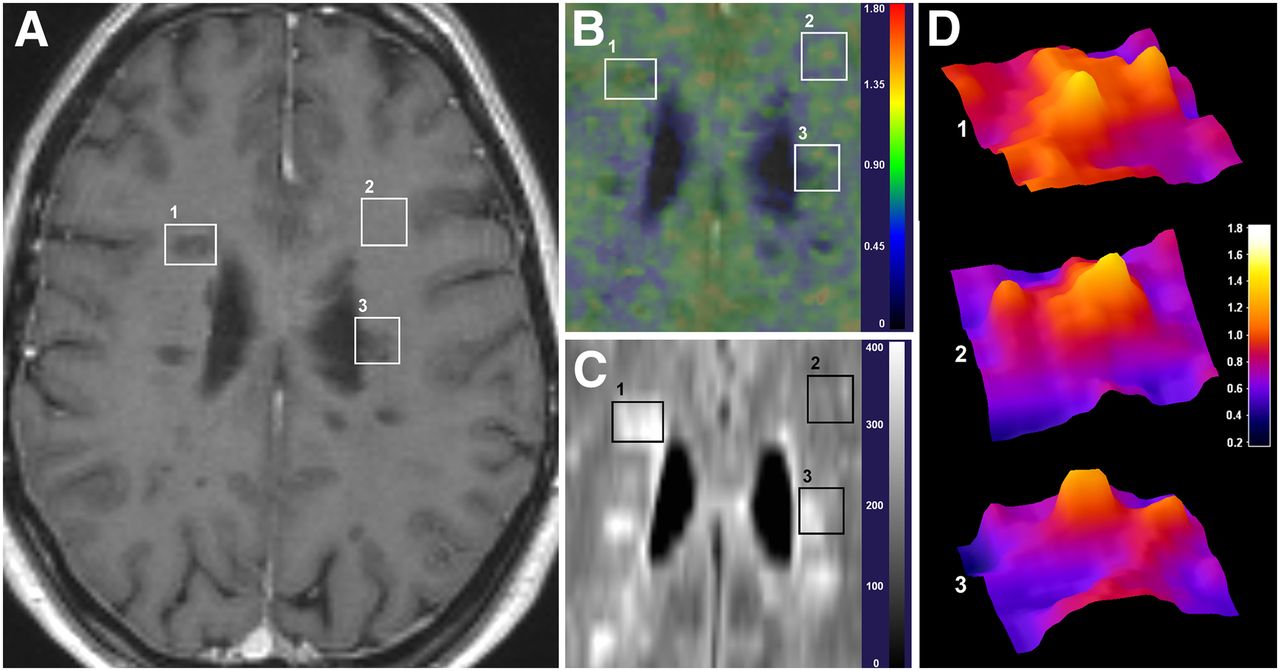
Visualization of 11C-PK11195 uptake patterns with respect to MR imaging findings. Axial views of gadolinium-enhanced 3D T1 (A), parametric 11C-PK11195 DVR image (B), FLAIR sequences (C), and surface plots of 11C-PK11195 DVR image (D) in areas of slightly enhancing active plaque with increased 11C-PK11195 signal within plaque (1); NAWM with increased 11C-PK11195 signal (2); and chronic active T1 lesion with increased 11C-PK11195 signal around but not in core of plaque, demonstrated in D(1)–D(3) (3). Scales in B and D represent DVR values, and scale in C represents intensity of FLAIR signal. Images are from patient 2 in Table 1.
DISCUSSION
Our in vivo PET study of SPMS patients demonstrates that TSPO imaging has additional value over MR imaging, because it can detect two aspects of pathology associated with progressive disease—that is, the diffuse widespread inflammation in the NAWM and the active inflammatory rim of the chronic active plaques, both manifestations of microglial cell activation not detectable by MR imaging. The demonstration of increased TSPO binding in a proportion of chronic plaques extends earlier observations of in vivo focal TSPO binding in chronic lesions and ex vivo neuropathologic analysis of chronic plaques (4,15). The evaluation of TSPO binding could thus be a promising method for differentiating between different subtypes of chronic lesions, and its usability as an outcome method should be tested in treatment studies of progressive disease.
11C-PK11195 has been tested so far in a few in vivo MS studies (17,18,27,28). Despite the challenges created by the shortcomings of the ligand (i.e., the low signal-to-noise ratio and difficulties in quantification), increased ligand binding has been successfully correlated to active MR imaging lesions (15,27). Additionally, increased binding has been described in areas outside focal lesions, suggesting the ability to demonstrate diffuse inflammation (15,17,28). Binding of 11C-PK11195 to focal areas corresponding to active MS plaques is expected according to pathologic evidence of strong activation of microglial cells in active lesions and homing of activated blood-borne monocytes into the CNS through the open blood–brain barrier (29). The TSPO ligand binding to NAWM and NAGM and the ability to identify in vivo the activation status of chronic plaques (57% of the plaques being of the chronic active type in our study) are, however, the parameters that truly bring added value over MR imaging methods.
PET data analysis regarding the measurement of diffuse inflammation in advanced MS requires special attention. Notably, no desirable, anatomically distinct reference region free of pathology, and hence free of specific radioligand binding, can be found in the brain of patients with longstanding MS disease. Because of the variation in data analysis methods, one must be cautious when comparing earlier MS studies with each other. For example, in some studies, the cortical GM was used as a reference region (27,28), whereas in others GM was among the target areas of interest (17). To overcome the lack of suitable reference region in the MS brain, a supervised clustering technique (16,25) has been developed to derive a clustered reference area devoid of specific binding, a method used also in our study. This technique has already been applied to earlier MS studies with 11C-PK11195, similarly with demonstration of diffuse inflammation (17). One difference in findings between our study and the one by Politis et al. (17) is the lack of increased 11C-PK11195 binding in the GM in our patient cohort. This lack of increased binding might result from different data processing and modeling approaches (reviewed in the supplemental material) or from neuropathologic differences in the relatively small study groups evaluated in both studies. Particularly, in the present study, the segmented MR images were created using an improved segmentation method, and the parametric PET images were masked using segmented images to avoid spill-over from binding to the soft tissue and vasculature. Theoretically, the spill-over might contribute to a finding of increased binding in the cortical GM (17,18). Alternatively, the use of the more up-to-date segmentation algorithm tools in our study, and the exclusive mask used to prevent the spill-over from the extracerebral structures in the parametric image analyses, might have led to too stringent exclusion of cortical ligand binding, thus accounting for the lack of increased cortical TSPO binding. Interestingly, despite no significantly increased TSPO binding in the cortical GM, we did demonstrate increased deep GM binding of 11C-PK11195, as also reported earlier (15). Taken together, TSPO studies of diffuse inflammation require elaborate methodology in analyzing the data, and it is of the utmost importance that the methodology be validated and harmonized to allow comparison between studies.
PET imaging provides a unique method for the in vivo detection of the various pathologic hallmarks of progressive MS disease, such as the presence of activated microglial cells or the degree of demyelination, and various PET targets can hence be viewed as potential imaging biomarkers in the evaluation of progressive MS (30,31). New, more specific TSPO ligands are being developed for improved detection of activated microglial cells, but methodologic problems such as the individual genetic variability in the ligand binding (32) have thus far hampered their use. Simple genetic testing, however, now allows prescreening of patients and enables the control of the interindividual physiologic variation in TSPO ligand binding properties (33), and the use of second-generation TSPO ligands will certainly also be seen in MS studies, both in longitudinal evaluation of disease progression and in treatment trials.
CONCLUSION
Our results show that evaluation of microglial activation using TSPO-binding PET ligands allows the assessment of diffuse brain inflammation and perilesional activity in progressive MS in vivo. Furthermore, our results suggest that TSPO binding could be used to differentiate between different subtypes of chronic lesions.
DISCLOSURE
The costs of publication of this article were defrayed in part by the payment of page charges. Therefore, and solely to indicate this fact, this article is hereby marked “advertisement” in accordance with 18 USC section 1734. This study was financially supported by the Finnish Academy, the Instrumentarium Science Foundation and the Finnish MS Foundation. The research leading to these results has received funding from the European Union's Seventh Framework Programme (FP7/2007-2013) under grant agreement HEALTH-F2-2011-278850 (INMiND). No other potential conflict of interest relevant to this article was reported.
Acknowledgments
The expertise and kind assistance of Prof. Bonald Boellaard and Dr. Rainer Hinz in assisting in the optimization of the SVCA4 algorithm and of Prof. Federico Turkheimer in providing the SuperPK software are gratefully acknowledged. The staff participating in executing the studies in Turku PET Centre, and especially Dr. Jere Virta, are also gratefully acknowledged.
Footnotes
Published online Apr. 7, 2014.
- © 2014 by the Society of Nuclear Medicine and Molecular Imaging, Inc.
REFERENCES
- Received for publication September 17, 2013.
- Accepted for publication December 3, 2013.


Jump to section
Related Articles
Cited By...
- Integrating TSPO-PET imaging with metabolomics for enhanced prognostic accuracy in multiple sclerosis
- Microglia from patients with multiple sclerosis display a cell-autonomous immune activation state
- Etifoxine inhibits NLRP3 inflammasome activity in human and murine myeloid cells
- Association of serum neurofilament light with microglial activation in multiple sclerosis
- Multimodal diagnostics in multiple sclerosis: predicting disability and conversion from relapsing-remitting to secondary progressive disease course - protocol for systematic review and meta-analysis
- Association of serum neurofilament light with microglial activation in multiple sclerosis
- Innate Immune Cell-Related Pathology in the Thalamus Signals a Risk for Disability Progression in Multiple Sclerosis
- Secondary Progressive Multiple Sclerosis: New Insights
- Structural and Clinical Correlates of a Periventricular Gradient of Neuroinflammation in Multiple Sclerosis
- Insights into smouldering MS brain pathology with multimodal diffusion tensor and PET imaging
- Individual Mapping of Innate Immune Cell Activation Is a Candidate Marker of Patient-Specific Trajectories of Worsening Disability in Multiple Sclerosis
- Insights into disseminated MS brain pathology with multimodal diffusion tensor and PET imaging
- Gray matter microglial activation in relapsing vs progressive MS: A [F-18]PBR06-PET study
- Natalizumab treatment reduces microglial activation in the white matter of the MS brain
- Test-retest reliability and convergent validity of (R)-[11C]PK11195 outcome measures without arterial input function
- Microglial activation, white matter tract damage, and disability in MS
- Microglial Phenotypes and Functions in Multiple Sclerosis
- Evaluation of the Effect of Fingolimod Treatment on Microglial Activation Using Serial PET Imaging in Multiple Sclerosis
- 11C-PBR28 and 18F-PBR111 Detect White Matter Inflammatory Heterogeneity in Multiple Sclerosis
- In Vivo PET Imaging Demonstrates Diminished Microglial Activation After Fingolimod Treatment in an Animal Model of Multiple Sclerosis