


Abstract
Our objective was to develop a novel approach to generate individual maps of white matter (WM) innate immune cell activation using 18F-DPA-714 translocator protein PET and to explore the relationship between these maps and individual trajectories of worsening disability in patients with multiple sclerosis (MS). Methods: Patients with MS (n = 37), whose trajectories of worsening disability over the 2 y preceding study entry were calculated, and healthy controls (n = 19) underwent MRI and 18F-DPA-714 PET. A threshold for significant activation of 18F-DPA-714 binding was calculated with a voxelwise randomized permutation-based comparison between patients and controls and used to classify each WM voxel in all subjects as characterized by a significant activation of innate immune cells (DPA+) or not. Individual maps of innate immune cell activation in the WM were used to calculate the extent of activation in WM regions of interests and to classify each WM lesion as DPA-active, DPA-inactive, or unclassified. Results: Compared with the WM of healthy controls, patients with MS had a significantly higher percentage of DPA+ voxels in the normal-appearing WM (NAWM) (NAWM in patients, 24.6% ± 1.4%; WM in controls, 14.6% ± 2.0%; P < 0.001). In patients with MS, the percentage of DPA+ voxels increased significantly from the NAWM to the perilesional areas, T2 hyperintense lesions, and T1 hypointense lesions (38.1% ± 2.6%, 45.0% ± 2.6%, 51.8% ± 2.6%, respectively; P < 0.001). Among the 1,379 T2 lesions identified, 512 were defined as DPA-active and 258 as DPA-inactive. A higher number of lesions classified as DPA-active (odds ratio, 1.13; P = 0.009), a higher percentage of DPA+ voxels in the NAWM (odds ratio, 1.16; P = 0.009), and a higher percentage of DPA+ voxels in T1 spin-echo lesions (odds ratio, 1.06; P = 0.036) were significantly associated with a retrospectively more severe clinical trajectory in patients with MS. Conclusion: A more severe trajectory of disability worsening in MS is associated with innate immune cell activation inside and around WM lesions. 18F-DPA-714 PET may provide a promising biomarker to identify patients at risk of a severe clinical trajectory.
Multiple sclerosis (MS) is the most frequent demyelinating disease and remains the first cause of nontraumatic neurologic disability among young adults (1). During the past few decades, great therapeutic progress has been made in the prevention of clinical relapses. However, preventing worsening of disability remains a key unsolved issue in the treatment of MS. Disability worsening does not follow homogeneous and stable trajectories over the course of the disease but instead can be characterized by alternating phases of rapidly increasing disability and clinical stability (2).
The activation of the innate immune system has been shown to play a crucial role in the biologic processes that contribute to the increase of clinical disability in MS. Proinflammatory innate immune cells are involved in active demyelination and axonal damage and have the potential to inhibit myelin repair (3). Moreover, white matter (WM) lesions surrounded by a rim of persisting activated microglial cells are found—on postmortem examination—exclusively in the brains of patients who experienced clinical progression (4). Finally, microglial cells mediate the subpial cortical demyelination associated with meningeal inflammation (5), and their accumulation in both the normal-appearing WM (NAWM) and the gray matter results in oxidative burst, energy deficit, and neurodegeneration (6).
These converging lines of evidence suggest that activation of the innate immune system acts as a transversal biologic mechanism contributing to tissue damage and disability at all stages of the disease.
The most popular imaging tool to measure innate immune cells is PET with radiotracers targeting translocator protein (18 kDa) (TSPO), whose expression is upregulated in innate immune cells in the context of inflammatory conditions such as MS (7).
Increased binding of 11C-PK11195, the first-generation compound developed for TSPO imaging, has been described inside and outside WM lesions and in the gray matter of patients with all forms of MS (8,9). Recent studies using 11C-PBR28, a second-generation TSPO tracer, have demonstrated high binding in the cortex of MS patients (10) and a subject-specific heterogeneity in WM lesion binding (11).
The pyrazolopyrimidine 18F-DPA-714 (12) is a fluorinated second-generation TSPO tracer that allows reliable kinetic modeling in humans (13) and noninvasive quantification through the extraction of reference regions (14,15). In a recent pilot study, 18F-DPA-714 PET could reliably identify focal and diffuse neuroinflammation (16). In the current study, we performed 18F-DPA-714 PET on a group of 37 patients with relapsing or progressive MS and a group of healthy controls. We developed an original postprocessing approach to obtain individual maps of innate immune cell activation and to explore the relationship between these individual profiles of innate immune cell activity and patient-specific trajectories of worsening disability in MS.
MATERIALS AND METHODS
Subjects
We recruited 41 patients with MS according to the revised McDonald criteria (17) (13 relapsing-remitting [RR], 15 secondary-progressive [SP], and 13 primary-progressive [PP]) and 20 age- and sex-matched healthy controls (HCs). All subjects gave written informed consent to participate in a protocol approved by the local ethics committee.
The subjects were genotyped for the rs6971 polymorphism and categorized as having high-affinity binding (HAB) (22 MS, 9 HC), mixed-affinity binding (MAB) (15 MS, 10 HC), or low-affinity binding (4 MS, 1 HC) to TSPO sites (18). The last group was excluded from further analysis (Table 1).
Demographic, Clinical, and Radiologic Characteristics of Patients and HCs
Clinical Assessment
At study entry, all patients underwent a neurologic examination and were scored using the Expanded Disability Status Scale (EDSS) (19). For each patient, the EDSS score 2 y before study entry was retrospectively collected through careful review of primary medical files. Worsening disability over 2 y was evaluated as changes in EDSS between the inclusion visit and 2 y before study entry and was converted into an EDSS step change (20).
Patients were classified as untreated, treated with immunomodulators, or treated with immunosuppressors according to the main treatment received in the 2 y preceding study entry (Table 1).
Imaging Acquisition
Within 1 mo from study entry, all subjects underwent MRI (3-T Prisma with a 32-channel head coil; Siemens) and dynamic 18F-DPA-714 PET (High Resolution Research Tomograph; Siemens).
The MRI protocol included the following sequences: 3-dimensional T1-weighted magnetization-prepared rapid gradient-echo (resolution, 1.0 × 1.0 × 1.1 mm), T2-weighted (resolution, 0.9 × 0.9 × 3.0 mm), 3-dimensional fluid-attenuated inversion recovery (resolution, 0.9 × 0.9 × 3.0 mm), and pre- and post-gadolinium T1-weighted spin-echo (resolution, 1.0 × 1.0 × 3.0 mm).
The PET protocol consisted of an intravenous bolus injection of 198.4 ± 22.9 MBq of 18F-DPA-714 at the beginning of a 90-min dynamic acquisition. The PET acquisition parameters and image reconstruction are detailed elsewhere (14).
Image Analysis
In patients, T2 hyperintense lesions were manually contoured on T2-weighted images with reference to fluid-attenuated inversion recovery images. T1 spin-echo hypointense and gadolinium-enhancing lesions were, respectively, contoured on pre- and post-gadolinium T1-weighted spin-echo sequences. The corresponding lesion masks were generated and aligned to the individual T1-weighted image using FLIRT (FMRIB’s [Oxford Centre for Functional MRI of the Brain’s] Linear Image Registration Tool) (FMRIB Software Library, version 5.0.9). After lesion-filling in patients only (21), T1-weighted scans were segmented using FreeSurfer, version 6.0.
The following regions of interest (ROIs) were then defined in patients: NAWM, defined as the WM outside visible lesions on T2-weighted images; perilesional area, defined as the 2-voxel rim outside lesional borders; T2 lesions; T1 spin-echo lesions; and gadolinium-enhancing lesions. In HCs, the WM ROI was defined.
In each subject, T1-weighted images were nonlinearly registered onto a standard brain image (Montreal Neurological Institute [MNI]) using a combination of affine and symmetric diffeomorphic transformations calculated with Advanced Normalization Tools, version 2.2. The derived transforms were used to align all previously generated ROIs to standard space.
Voxelwise 18F-DPA-714 distribution volume ratio (DVR) parametric maps were calculated using the Logan graphical method based on reference region, extracted using a supervised clustering algorithm (Supplemental Fig. 1; supplemental materials are available at http://jnm.snmjournals.org) (14). DVR maps were coregistered to the T1-weighted images with FLIRT and normalized to MNI using the previously derived transformations.
Generation of Individual Maps of Activated Microglia
The objective of this part of the analysis was to determine, for each individual DVR map, which voxels were characterized by a significant activation of innate immune cells (hereinafter referred to as DPA+ voxels). The method we developed involves 2 steps: definition of a threshold (Fig. 1A) and classification of voxels (Fig. 1B).
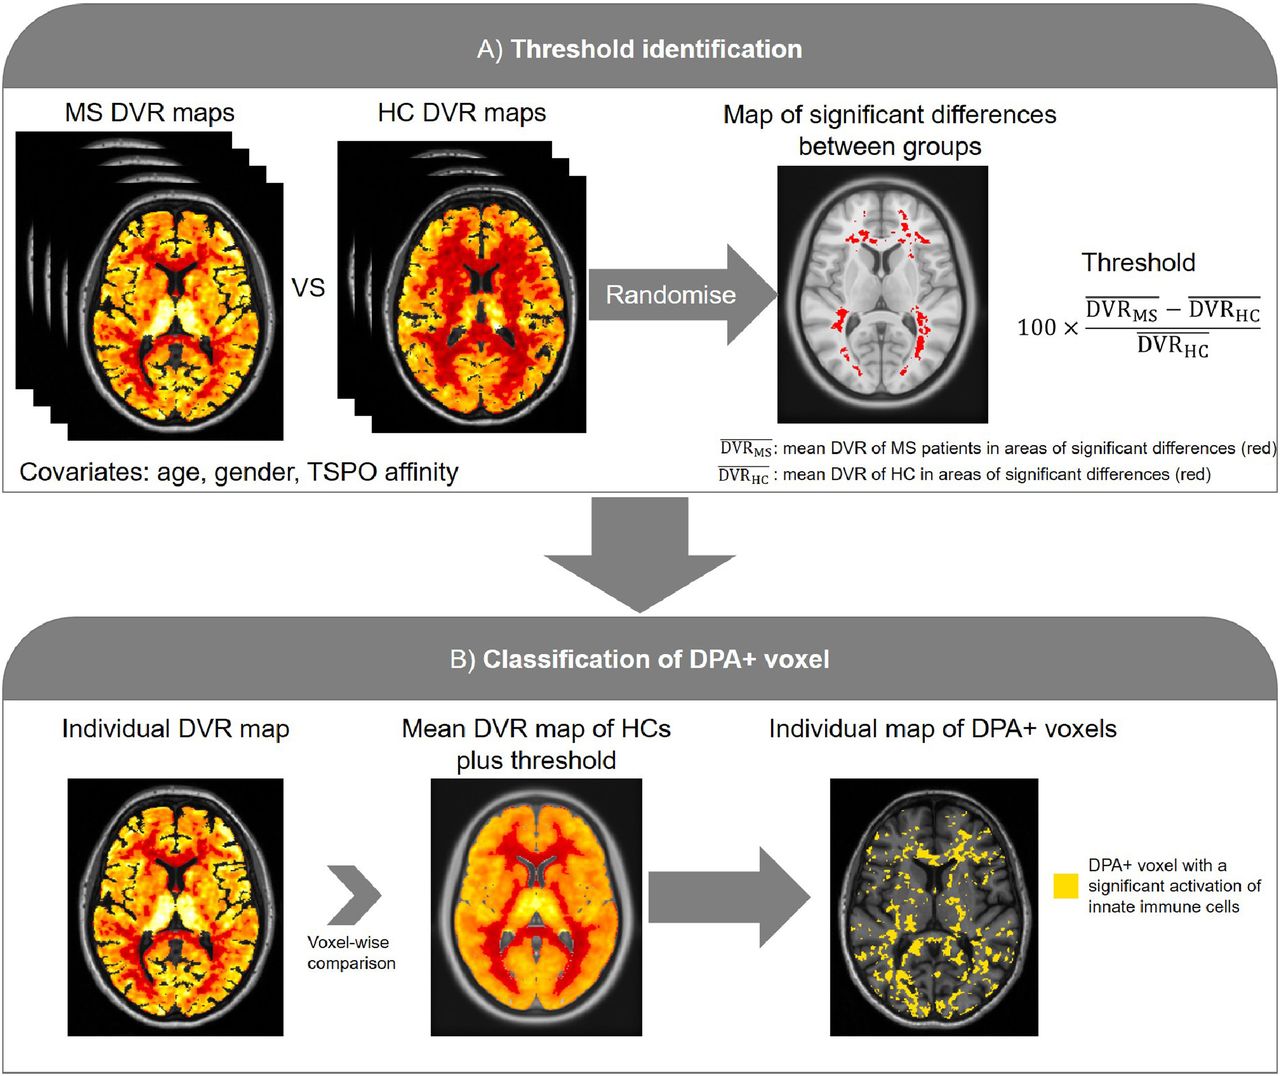
Flowchart of image analysis pipeline applied to generate individual maps of innate immune cell activation, based on 18F-DPA-714 PET. (A) Definition of threshold to identify innate immune cell activation. Regions of significant group differences between DVR maps of patients with MS and HCs were identified through voxelwise nonparametric permutation-based t test. From these regions of significant difference, mean DVR in patients and HCs were extracted and used to calculate relative percentage threshold. (B) Classification of DPA+ voxels. We classified as DPA+ all voxels whose DVR was above the following value: the mean DVR of the voxels localized at the same MNI coordinates in HC enhanced by the previously calculated threshold.
For the threshold definition, we initially identified WM regions of significant group differences between the DVR maps of patients with MS and HCs. This was done by performing a voxelwise nonparametric permutation-based t test with threshold-free cluster enhancement using Randomize from the FMRIB Software Library, where age, sex, and TSPO affinity were included as covariates. From these regions of significant difference, we extracted the mean DVR in patients ( and HCs (
 and used them to calculate a relative percentage threshold as follows:
In the second step, voxel classification was performed in MNI space for each subject separately. We classified as DPA+ all voxels whose DVR was above the following value: the mean DVR of the voxels localized at the same MNI coordinates in HC enhanced by the previously calculated threshold. This resulted in individual maps of microglia activation, consisting of binary masks of DPA+ voxels.
Given the impact of the TSPO affinity on the DVR estimates, all these steps after the Randomize analysis (threshold calculation and voxel classification) were performed separately for HABs and MABs.
The percentage of DPA+ voxels over the total volume in the NAWM, perilesional area, T2 lesions, T1 spin-echo lesions, and gadolinium-enhancing lesions of patients with MS, and in the WM of HCs, was then calculated.
Single-Lesion Classification
In patients, to minimize the partial-volume effect, only WM lesions with a volume greater than 50 voxels were analyzed. Each lesion was then classified as DPA-active (percentage of DPA+ voxels over lesion volume ≥ 50%), DPA-inactive (percentage of DPA+ voxels over lesion volume ≤ 10%), or unclassified (lesion not falling into one of these 2 classes).
Statistical Analysis
Linear regression models were used to assess unadjusted differences in age between HCs and the MS subgroups and unadjusted differences in disease duration, T2 lesion load, and T1 spin-echo lesion load between the MS subgroups. Fisher exact tests were used to determine whether there were significant differences in the distribution of sex and TSPO affinity between HCs and the MS subgroups or differences in treatment among the MS subgroups. Ordered logistic regression models were used to test differences in EDSS and EDSS step change among the MS subgroups.
A multiple linear regression model including age, sex, and TSPO affinity as covariates was used to assess the difference in mean DVR (response variable) between the NAWM of the whole group of MS patients and the WM of HCs (predictors).
In MS patients only, a linear mixed-regression model, accounting for the hierarchical structure of the data, was used to assess the difference in mean DVR (response variable) among ROIs (NAWM, perilesional area, T2 lesions, and T1 spin-echo lesions, as predictors). Age, sex, MS subgroup, TSPO affinity, and treatment type were included as covariates. Subjects were included in the model as a random effect, whereas ROIs and the other covariates were assumed as fixed in the population.
A similar approach was applied to test the difference in percentage of DPA+ voxels (response variable) between the NAWM of MS patients and the WM of HCs (predictors) and to test the difference in percentage of DPA+ voxels (response variable) between ROIs (predictors).
In MS patients only, 2 linear regression models were used to assess differences between MS subgroups (predictors) in the number of DPA-active or DPA-inactive lesions (response variable). Age, sex, treatment type, and total number of T2 lesions were included as covariates.
Multiple ordered logistic regression models were used to assess which parameters were associated with EDSS at study entry or with an EDSS step change over the 2 y preceding study entry (response variable). The following parameters were considered (predictors): T2 lesion load; T1 spin-echo lesion load; number of T2 lesions; percentage of DPA+ voxels in NAWM, perilesional area, T2 lesions, and T1 spin-echo lesions; and number of DPA-active and DPA-inactive lesions. Age, sex, MS subgroup, and treatment type were included as covariates of no interest.
Statistical analyses were performed in Stata (version 14.0 MP). Demographic data are presented as mean ± SD, whereas EDSS and EDSS step changes are presented as median and range. For inferential statistics, results are reported as estimated marginal mean ± SE or as median and interquartile range, except as otherwise specified. For all tests, the level of statistical significance was set at a P value of less than 0.05, and Bonferroni corrected pairwise comparisons of the estimated marginal means were performed when necessary.
RESULTS
Demographic, Clinical, and MRI Variables
The subjects’ demographics, TSPO genotype, clinical data, and radiologic data are reported in Table 1. No significant difference was found between HCs and the MS subgroups for age (P = 0.27), sex (P = 0.05), or TSPO affinity (P = 0.85). Disease duration, EDSS, and treatment type differed significantly among the MS subgroups (respectively, P = 0.0018, P = 0.001, and P = 0.001). EDSS step change, T2 lesion load, and T1 spin-echo lesion load did not statistically differ among the MS subgroups (respectively, P = 0.84, P = 0.58, and P = 0.39).
Increasing Gradient of Innate Immune Cell Activation from NAWM to MS Lesions
In WM areas that differed significantly between patients and HCs, the mean DVRs were 0.92 ± 0.09 and 0.99 ± 0.09 in patients with MS (HAB and MAB, respectively) and 0.77 ± 0.06 and 0.84 ± 0.07 in HCs (HAB and MAB, respectively). Thus, the relative changes between groups were 19.34% and 17.29% for HAB and MAB, respectively. A final relative group difference rounded to 20% was retained for both HAB and MAB and was used as a threshold to identify DPA+ voxels. As a result, for each subject an individual map of innate immune cell activation was generated (Fig. 2).

Individual maps of immune cell activation. Individual maps of innate immune cell activation in one HC (A) and in 3 patients with MS characterized by sparse (B), intermediate (C), and extensive (D) innate immune cell activation. Lesional inactive voxels in patients are represented in white, whereas voxels characterized by significant activation of innate immune cells are displayed in yellow in NAWM, in dark red in perilesional areas, and in light red inside T2 lesions.
The mean DVR in the NAWM of patients with MS was significantly higher (mean ± SE, 0.94 ± 0.01; P = 0.002) than the DVR in the WM of HCs (0.87 ± 0.02) (Fig. 3A). In patients with MS, the mean DVR differed significantly among ROIs (P = 0.002) (Supplemental Table 1), with a gradient that increased from the NAWM to the perilesional areas (1.03 ± 0.02), T2 lesions (1.01 ± 0.02), and T1 spin-echo lesions (1.05 ± 0.02).

Gradient of innate immune cell activation from normal WM to MS lesions. Box plot shows mean DVR (A) and percentage of voxels classified as DPA+ (B) increasing from WM of HC and NAWM of patients with MS to MS lesions. **P < 0.01. ***P < 0.001.
The percentage of DPA+ voxels in the NAWM of patients with MS was significantly higher (24.6% ± 1.4%, P < 0.001) than the percentage of DPA+ voxels in the WM of HCs (14.6% ± 2.0%) (Fig. 3B). In patients with MS, the percentage of DPA+ voxels differed significantly among ROIs (P < 0.001) (Supplemental Table 1), with a gradient that increased from the NAWM to the perilesional areas (38.1% ± 2.6%), T2 lesions (45.0% ± 2.6%), and T1 spin-echo lesions (51.8% ± 2.6%).
Unmasking of Active MS Lesions by 18F-DPA-714 PET
In MS patients, 1,379 T2 lesions were analyzed (median and interquartile range: 32 and 26, respectively, for RR; 29 and 23.5, respectively, for PP; and 32 and 34, respectively, for SP). Among the considered lesions, 176 (12.8%) were also identified as T1 spin-echo lesions. Only 3 gadolinium-enhancing lesions were identified on the basis of the post-gadolinium T1 spin-echo sequence.
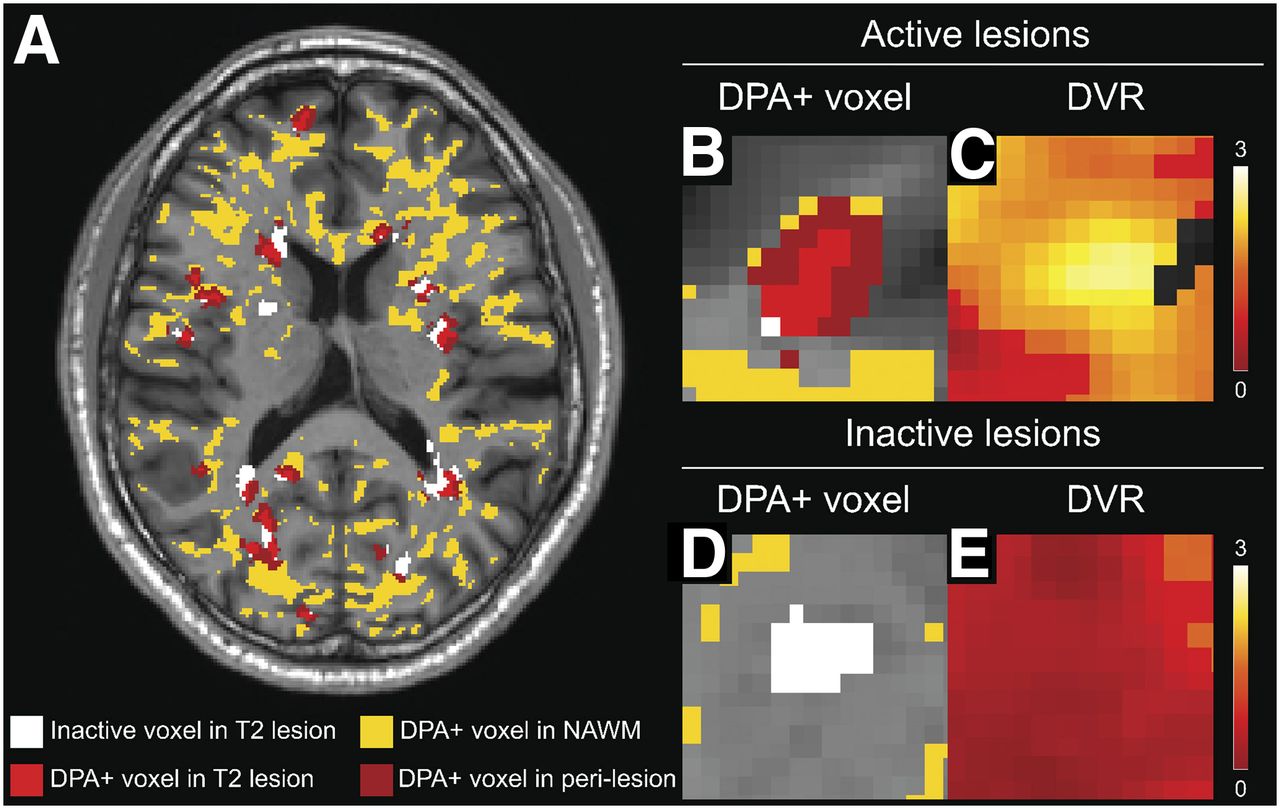
On the basis of the 18F-DPA-714 PET results, 512 (37.1%) lesions were defined as DPA-active (median and interquartile range: 13 and 6, respectively, for RR; 8 and 11, respectively, for PP; and 14 and 16, respectively, for SP), and 258 (18.7%) were identified as DPA-inactive (median and interquartile range: 6 and 7, respectively, for RR; 5 and 5.5, respectively, for PP; and 7.5 and 6, respectively, for SP) (Fig. 4). No significant difference was found in the number of DPA-active or DPA-inactive lesions among the MS subgroups (Supplemental Table 2).

Classification of WM lesions based on innate immune cell activation. (A) Map of innate immune cell activation in single patient. Lesional inactive voxels are displayed in white, whereas voxels characterized by significant activation of innate immune cells (DPA+) are displayed in yellow in NAWM, in dark red in perilesional areas, and in light red inside T2 lesions. (B and C) Single T2 lesion classified as DPA-active (B) and corresponding DVR map (C). (D and E) Example of T2 lesion with inactive center and inactive perilesional area (D) and corresponding DVR map (E).
Correlation of Disability Trajectories with Individual Patterns of Innate Immune Cell Activation
A more severe trajectory of worsening disability, as measured by a greater 2-y EDSS step change, was significantly associated with each of the following parameters: percentage of DPA+ voxels in the NAWM (odds ratio, 1.16; P = 0.009), percentage of DPA+ voxels in T1 spin-echo lesions (odds ratio, 1.06; P = 0.036), and number of DPA-active lesions (odds ratio, 1.13; P = 0.009). None of the MRI or PET parameters was significantly associated with the EDSS level at study entry (Supplemental Table 3).
DISCUSSION
In this study, we developed an original postprocessing pipeline for 18F-DPA-714 PET images to obtain individual maps of innate immune cell activation. We showed that, compared with HCs, patients with MS are characterized by an increased activation of innate immune cells in the WM, and we were able to classify single WM lesions as either DPA-active or DPA-inactive. This novel approach allowed us to identify individual profiles of innate immune cell activation that correlated with patient-specific trajectories of worsening disability, regardless of the form of the disease.
At the whole-group level, our results confirmed the notion that, compared with HCs, patients with MS have an increase in microglial or macrophage activation in the WM (8,9). In patients, the percentage of DPA+ voxels showed a gradient that increased from the NAWM to the perilesional and lesional WM, with the highest level of activation of innate immune cells being found in WM plaques. Interestingly, the greatest variability in the percentage of DPA+ voxels was found in T1 spin-echo hypointense lesions. This finding confirms that a heterogeneous pathologic substrate could underlie the hypointense appearance of lesions on T1 spin-echo sequences. Although acute lesions could appear as transient hypointensities on T1 spin-echo sequences (22), the general consensus is that T1 spin-echo hypointensities in subacute and chronic lesions mostly reflect irreversible tissue damage (23). Our results demonstrate that the active innate immune cell content of these T1 spin-echo hypointensities is largely heterogeneous and often drastically high (24). This finding, together with the evidence that a higher percentage of DPA+ voxels in hypointense T1 spin-echo lesions is associated with a more severe trajectory of worsening disability suggests that a subset of these T1 spin-echo hypointensities could be chronically active and possibly play a key role in worsening disability.
A key finding of this study was that a large number of WM lesions classified as active on the basis of the 18F-DPA-714 PET findings (37.1% of T2 lesions) were completely invisible on gadolinium-enhanced MRI sequences (only 0.2% of T2 lesions). These results suggest that our innovative post-processing approach to the 18F-DPA-714 PET data allows detection of subacute and chronic active lesions regardless of the form of clinical evolution. It is known that the quantification of WM lesion number and volume has a limited predictive value on worsening disability, especially in progressive MS. This knowledge has widely supported the notion that disability progression evolves mostly independently of lesions. Offering the opportunity to move beyond lesion volume and to investigate the biologic content of lesions, 18F-DPA-714 PET now allows us to revisit the contribution of plaques to worsening disability in MS.
We found that a higher number of DPA-active lesions, and an increased percentage of DPA+ voxels in T1 spin-echo hypointense lesions and in the NAWM, were significantly associated with a greater progression of clinical disability over the 2 y preceding study entry, regardless of the form of the disease. These data indicate that a strong activation of the innate immune system inside WM lesions and in the NAWM may represent an imaging correlate of an ongoing clinical trajectory characterized by a rapid accumulation of disability in all forms of the disease.
Our results are in line with postmortem studies showing a substantial innate inflammatory activity within lesions throughout the course of the disease (25). Interestingly, in their large postmortem study, Luchetti et al. found that a higher proportion of WM lesions with accumulation of HLA+ microglia or macrophages at the lesion border, suggestive of smoldering lesions, was the most relevant predictive marker of worsening disability (25).
Taken together, this postmortem evidence and our imaging data converge toward the identification of highly activated innate immune cells both in WM lesions and in the NAWM as a key pathophysiologic component associated with a severe clinical trajectory in patients with MS. Our in vivo data also raise the hypothesis that, over the course of the disease, a primary activation of innate immune cells inside some WM lesions that does not subsequently resolve can result in a persistent inflammation that predominates at lesion borders, with or without the persistence of active cells inside the lesion (4,26). These subacute inflammatory processes, in turn, may be responsible for a centrifugal innate immune cell activation of the NAWM that, in turn, may drive a cascade of neurotoxic mechanisms, including oxidative stress, energy dysregulation, and excitotoxicity (27). This sequence of events may eventually result in the development of neuronal degeneration, spreading from lesions to normal-appearing tissues.
A careful interpretation of our results is required with regard to the suboptimal specificity of TSPO tracers, which are known to bind to active innate immune cells but also to astrocytes and endothelial cells (15,28). Moreover, in our study we defined a threshold to classify DPA+ voxels, which depends on the same patients to whom it was then applied and thus might constitute a possible bias. However, to validate the threshold that identifies DPA+ voxels, we further applied a leave-one-out approach, repeating 37 times the Randomize procedure, each time excluding a different patient from the analysis: we found that this process generated thresholds identical to the ones computed in the original permutation-based analysis.
CONCLUSION
Generating in vivo individual maps of innate immune cell activation on the basis of TSPO PET findings, we demonstrated that activation of innate immune cells inside WM lesions and in the NAWM is associated with clinical trajectories in patients with MS. TSPO PET has the potential to shed light on the role played by microglia in neurodegeneration. Whether TSPO PET can be used as a biomarker to identify patients likely to enter into a severe clinical trajectory should be confirmed through prospective studies.
DISCLOSURE
This study was funded by ANR grant MNP2008-007125 to Bruno Stankoff and received additional funding from ARSEP, ECTRIMS, JNLF, and FRM. APHP sponsored the study. No other potential conflict of interest relevant to this article was reported.
KEY POINTS
QUESTION: Do individual maps of innate immune cell activation generated from 18F-DPA-714 TSPO PET reflect trajectories of worsening disability in patients with MS?
PERTINENT FINDINGS: Individual maps of innate immune cell activation generated from dynamic 18F-DPA-714 PET images in a cohort of 37 patients with MS showed a gradient of binding that increased from the NAWM to the WM lesions. The number of lesions characterized by innate immune cell activation and the extent of activation in the NAWM were significantly associated with a more severe clinical trajectory in patients with MS.
IMPLICATIONS FOR PATIENT CARE: Individual mapping of 18F-DPA-714 PET images may provide a promising biomarker to identify patients at risk to enter into a severe clinical phase of the disease.
Acknowledgments
We thank the CIC ICM in Paris, the SHFJ CEA in Orsay, the CENIR, and the URC of Pitié Salpêtrière.
Footnotes
↵* Contributed equally to this work.
Published online Jan. 31, 2020.
- © 2020 by the Society of Nuclear Medicine and Molecular Imaging.
REFERENCES
- Received for publication May 25, 2019.
- Accepted for publication November 19, 2019.


