


Abstract
The purpose of the study was to evaluate the 6-[18F]fluoro-l-dopa (FDOPA) kinetics with PET in patients with treated melanoma metastases and to compare it with the standard tracer 18F-FDG as well as with the perfusion tracer 15O-water in selected cases. Methods: The study included 11 patients (22 lesions) with pretreated metastatic melanomas. Dynamic studies with FDG and in selected cases with 15O-water (eight patients) preceded the FDOPA study. A one-tissue-compartment model was used for the evaluation of the FDOPA and 15O-water studies, and a two-tissue-compartment model and Patlak analysis were used for the FDG data. A noncompartment model based on chaos theory was used for calculating fractal dimension, which is a parameter for heterogeneity. Results: The FDG studies showed a 1.5-fold increased uptake in comparison with surrounding tissue in 19 of 22 metastatic lesions (sensitivity of 86.4%). False-negative FDG results were obtained in 2 patients (three lesions). FDOPA uptake was enhanced in 14 of 22 metastatic lesions (sensitivity of 64%). FDG uptake was 1.5-fold higher than FDOPA uptake in 18 of 22 metastases from melanoma, whereas FDOPA uptake was 1.5-fold higher than FDG uptake in 2 patients with liver metastases. The data did not show a statistically significant correlation between the transport constant (K1) for FDOPA and that for FDG or between the standardized uptake value for FDOPA and FDG in metastases. No statistically significant correlation was found between K1 for FDOPA and that for 15O-water. The data show that FDOPA uptake is not perfusion dependent and provides different information from FDG. The fractal dimension was similar for all tracers within the tumor region. Detectability of metastases was enhanced when both tracers were used (sensitivity of 95%). Conclusion: In patients with negative FDG findings, FDOPA can help to identify viable melanoma metastases and thus may help to select patients who would benefit from further treatment.
The PET technique with 18F-FDG has found increasing use in oncology because it allows functional imaging of viable tumor tissue. One problem with FDG PET is the low specificity for differential diagnosis. It was recently shown that FDG accumulates not only in malignant tumors but also in inflammatory lesions (1). Although this diagnostic problem may be solved with other diagnostic procedures, major problems exist in patients receiving chemotherapy. Metabolic studies with FDG PET have been used in a limited number of patients for the assessment of chemotherapeutic effects (2). A limitation of FDG PET is the delineation of treated metastases against the surrounding tissue, which affects the quantification of the tumor metabolism. Treated liver metastases may show a hypometabolic area in the center of the lesion as a result of a necrosis and a rimlike uptake in the tumor periphery. Some treated liver metastases show a liver-equivalent uptake and cannot be delineated from the normal liver parenchyma (3). This problem occurs not only for liver metastases but generally for pretreated lesions if the tumors have a low growth rate. The use of different PET tracers may help to gain further information about the biologic nature of the tumors and to reduce false-negative results. Amino acids such as 11C-methionine, 11C-aminoisobutyric acid, and 18F-tyrosine have been used in brain tumors, hypopharynx carcinomas, lymphomas, and soft-tissue sarcomas as single tracers or as multitracers in combination with FDG.
Pretreated melanoma lesions can cause diagnostic problems at restaging if the FDG uptake is low and equivalent to the surrounding tissue. In this situation, a new radiopharmaceutical that can provide further information about a lesion is needed. The detection of viable tumor tissue after chemotherapy is essential for the optimization and individualization of therapy management. We used 6-[18F]fluoro-l-dopa (FDOPA) in pretreated patients with metastatic melanoma in combination with 15O-water and FDG to gain more information about tumor biology. The study aimed to examine the use of FDOPA in detecting metastatic melanoma and to determine if the uptake is primarily an indicator of transport or metabolism of the radiopharmaceutical.
Tyrosine is a well-known amino acid used for melanin formation. The amino acid is transported into the cells and transformed to dihydroxyphenylalanine (DOPA). DOPA has two different metabolic pathways (4). 3,4-DOPA can be converted to melanin by the enzyme phenoloxidase through phenylalanine-3,4-quinone (dopaquinone). This enzyme is responsible for the complete conversion of DOPA to melanin. After five metabolic steps, melanin is formed after a polymerization reaction of indole-5,6-quinone. With 11C-l-DOPA labeled in the β position, the radioactive label follows the molecule through decarboxylation to dopamine (5). We used FDOPA, labeled in the 6-position of the aromatic ring, to study the transport and possible metabolism of the tracer in patients with metastatic melanomas. It is assumed that FDOPA provides primarily transport information because the 18F label is likely to be removed after the first metabolic step. Besides the formation of melanin in the presence of the enzyme phenoloxidase, another metabolic pathway for DOPA exists and is mainly used in neuroendocrine tumors. l-DOPA can be converted by the enzyme DOPA decarboxylase to dopamine. The fact that neuroendocrine tumors, like carcinoids or endocrine tumors, can take up and decarboxylate catecholamine precursors such as DOPA was the reason that some investigators used 11C-l-DOPA in a few patients with pancreatic endocrine tumors (5–7).
Some experimental data are already available for the use of DOPA for melanomas. Ishiwata et al. (8) showed a high uptake of FDOPA in experimental studies using rats that received transplanted B18 melanoma cells. Van Langevelde et al. (9) revealed for the first time the importance of 11C-l-DOPA for diagnosing malignant melanoma on the basis of experimental data. Kubota et al. (10) showed a preferential accumulation of FDOPA in cells of the S-phase in rats that received transplanted B16 melanoma cells. However, no patient studies have been done.
MATERIALS AND METHODS
Patients and Data Acquisition
The evaluation included 11 patients with 22 metastases from metastatic melanoma (14 liver, 3 subcutaneous, 2 lymph node, and 3 spleen metastases). All melanoma patients were pretreated with combined immunochemotherapy with dacarbacine and α-interferon before the PET study. All metastases already had been found by other diagnostic procedures (CT, sonography) and were followed during therapy by the referring physicians. PET was performed to detect residual viable tumor tissue to support the decision about further treatment. At least 4 wk elapsed between the last immunochemotherapeutic cycle and the PET studies. Because of the limited sensitivity of FDG in treated melanomas, FDOPA was used in addition to the basic 15O-water and FDG study to improve the diagnostic information. Referring physicians and patients were informed about the diagnostic problems and the aim of the multitracer approach. Informed consent was given by each patient. The study was performed in accordance with the institutional review board.
The patients were examined twice on two different days within 1 wk. PET studies were performed as multitracer studies using the sequential application of 15O-water and FDG in the first study and FDOPA in the second study. First, 800 MBq 15O-water were applied intravenously followed by a dynamic acquisition of 8 min (4 frames of 0.5 min, 6 frames of 1 min). Then, 370–444 MBq FDG were injected, and dynamic studies were performed over 60 min (5 frames of 2 min, 10 frames of 5 min). The dynamic FDOPA studies were performed after injection of 370–444 MBq using a 60-min (5 frames of 2 min, 10 frames of 5 min) protocol. Of the 11 patients, 8 were examined with all three tracers, whereas 3 were examined with FDG and FDOPA.
15O-water was produced using the procedure described by Del Fiore et al. (11). FDG was prepared by the Toorongian method (12). FDOPA was produced by a method described by Luxen et al. (13,14) based on labeling by regioselective fluorodemetalation. FDOPA was obtained with a chemical and radiochemical purity ≥ 98%.
We used a dedicated PET system (ECAT HR+; Siemens Co., Erlangen, Germany) based on the block detector technology with a craniocaudal field of view of 15.3 cm, which was operated in septa-extended, two-dimensional mode. The system provides for the acquisition of 63 transversal slices simultaneously with a slice thickness of 2.4 mm. The system consists of four rings, and each of the rings has 72 bismuth germanate detector blocks. A single block detector is divided into an 8 × 8 matrix with 576 detectors. The crystal size of a single detector element is 4.39 × 4.05 × 30 mm. Transmission scans for a total of 10 min were obtained with three rotating germanium pin sources before the first radionuclide application to obtain cross sections for the attenuation correction of the acquired emission tomographic images.
The PET data were transfered by file transfer protocol to the Pentium systems (Intel Corp., Santa Clara, CA), and a Web interface was used to start and distribute the reconstruction jobs on different computer systems (15). All PET images were iteratively reconstructed as well as scatter and attenuation corrected (16). PET cross sections with an image matrix of 256 × 256 pixels (pixel size, 2.277 × 2.777 × 2.425 mm) were reconstructed using an iterative reconstruction algorithm (weighted least squares method, ordered subsets, four subsets, six iterations) running on a Pentium platform and Windows NT 4.0 (Microsoft Corp., Redmond, WA).
Data Analysis
The dynamic PET data were evaluated using the software package PMod (provided by cooperation with the University of Zurich, Switzerland) (17,18). Time–activity curves were created using volumes of interest (VOIs). A VOI consists of several regions of interest (ROIs) over the target area. Irregular ROIs were drawn manually. To compensate for patient motion during the acquisition time, the original ROIs were visually repositioned but not redrawn. In general, a detailed quantitative evaluation of tracer kinetics requires the use of compartment modeling. Patlak analysis and a two-tissue-compartment model are the standard methodology for the quantification of dynamic FDG studies of the brain and whole-body area, as in liver metastases (19,20). Perfusion studies with 15O-water can be evaluated using a one-tissue-compartment model (21). However, to our knowledge, no data exist for a detailed quantification of dynamic DOPA studies in tumors. For the basic analysis, we used the semiquantitative approach based on the calculation of a distribution value, for which the term “standardized uptake value” (SUV) was introduced by Strauss and Conti (22): SUV = (tissue concentration [MBq/g])/(injected dose [MBq]/body weight [g]). The 55- to 60-min uptake values served for the quantification of the FDG and FDOPA data.
One problem in patient studies is the accurate measurement of the input function, which theoretically demands arterial blood sampling. Another problem specific for liver metastases is the double blood supply of the liver through the hepatic artery and the portal vein. A study by Ohtake et al. (23) showed that the input function can be retrieved from the image data with acceptable accuracy. We used compartment analysis to gain more information about the tracer distribution. For the input function, we used the mean value of the VOI data obtained from a large arterial vessel. A vessel VOI consisted of at least 10 ROIs in sequential PET images. In most patients, this vessel was the descending aorta, because the spillover from other organs is low and the descending aorta extends from the upper thorax to the lower abdomen. A partial-volume correction was not done because the recovery coefficient is >0.9 for lesions exceeding 1.5 cm in diameter. The transport constant K1 and the rate constant k2 were calculated using a one-tissue-compartment model for 15O-water and FDOPA based on a method implemented in the PMod software taking into account the vascular fraction (VB) in a VOI. (VB is associated with the volume of blood exchanging with tissue.) The dynamic FDG data were evaluated using a two-tissue-compartment model and Patlak analysis to calculate the FDG influx constant. The metabolic rate of glucose was not calculated because of the high variation of lumped constant. The transport constant K1 and the rate constants k2, k3, and k4 of the two-tissue-compartment model were evaluated, as well as the vascular fraction for FDG. The unit used for K1, k2–k4, and FDG influx is 1/min. The values for VB vary from 0 to 1. Details about the applied compartment models are described elsewhere (18).
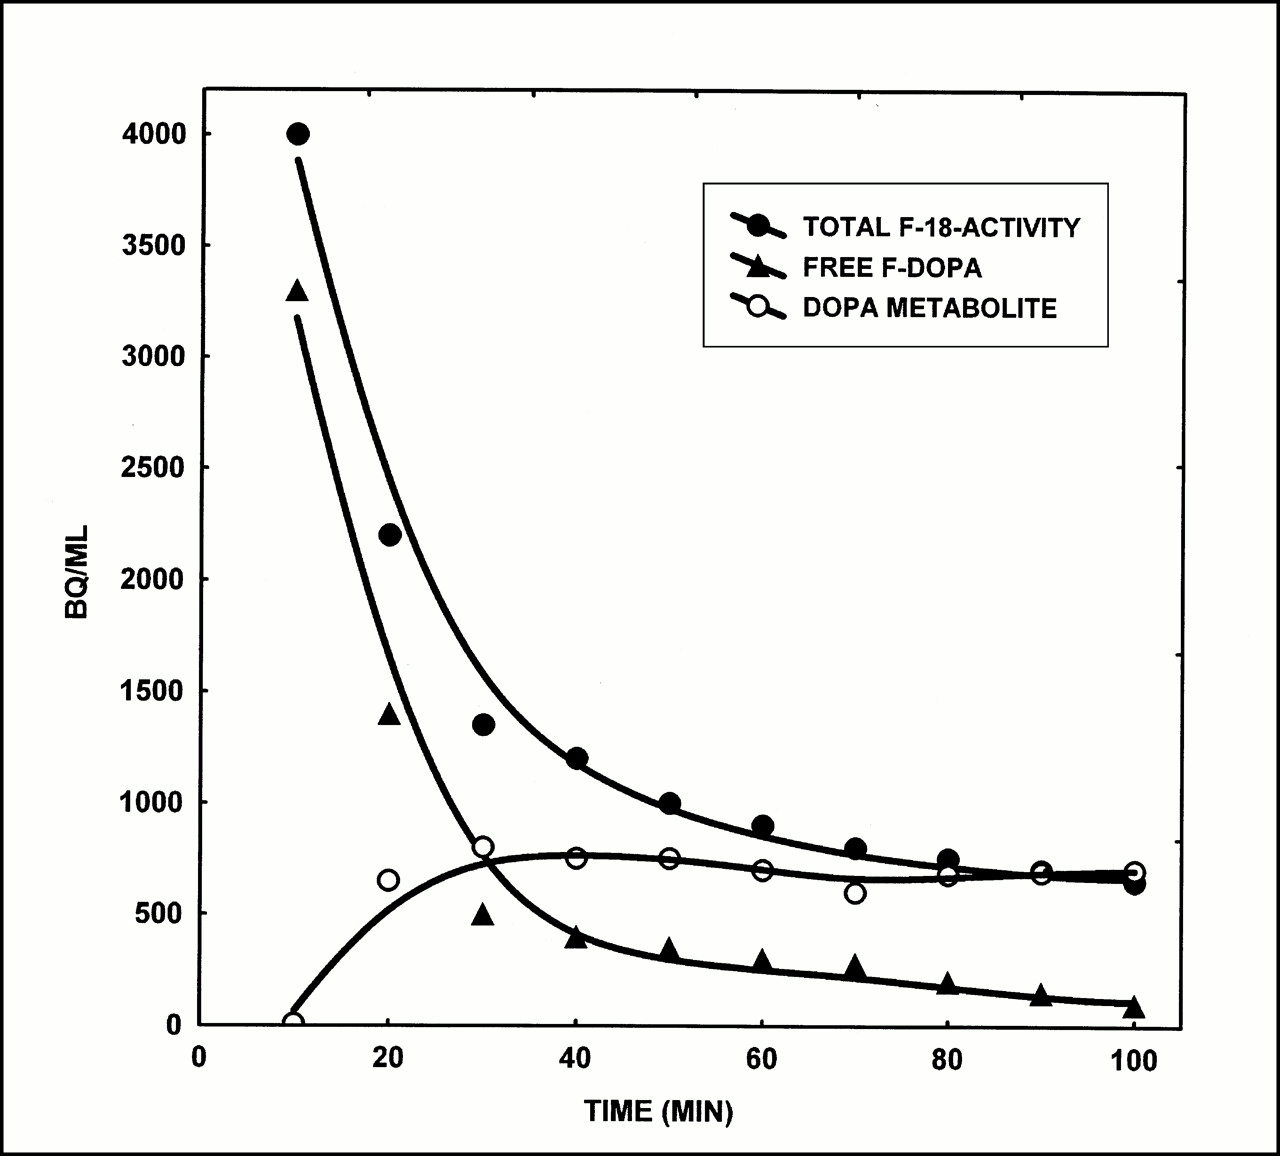
Venous blood samples were drawn every 10 min for a total of 100 min in one patient with metastatic melanoma during the FDOPA dynamic data acquisition, which was extended to 100 min to comply with the blood sampling. The purpose was to measure free FDOPA, 18F-fluoride, and possible metabolites in the plasma using high-performance liquid chromatography (HPLC).
In addition to the compartment analysis, we used a noncompartment model based on the fractal dimension (24). As already shown by other investigators, the fractal dimension is a parameter for the heterogeneity. It was recently shown that the fractal dimension is an appropriate procedure to describe the heterogeneity of blood flow in animal models (25). We implemented a Java-based module in the Pmod software to calculate the fractal dimension for the time–activity data (26). The program is based on the box-counting method (24). The fractal dimension varies from 0 to 2, and it is a parameter for a deterministic or more chaotic distribution of the tracer activity. For this purpose, no input function is needed.
Statistical evaluation of the data was performed using the Statistica software package (version 6.0; StatSoft Co., Hamburg, Germany) on a personal computer (Pentium II 450-MHz double processor; 512 MB random access memory) running with Windows NT (version 4.0). Descriptive statistics, correlation matrices using the Pearson product moment correlation, and box–whiskers plots were used for data analysis. We used a decision level of P < 0.05.
RESULTS
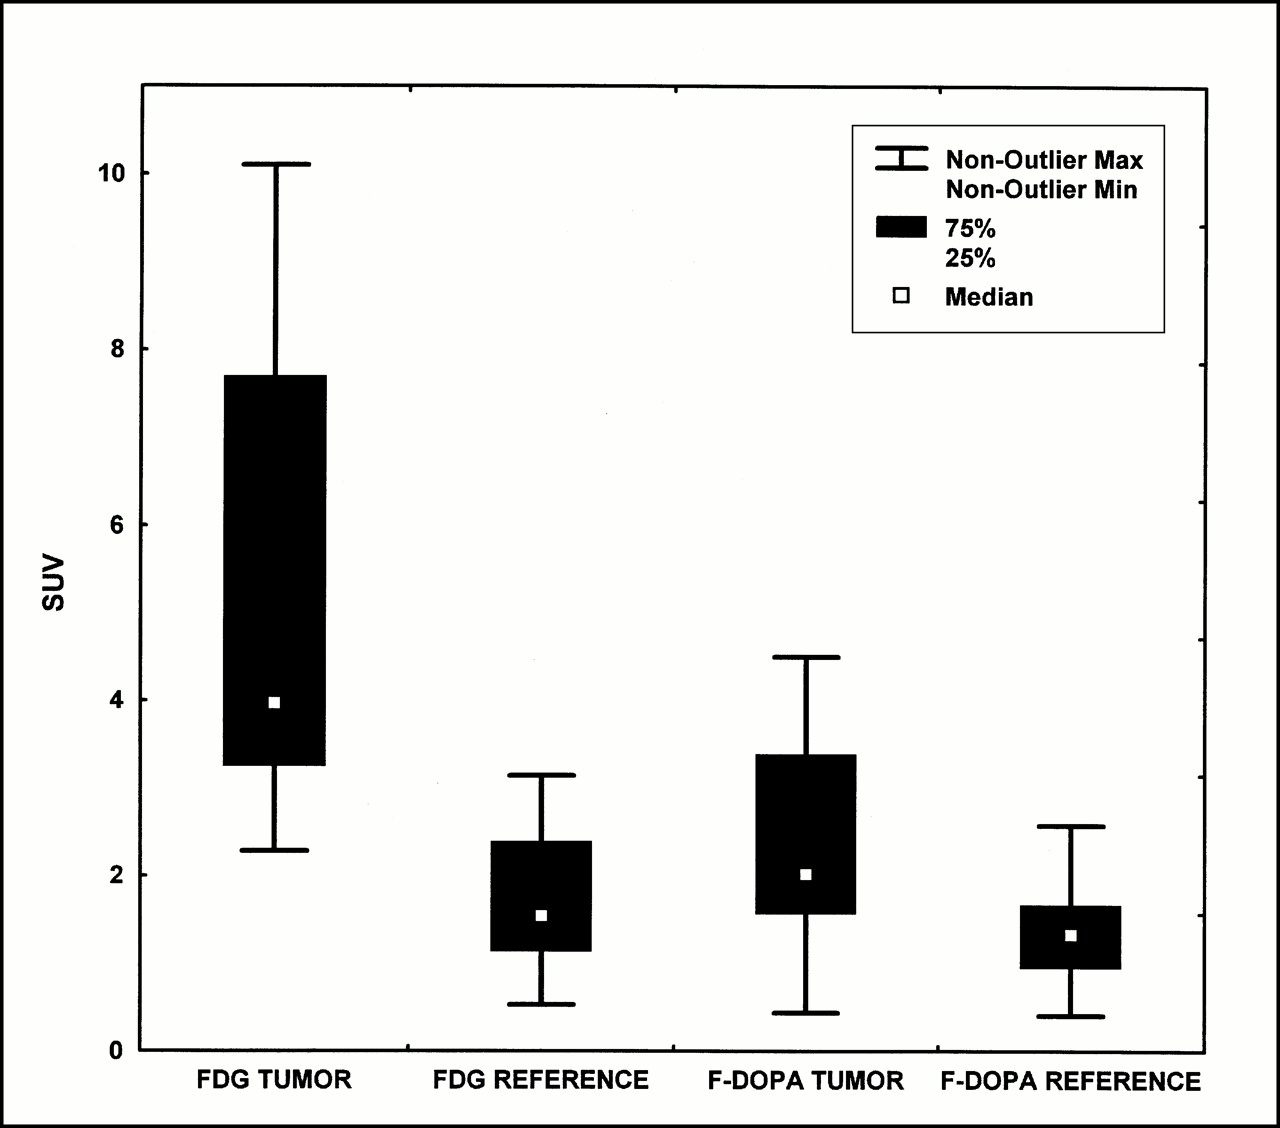
This study included 11 patients with metastatic melanoma and 22 metastatic lesions: 14 liver metastases, 3 subcutaneous metastases, 2 lymph node metastases, and 3 spleen metastases. The FDG studies showed a 1.5-fold increase of tracer uptake 60 min after injection in comparison with the surrounding tissue in 19 of 22 metastatic lesions. The mean FDG uptake 60 min after injection (FDG SUV) was 5.2 SUV (2.3–10.1 SUV) for the melanoma metastases, whereas the mean FDOPA uptake 60 min after injection (FDOPA SUV) was 2.34 SUV (0.4–4.5 SUV) in the metastatic lesions (Table 1). Two patients with three metastases (two liver metastases and one spleen metastasis) did not show an enhanced FDG uptake (false-negative). The FDOPA scans showed a 1.5-fold enhanced tracer uptake 60 min after injection in comparison with the surrounding tissue in 14 of the 22 metastases from melanoma. FDOPA uptake at 60 min after injection was higher than FDG uptake at 60 min after injection in two liver metastases of one patient.
Descriptive Statistics of Evaluated Kinetic Parameters for Three Tracers in Metastases
We analyzed blood samples of one patient during the dynamic FDOPA study. The data are presented in Figure 1 and show a decline of free FDOPA in plasma with time and a slow increase of a metabolite (18F-O-methyl-DOPA) of the tracer. No free 18F-fluoride was observed with HPLC. Both substances were measured with HPLC. We used the data obtained from the HPLC analysis for the input in a two-tissue-compartment double-input model (27). The HPLC data of the free FDOPA and the main FDOPA metabolite (18F-O-methyl-DOPA) served as input functions. The total 18F activity concentration as measured by HPLC in plasma samples and the activity concentration obtained from the aortic VOI in the dynamic FDOPA PET study were correlated. Because the total 18F activity as measured by HPLC in plasma is a sum of free FDOPA and its metabolite, the total activity data of the aortic VOI as measured by PET were split into nonmetabolized (free) FDOPA and the FDOPA metabolite according to the plasma sample data. We noted an increased K1 for both free FDOPA and its metabolite, whereas k3 and k4 were equivalent to zero. The results show that both nonmetabolized FDOPA and the FDOPA metabolite may enter the tumor cells. Therefore, a one-tissue-compartment model, summarizing FDOPA and its metabolite as the input function, may be used to simplify data analysis.

Plasma time–activity curves of total 18F activity, free FDOPA, and DOPA metabolite 18F-O-methyl-DOPA (Bq/mL) measured with HPLC in 10 venous blood samples during dynamic FDOPA PET acquisition in one patient. Note decrease of total free FDOPA activity in plasma followed by increase of uptake of FDOPA metabolite in plasma.
The FDG and FDOPA uptake of the metastases and reference tissue are presented in Figure 2. The transport and rate constants (1/min) as well as the VB of all tracers in the metastases are presented in Figure 3. The data show highly variable values for K1 (0.330–1.451) and k2 (0.250–1.319) for FDG, as well as for k3 (0.003–0.192), k4 (0–0.032), and FDG influx (0.007–0.129), as revealed in Figure 3A and Table 1 when the absolute values are compared. The values of K1, k2, and VB were less variable for FDOPA, except for two metastases showing extremely high K1 values (Fig. 3B). In contrast to FDOPA, the ranges for K1 and k2 for water were highly variable (Fig. 3C).

Box–whiskers plot of median FDG uptake (SUV) at 60 min after injection and median FDOPA uptake (SUV) at 60 min after injection for melanoma metastases (n = 22) and reference tissue. Max = maximum; Min = minimum.

(A) Box–whiskers plot of median values of transport constant K1 (1/min) and rate constants k2–k4 (1/min), influx (1/min), and VB of FDG kinetic data for evaluated metastases. (B) Box–whiskers plot of median values of transport constant K1 (1/min), rate constant k2 (1/min), and VB based on kinetic DOPA data in metastatic lesions. (C) Box–whiskers plot of median values of transport constant K1 (1/min), rate constant k2 (1/min), and VB based on kinetic 15O-water data in metastatic lesions. Max = maximum; Min = minimum.
The fractal dimensions of the time–activity data in metastases for all tracers are presented in Figure 4. Although we did not observe significant differences for the median values of the fractal dimension for the tracers, we noted less variation for FDG compared with the other tracers. One metastasis showed a low fractal dimension for FDOPA and for 15O-water.

Box–whiskers plot of median values for fractal dimension of tracers FDG, FDOPA, and 15O-water in all evaluated metastatic lesions. Max = maximum; Min = minimum.
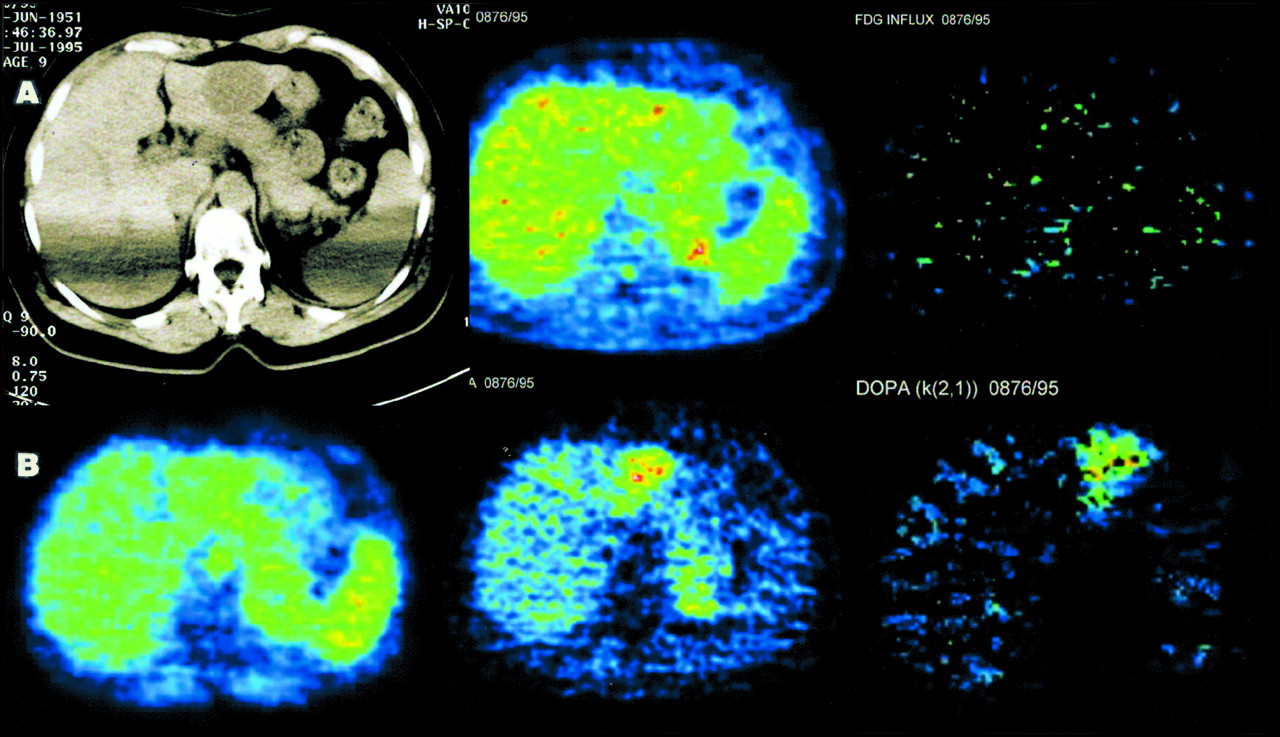
One triple tracer study in a patient with a liver metastasis is shown in Figure 5. Parametric images were calculated to visualize the influx and K1. The parametric images reveal no significant FDG influx (using the Patlak method), which is in accordance with the 55- to 60-min SUV image. The K1 image for FDOPA shows a high transport of FDOPA in the metastasis in the left liver lobe. This finding is comparable with the 55- to 60-min SUV FDOPA image. In this patient, only FDOPA gave evidence for active tumor tissue and avoided a false-negative result on the basis of the FDG study.

(A) (Left) CT image without contrast material of patient with known metastasis of malignant melanoma shows hypodense lesion in left liver lobe. Artifacts are caused by positioning of arms beside body (identical positioning to PET). Patient received several cycles of combined immunochemotherapy (dacarbacin/α-interferon) and was referred for PET to exclude residual viable tumor tissue. (Middle) FDG image at 60 min after injection (transversal slice corresponding to CT image) shows liver-equivalent uptake of tracer in metastasis. (Right) Parametric image of FDG influx (according to Patlak procedure) shows low influx in metastatic lesion. (B) (Left) Perfusion image (summed image, 0–5 min) after intravenous injection of 15O-water shows liver-equivalent perfusion of metastasis. (Middle) FDOPA image at 60 min after injection reveals increased accumulation of amino acid in metastasis. (Right) Parametric image of K1 for FDOPA using one-tissue-compartment model shows preferential DOPA transport in metastasis.
Mean, median, minimum, and maximum values, as well as the SD for K1, k2–k4, and VB, are given in Table 1. SUVs for all tracers in the evaluated metastases and the reference tissue are given as well.
A Pearson product moment correlation square matrix was used to analyze the dynamic data of all tracers. A significant correlation was observed for the FDG influx and the 60-min FDG SUV (r = 0.679; P = 0.003). The global uptake of FDOPA (SUV) revealed no statistically significant correlation with the global uptake of FDG expressed in SUV (r = 0.175; P = 0.947). VB for FDOPA and FDG shows a correlation coefficient of 0.577 for P = 0.015, which is significant. No statistically significant correlation was seen between K1 for FDOPA and K1 for FDG (r = 0.037; P = 0.887). We noted a low correlation for K1 for FDOPA and FDG SUV (r = 0.539; P = 0.026). The data failed to show a significant correlation between K1 for FDOPA and K1 for 15O-water (r = 0.560; P = 0.058). We found a significant correlation between K1 for 15O-water and VB for FDG (r = 0.793; P = 0.001), as well as between VB for 15O-water and k3 for FDG (r = 0.617; P = 0.019).
DISCUSSION
FDG PET is a well-accepted method for the primary diagnosis and staging of patients with malignant melanoma. The sensitivity reported in the literature using a dedicated PET scanner exceeds 89% (28–30). However, malignant lesions may be missed (false-negative), or some benign lesions may be classified as malignant because of an enhanced FDG uptake (false-positive). False-negative results have been reported for small lesions with a diameter > 0.3–0.5 cm, for example, subcutaneous metastases (31,32), lymph node metastases (33), or lung metastases (34). Furthermore, false-negative results may be caused by previous chemotherapeutic treatment or radiation therapy. Wiesner et al. (35) reported on a melanoma patient with multiple liver metastases noted in MRI and sonography, whereas FDG PET revealed no significant uptake. False-positive results may be caused by inflammatory lesions (1,31).
Altered biochemical processes in malignant tissue, such as enhanced glycolysis, enhanced DNA synthesis, and enhanced amino acid transport, can be examined with dedicated tracers and used for differential diagnosis and therapy management. FDG is still the tracer of choice for oncologic questions because the glycolysis is enhanced in malignant tissue and can be easily detected. Other parameters such as the proliferation rate of tumor cells were assessed using dedicated tracers, for example, 11C-thymidine, 18F-deoxyuridine, or, more recently, 18F-fluorodeoxythymidine (36,37). Both α-aminoisobutyric acid and aminocyclopentanecarboxyl acid are synthetic amino acids, which primarily show the alaninelike and leucinelike amino acid transport. The advantage of these amino acids is a clear signal showing only the transport capacity of the tumor and no further metabolic steps.
The amino acid DOPA is a precursor of melanin. The metabolism of DOPA to melanin and the ability to label DOPA with the positron-emitting isotope 18F offer a unique method of specific tumor imaging. The incorporation of tyrosine and DOPA was examined by Van Langevelde et al. (9) in Syrian golden hamsters with Greene melanoma. The authors used 11C-l-DOPA and compared the biodistribution of the 11C radiopharmaceutical with the same compound labeled with 14C. Extraction of the tumor tissue showed that 11C-l-DOPA was mainly incorporated into melanin, whereas 11C-d-DOPA was not. Bergström et al. (5) emphasized the importance of the labeling technique. With 11C-l-DOPA labeled in the β position, the radioactive label follows the molecule through decarboxylation to dopamine. We used an 18F-labeled l-DOPA (FDOPA), labeled in the 6-position of the aromatic ring, which may result in removal of the label during the following metabolic steps (13,14). Interestingly, we did not observe free 18F-fluoride either in the HPLC or in the PET images. Therefore, the formation of 18F-fluoride must be below a measurable level. In contrast, HPLC was able to identify a major metabolite, 18F-O-methyl-DOPA, in the plasma. We were not able to measure k3 and k4 after fitting the HPLC data for free DOPA and DOPA metabolite (18F-O-methyl-DOPA) into a two-tissue-compartment double-input model (using the DOPA and the DOPA metabolite data measured with HPLC for the double input). The results clearly show that FDOPA uptake is a measure of transport only and not of DOPA metabolism. This fact supports the use of a one-tissue-compartment model to focus on DOPA transport.
On the basis on the literature data, we used FDOPA in patients with metastatic melanoma to assess DOPA kinetics. The study includes only patients who had received several chemotherapeutic cycles with dacarbacin and α-interferon. The FDG scans showed an increased FDG metabolism in 19 of 22 metastases of melanoma. The sensitivity of 86% is comparable with the reported rate in the literature (29,30,32). Two liver metastases and one spleen metastasis of two melanoma patients treated with combined immunochemotherapy could not be delineated on the FDG scan. Interestingly, both lesions showed a high FDOPA uptake and could be clearly delineated from the surrounding liver tissue. However, the overall sensitivity of FDOPA was 64% (14/22 lesions). This result occurred because FDOPA, labeled in the 6-position, is primarily a transport marker and is not further metabolized. The uptake of FDOPA is relatively low and equivalent to the uptake of other amino acids (e.g., tyrosine and aminoisobutyric acid), whereas FDG undergoes the first—temporarily irreversible—metabolic step, phosphorylation, which leads to higher uptake concentrations in tumor tissue. Interestingly, when both tracers were used to assess tumor viability, 21 of 22 lesions were identified (sensitivity of 95%). Therefore, PET with FDOPA should not be used as the primary tracer, but it should be considered if FDG may be false-negative.
The size of the lesions was not crucial because of the high resolution of the scanner, the contrast with the surrounding tissue, and the biochemical properties of the metastases. Even two small (8 mm) lymph nodes located in the axilla, as well as three subcutaneous metastases, could be recognized with both FDG and FDOPA because of the high contrast with the surrounding tissue. The smallest diameter of the liver and spleen metastases included in this study was 1.5 cm. Although FDG uptake in normal liver parenchyma is generally low in fasting patients, FDOPA uptake is considerable and may limit the detectability of small lesions.
The quantification of dynamic PET data is a well-discussed topic among specialists of the field. Different methods have been proposed for that purpose, but all methods have their limitations. The evaluation of the pharmacokinetic parameters using the noninvasively estimated input function is a compromise. The problem of accurate measurement of the input function for the quantification of dynamic PET data is well known. Ohtake et al. (23) compared the input function obtained from arterial and venous blood samples with the noninvasively obtained time–activity data from an ROI placed in at least seven adjacent PET slices in the descending aorta. The authors found that the input function calculated from the time–activity curves of the descending aorta correlated well with the venous sample data. In addition, the authors discussed a correction of partial-volume effects caused by the limited scanner resolution. The high resolution, the small pixel size used for reconstruction, and the use of VOIs limit the partial-volume effects in our study, and we did not attempt partial-volume correction.
The analysis of the pharmacokinetic data revealed some interesting aspects about the biochemical characteristics of the lesions. No correlation was seen for K1 of FDG and K1 of FDOPA, or for SUV of FDG and SUV of FDOPA in metastases. The data indicate that FDG and FDOPA provide different information about tumor biology. Furthermore, no statistically significant correlation was found for the perfusion measured with 15O-water and the amino acid uptake measured with FDOPA in metastases. Therefore, FDOPA uptake is not primarily perfusion dependent. The amount of blood volume in a tissue is a parameter that may modulate the uptake of a tracer. Therefore, a correlation was noted for VB of FDG and FDG influx in the metastases, whereas no correlation was observed for K1 and FDG influx, and a low correlation existed for k3 and the influx data.
The data did not show a correlation for FDG parameters K1 and k2–k4 or for global FDG uptake with perfusion measured with 15O-water in metastases. This finding agrees with the data reported by Eil et al. (38). The authors examined the relationship between FDG uptake and perfusion, as measured by 15O-water in 27 pretreated patients with metastatic malignant melanoma, and did not find a linear correlation between the two parameters. A detailed analysis of the relationship between FDG uptake and tissue perfusion was performed in patients with recurrent lymphoma, and these data revealed a nonlinear correlation in general with perfusion-dependent FDG uptake for low to moderate perfusion values (2). Therefore, perfusion is not a limiting parameter for FDG uptake if the perfusion values are high.
A new approach for the evaluation of the dynamic data is based on chaos theory. Some investigators have used the fractal dimension as a parameter for the assessment of spatial heterogeneity. Kleen et al. (25) used the fractal dimension as a scale-independent factor to measure spatial heterogeneity of blood flow. We used the fractal dimension to characterize the kinetics of each tracer in the metastases. The data did not show significant differences for the tracer distribution within a VOI, and therefore no evidence suggests a heterogeneous distribution between the tracers within a tumor VOI. The low fractal dimension indicates a more “deterministic” turnover of the tracers.
Until now, FDOPA has been used only in a few patients with pancreatic endocrine tumors and carcinoids. Ahlström et al. (6) used two different amino acids, 11C-l-DOPA and 11C-hydroxytryptophan (11C-5-HT), in the diagnosis of pancreatic endocrine tumors. 11C-l-DOPA was used in 16 patients, and 11C-5-HT was used in 6 patients. An enhanced 11C-l-DOPA uptake was found in 11 patients, 8 of whom had metastatic disease. The authors noted a heterogeneity of tracer uptake among different lesions in the same patient, for example, high uptake in some lesions and low uptake in others. The results in patients examined with both tracers correlated well. The authors did not use FDG to compare with the data. Both studies show that neuroendocrine tumors are very heterogeneous. Another PET radiopharmaceutical, 11C-hydroxyephedrine (11C-HED), was applied in 10 patients with known or suspected pheochromocytomas for tumor localization (7). Nine of 10 patients showed an enhanced 11C-HED uptake and received correct diagnoses. This may be another interesting application of FDOPA for studies of the catecholamine pathway in neuroendocrine tumors.
Although comparable patient data for the application of DOPA in patients with metastatic melanomas do not exist in the literature, these preliminary results show that in patients with treated metastases and negative FDG findings, FDOPA may be a promising tracer for the melanoma diagnosis and may help to increase the accuracy of PET for therapy management. Furthermore, it should be emphasized that FDOPA labeled in the 6-position is, according to these data, primarily a transport marker and is not further metabolized. Therefore, specific imaging of the melanin synthesis requires another labeling technique, which might allow the measurement of DOPA metabolism and not only transport. Furthermore, it is an open question if this transport marker may be a useful second-line radiopharmaceutical that would work well in other tumors.
CONCLUSION
In patients with negative FDG findings, FDOPA can help to identify viable melanoma metastases and thus may help to select patients who would benefit from further treatment.
Acknowledgments
The authors thank Dirk Schadendorf, MD, and Wolfgang Naeher, MD, of the University of Heidelberg for their cooperation, and Panagiota Mantaka, MD, Ludwig Institute for Cancer Research, Universite Catholique de Louvain, Brussels, for assisting in the PET studies. Furthermore, the authors thank Franz Oberdorfer, PhD, for the radiopharmaceutical production.
Footnotes
Received Mar. 17, 2000; revision accepted Jun. 20, 2000.
For correspondence or reprints contact: Antonia Dimitrakopoulou-Strauss, MD, Medical PET Group–Biological Imaging (E0105), German Cancer Research Center, Im Neuenheimer Feld 280, D-69120 Heidelberg, Germany.
REFERENCES
In this issue


Jump to section
Related Articles
Cited By...
- Ultrasensitive detection of malignant melanoma using PET molecular imaging probes
- Imaging Melphalan Therapy Response in Preclinical Extramedullary Multiple Myeloma with 18F-FDOPA and 18F-FDG PET
- Reduction of the Ring Size of Radiolabeled Lactam Bridge-Cyclized {alpha}-MSH Peptide, Resulting in Enhanced Melanoma Uptake
- PET of Malignant Melanoma Using 18F-Labeled Metallopeptides
- Melanin-Targeted Preclinical PET Imaging of Melanoma Metastasis
- Reproducibility of Tumor Blood Flow Quantification with 15O-Water PET
- 6-L-18F-Fluorodihydroxyphenylalanine PET in Neuroendocrine Tumors: Basic Aspects and Emerging Clinical Applications
- Synthesis and Biologic Evaluation of 64Cu-Labeled Rhenium-Cyclized {alpha}-MSH Peptide Analog Using a Cross-Bridged Cyclam Chelator
- 99mTc- and 111In-Labeled {alpha}-Melanocyte-Stimulating Hormone Peptides as Imaging Probes for Primary and Pulmonary Metastatic Melanoma Detection
- Angiostatin Overexpression in Morris Hepatoma Results in Decreased Tumor Growth but Increased Perfusion and Vascularization
- Transfer of the sFLT-1 Gene in Morris Hepatoma Results in Decreased Growth and Perfusion and Induction of Genes Associated with Stress Response
- A Gallium-Labeled DOTA-{alpha}-Melanocyte- Stimulating Hormone Analog for PET Imaging of Melanoma Metastases
- Combined 18F-FDG-FDOPA Tumor Imaging for Assessing Response to Therapy