


Abstract
Although human interpretation of 99mTc-sestamibi SPECT myocardial perfusion imaging has been repeatedly validated in the diagnostic and prognostic assessment of coronary artery disease, it remains unclear if automated computer-derived quantitative indices of perfusion have similar or independent prognostic information. Methods: We studied 718 patients referred for 99mTc-sestamibi SPECT myocardial perfusion imaging who were followed for 5.6 ± 1.1 y (mean ± SD). The SPECT studies were initially interpreted visually without benefit of computer-based analysis and were then subjected to a blinded reprocessing to extract quantitative indices of perfusion. Follow-up was through the Manitoba Population Health Research Data Repository. Acute myocardial infarction or cardiac death occurred in 79 individuals (11.0% of the cohort). Results: Visual and quantitative categorization of scan perfusion abnormalities showed similar prognostic value for predicting acute myocardial infarction or cardiac death. Discordance between the visual and quantitative categorizations defined a group at intermediate risk. There was a gradient of risk with increasing severity of the summed stress score (SSS) or summed difference score (SDS). The automated SSS and SDS provided incremental prognostic information over that obtained from visual interpretation. Conclusion: Automated quantification of 99mTc-sestamibi SPECT myocardial perfusion scans provides objective prognostic information and may complement the conventional visual image interpretation.
Myocardial perfusion imaging with nuclear tracers is well established in the diagnosis and prognostic assessment of patients with known or suspected coronary artery disease (CAD) (1). More extensive perfusion abnormalities are associated with more severe CAD and a greater risk for important cardiac events. The summed stress score (SSS) is a commonly used semiquantitative technique that combines the extent and severity of perfusion abnormalities into a single measure and has been shown to provide risk stratification in patients undergoing SPECT myocardial perfusion imaging (2). Most studies examining SSS as a prognostic tool have relied on a visual grading system. More recently, computer software has emerged for computing the SSS with minimal operator intervention, and we have previously reported close agreement between the visual and quantitative assessments of perfusion (3). One widely used software package (QPS AutoQUANT; ADAC Laboratories) has been reported to provide valid prognostic stratification (4–6). These reports come from the center that developed the commercial package and used rest 201Tl/exercise 99mTc-sestamibi dual-isotope myocardial perfusion SPECT. It is important to verify that the automated SSS will perform as well in other centers and patient populations using 99mTc-sestamibi, single-isotope SPECT. Our objective was to assess the ability of the automated SSS to predict important clinical cardiac events and to determine whether that information was additive to the visual assessment.
MATERIALS AND METHODS
Study Population
The population for this retrospective analysis was selected from 1,027 consecutive patients who had nuclear perfusion stress testing performed at St. Boniface General Hospital between January 1, 1994, and April 20, 1999, on a single imaging system (Elscint 409). The vast majority of these scans (>90%) were performed before 1997, since, after this date, the camera was used only as a back-up system. Patients were excluded if the scan was limited to planar images (n = 3), if images could not be reprocessed due to corrupted archive media or poor-quality image data (n = 104), or if all imaging was not complete on the designated camera (n = 33). Additional patients were excluded if the stress test was not a standard protocol (nitroglycerine sestamibi viability scanning or dobutamine stress, n = 4), the patient was not a Manitoba resident (n = 35), or personal identifier information was insufficient to allow for unambiguous linkage to the Manitoba Population Health Research Data Repository (n = 105). For patients who underwent >1 scan during the study period, we used only the first scan (n = 25). This left 718 patients for subsequent analysis. Approval for this study was granted by the Health Research Ethics Board of the University of Manitoba, by the Health Information Privacy Committee of Manitoba Health, and by the Research Review Committee at St. Boniface General Hospital.
Stress Protocols and Imaging
The stress procedures used in our laboratory have been previously published (3,7). Most of the tests were performed using a 2-d protocol (n = 679), with a small number of patients performing same-day stress testing (n = 39). Whenever possible, β-blockers and calcium-channel antagonists were discontinued 24–48 h before testing and nitrate compounds were also stopped at least 6 h before testing. Treadmill exercise was symptom limited, with exercise intensity adjusted to match the patient’s exercise capacity. At peak exercise the patient was injected with 99mTc-sestamibi followed by 1–3 min of exercise after injection. If the patient was deemed unsuitable for exercise stress, dipyridamole (0.56 mg/kg) was administered via continuous intravenous infusion over 4 min with 99mTc-sestamibi injection after a further 4½-min delay. If possible, supplementary treadmill exercise was performed after dipyridamole infusion. Supine, nongated SPECT images were acquired approximately 30–60 min after stress and 45–75 min after a resting injection.
Image Interpretation
The original scan images were processed and reconstructed using conventional vendor software and reviewed on both the computer workstation and on single-emulsion film. The initial clinical interpretation was provided by a pair of nuclear medicine specialists with extensive training and experience in cardiac nuclear medicine who jointly reviewed and reported each scan. At the time of the initial reading, the results were categorized as normal, equivocal, abnormal with fixed defects, abnormal with fully reversible defects, or abnormal with partially reversible defects. For the subsequent analysis, the “equivocal” category was combined with the “normal” category. No image quantification was available at the time of the initial interpretation.
The archived scan data was retrospectively reprocessed using recently developed analysis software (AutoSPECT [Cedars-Sinai Medical Center] and QPS AutoQUANT). Briefly, this commercial package consists of 3 software modules that determine reconstruction limits for the projection dataset, reconstruct the projection images into transaxial images using standard filtered backprojection, and then reorient the transaxial images into short-axis images. Quantitative defect extent and severity are defined from sex-specific normal limits, and an SSS is obtained by adding the scores of the 20 segments (0 = normal to 4 = absent uptake) of the stress sestamibi images. A similar procedure is applied to the resting images to calculate the summed rest score (SRS). The summed difference score (SDS) represents the difference between the stress and rest scores and is taken to be an index of ischemic burden. The software processing and quantitative analysis were performed without reference to the initial visual interpretation or knowledge of the patient outcomes. An SSS ≤ 3 was considered normal for the quantitative assessment, whereas an SSS > 4 was taken as abnormal (8). Abnormal scans were classified as mildly abnormal (4–7), moderately abnormal (8–13), and severely abnormal (>13). An SDS ≤ 2 was considered to show no ischemia, whereas an SDS > 2 was taken to show ischemia. The extent of ischemic burden was classified as mildly abnormal (2–5), moderately abnormal (6–7), and severely abnormal (>7) (9).
Patient Follow-Up
Follow-up was performed through the Manitoba Population Health Research Data Repository. The Manitoba Department of Health (Manitoba Health) provides comprehensive health care coverage for residents of the province of Manitoba. Since Manitoba residents are not obliged to pay premiums for health care coverage, nonparticipation in the plan is rare. Manitoba Health maintains computerized databases of the physician services and hospitalizations provided for all persons registered with the system. Each physician service record includes information on the identity of the patient, the date of service, services provided, and a diagnosis, which is subsequently coded to a 3-digit International Classification of Disease-9-Clinical Modification (ICD-9-CM) code. After each hospitalization, a detailed abstract is created that includes up to 16 diagnoses, which are coded to 5-digit ICD-9-CM codes. More recently, pharmacy-based prescription data for the province have been collected through the Drug Programs Information Network (DPIN) and are now a part of the data repository. This data repository allows for the creation of a longitudinal record of health service utilization for an individual through a unique personal health identification number. The accuracy of these administrative data has been established for a wide range of clinical disorders, including prediction of mortality after acute myocardial infarction (AMI) (10–12). Data are available to researchers on submission of a valid scientific protocol to research ethics and confidentiality/privacy committees operating under the auspices of the government.
The outcome of the study was cardiac death or AMI. The diagnosis of cardiac death was established from the Vital Statistics database (ICD-9-CM 410.xx, 414.xx, or 425.xx). AMI was defined from hospital discharge diagnosis (ICD-9-CM 410.xx). Clinical variables were identified through a combination of chart review and the Manitoba Population Health Research Data Repository. The diagnosis of diabetes mellitus was assigned if a patient had 2 physician visits or 1 hospital admission with a coded diagnosis of diabetes mellitus (ICD-9-CM 250.xx) at any time during the 3 y before the scan (13). Previous myocardial infarction was taken as a primary hospital discharge diagnosis of AMI (ICD-9-CM 410.xx). Cardiac medication use in the 6 mo before scanning (at least 1 filled prescription) and during follow-up (at least 2 filled prescriptions) was obtained through review of prescription records in the provincial DPIN. DPIN did not exist in 1994 and, for patients scanned in 1994, medication use was identified from review of the clinical record.
Statistical Analysis
Statistical analysis was performed with a commercial software package (Statistica version 6.1; StatSoft Inc.). All continuous variables are reported as mean ± SD and P < 0.05 was considered to represent a statistically significant difference. Comparisons between patient groups were performed using a 2-tailed Student t test for continuous variables and a χ2 test for categoric variables. Cases that were believed to be visually normal but with an abnormal automated quantitative SSS were compared with those that were visually interpreted to be abnormal with a normal automated quantitative SSS. Event-free survival was computed according to the Kaplan–Meier product limit method. Differences in survival were assessed using the log-rank statistic (pairwise comparisons) or Gehan statistic (multiple groups). Cases in which the visual and automated quantitative assessments were discordant were used to compare the relative prognostic strength of the visual and automated quantitative perfusion variables. A Cox proportional hazards model was used to perform the multivariate survival analysis using a stepwise forward selection procedure. A statistically significant increase in the global χ2 of the model was required to show that inclusion of additional variables provided incremental information. Receiver-operating-curve (ROC) analysis looked at the agreement between SSS or SDS as continuous variables with the occurrence of cardiac death or nonfatal AMI (SPSS version 11.0; SPSS Inc.).
RESULTS
Patient Characteristics
The final study population consisted of 718 patients. There were almost equal numbers of men and women, and the mean age ± SD was 60 ± 11 y. Most patients were imaged on an outpatient basis (96%). There was a history of past myocardial infarction in 26% of patients and of diabetes mellitus in 18%. Before their scans, 136 (19%) patients were taking β-blockers, 126 (18%) were taking calcium-channel blockers, 69 (10%) were taking angiotensin-converting enzyme inhibitors, and 8 (1.1%) were taking antiarrhythmic medications. Most patients were taking no cardiac medications (467 [65%]) or taking a single medication (179 [25%]), and only 72 (10%) were taking multiple medications.
Treadmill exercise-only testing was the stress method in the majority (556 [77%]) of the patients, with the remainder having either dipyridamole (111 [16%]) or a combination of dipyridamole and exercise (51 [7%]). In the exercise-only patients, 227 (41%) achieved at least 85% of their maximum age-predicted heart rate, 242 (44%) achieved between 70% and 85%, and 85 (15%) achieved <70%. Among those 329 patients who did not achieve at least 85% of maximum age-predicted heart rate, 137 had limiting chest pain, electrocardiographic changes positive for ischemia, or both findings. Therefore, the majority of the exercise-only group (65%) achieved either an acceptable heart rate or an ischemic clinical endpoint.
The majority (54%) of the patients had visually normal scans (this included 35 scans coded as equivocal). Myocardial perfusion abnormalities were present in 330 patients (46%) and included only fixed defects in 49 (7%), completely reversible defects in 199 (28%), and partially reversible defects in 82 (11%) of the patients (Table 1).
Scan Findings in Relation to Occurrence of a Primary Event (AMI or Cardiac Death)
Survival Analysis
The average follow-up was 5.6 ± 1.1 y. During this time 79 patients (11%) experienced a primary outcome event. There were 34 cardiac deaths and 62 myocardial infarctions, including 18 patients recorded as having myocardial infarction followed by cardiac death. Comparing those individuals who experienced AMI or cardiac death with those who remained event-free showed significant differences in the visual category and the automated quantitative perfusion measures (Table 1).
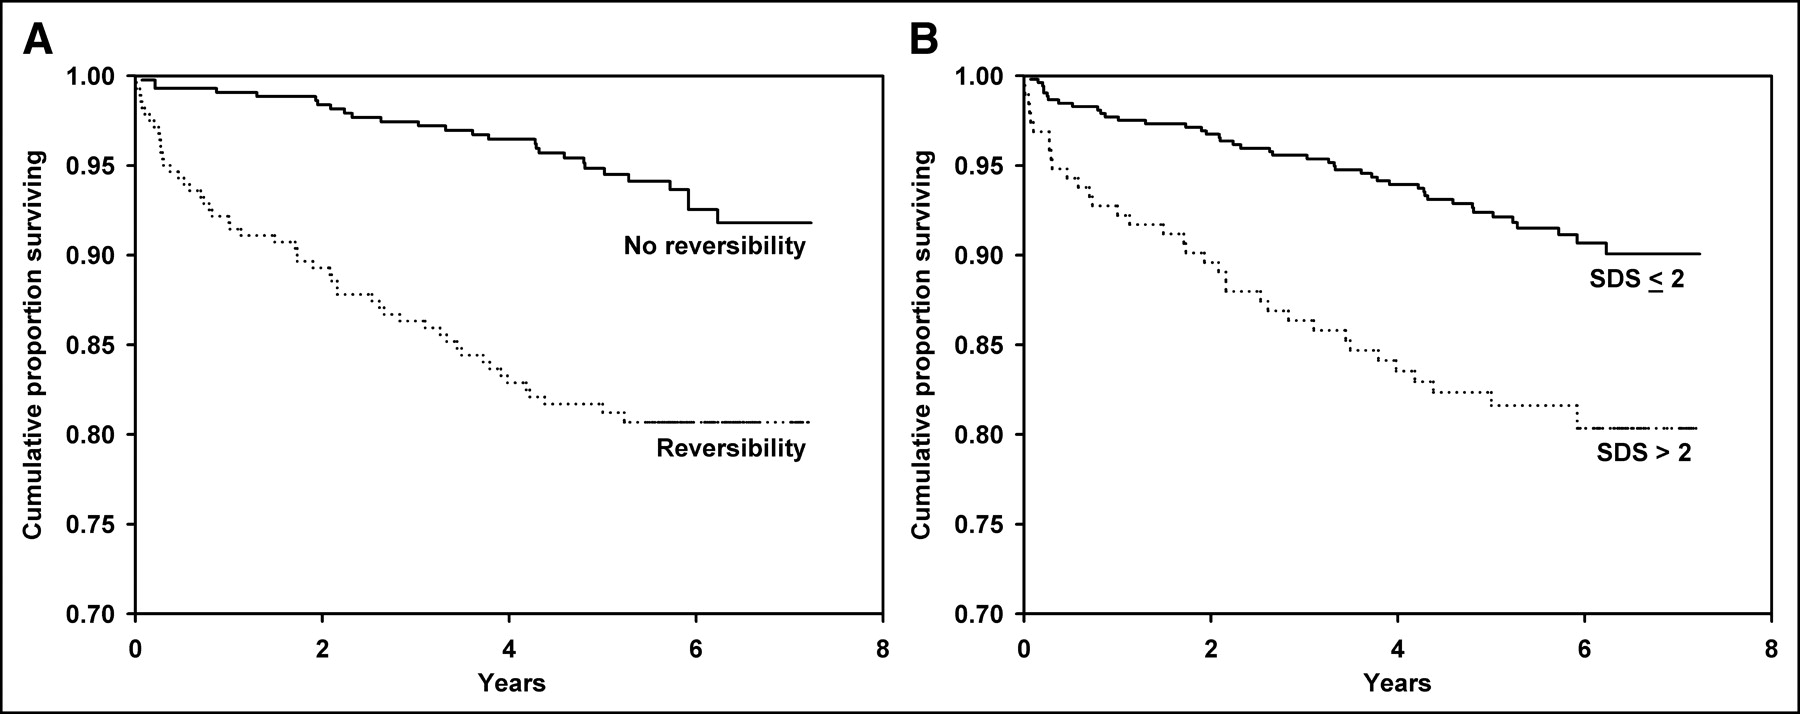
The visual assessment of scan abnormality was strongly predictive of the primary event of AMI or cardiac death (P < 0.00001) (Fig. 1). When abnormality was defined as an automated quantitative SSS > 3, there was a similar degree of risk stratification (P < 0.00001). Similar findings were obtained with the assessment of ischemic reversibility. Once again, the visual assessment of reversibility was strongly predictive of the primary event of AMI or cardiac death (P < 0.00001) (Fig. 2). When abnormality was defined as an automated quantitative SDS > 2, there was a similar degree of risk stratification (P < 0.00001). When reversibility measures were assessed in the subgroup with concordantly abnormal perfusion scans (visual and automated SSS), visual reversibility or SDS was no longer predictive.

Cumulative survival without AMI or cardiac death according to visual interpretation (normal vs. abnormal) (A) or automated quantitative assessment (SSS ≤ 3 vs. SSS > 3) of myocardial perfusion scintigraphy (B).

Cumulative survival without AMI or cardiac death according to visual interpretation (reversibility vs. no reversibility) (A) or automated quantitative assessment (SDS ≤ 2 vs. SDS > 2) of myocardial perfusion scintigraphy (B).
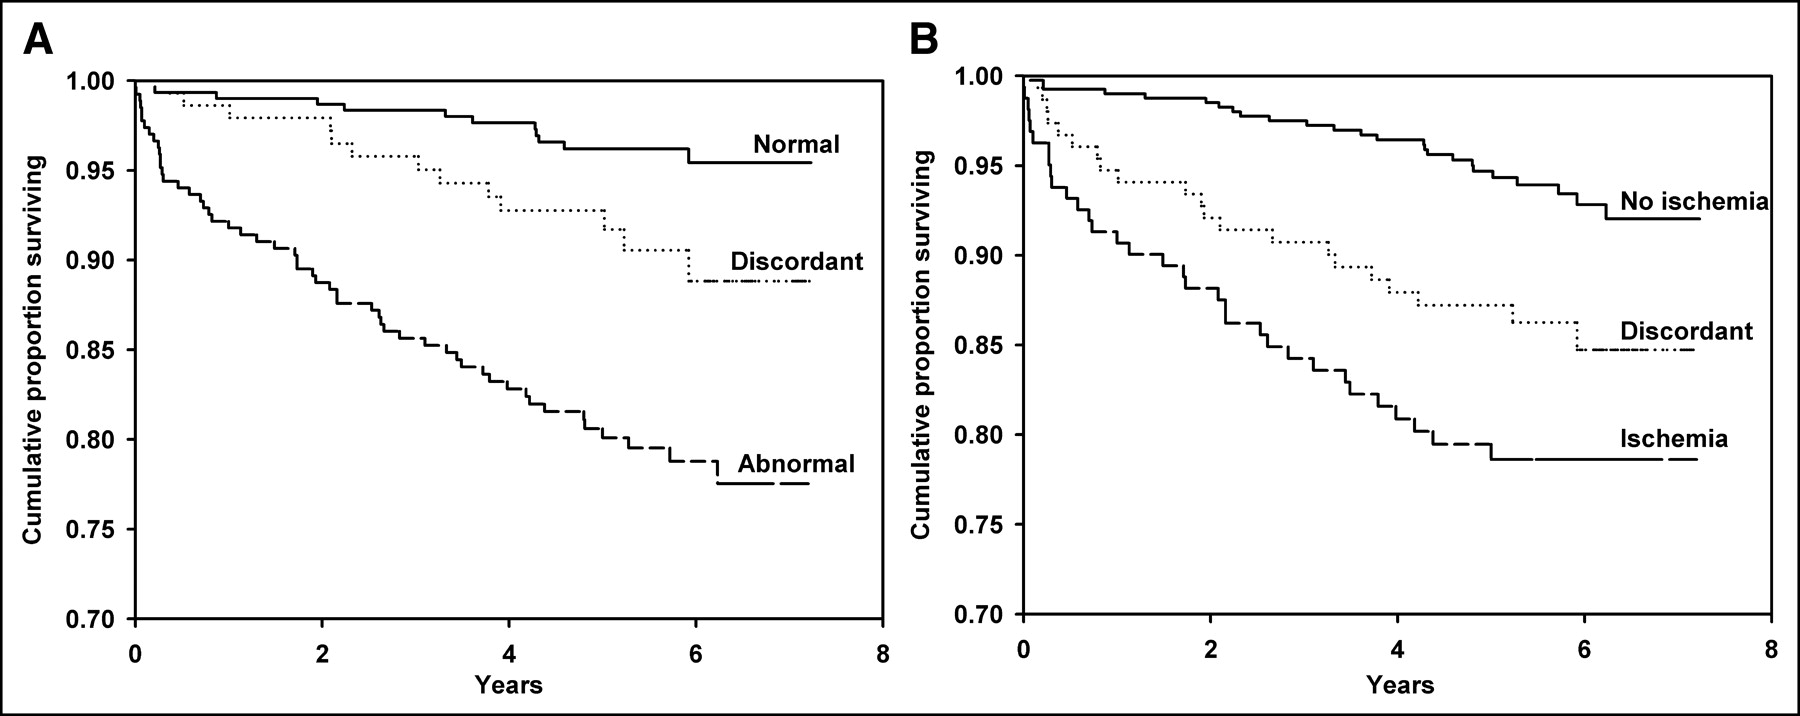
The automated quantitative SSS showed a gradient response in terms of risk across the range of normal (≤3), mildly abnormal (4–7), moderately abnormal (8–13), and severely abnormal (>13), which was highly statistically significant (P < 0.00001) (Fig. 3). The automated quantitative SDS also showed a gradient response in terms of risk across the range of normal (≤2), mildly abnormal (3–5), moderately abnormal (6–7), and severely abnormal (>7) (P = 0.00001). There was no difference in primary event-free survival for the 145 cases with discordance between the visual interpretation and automated quantitative assessment (visual normal with SSS > 3 vs. visual abnormal with SSS ≤ 3) (P = not significant [NS]). Cases that showed discordance between the visual and automated SSS assessment of normality showed intermediate event rates (estimated 5-y event-free survival 96.1% for concordant normal, 92.8% for discordant, 80.6% for concordant abnormal; P < 0.00001) (Fig. 4). Similarly, there was no difference in primary event-free survival for the 152 cases with discordance based on reversibility (no visual reversibility with SDS > 2 vs. visual reversibility with SDS ≤ 2) (P = NS). Once again, discordance in the reversibility assessment was associated with intermediate event rates (estimated 5-y event-free survival 94.7% for concordant without ischemia, 87.1% for discordant, 79.4% for concordance with ischemia; P < 0.00001).

Cumulative survival without AMI or cardiac death according to severity class of automated SSS (A) and severity class of automated SDS (B).

Cumulative survival without AMI or cardiac death according to agreement between visual assessment of normality and automated SSS (normal = visually normal and SSS ≤ 3, abnormal = visually abnormal and SSS > 3) (A) and visual assessment of reversibility and automated SDS (no ischemia = no reversibility visually and SDS ≤ 2, ischemia = reversibility visually and SDS > 2) (B).
Multivariable Models
The effect of adding quantitative scan information to the visual interpretation in a multivariable model is illustrated in Figure 5. The addition of dichotomous coding for the quantitative perfusion variables coding for abnormality (SSS ≤ 3 vs. > 3) and reversibility (SDS ≤ 2 vs. > 2) did not significantly improve the global χ2 (2) of the model for predicting AMI or cardiac death (P = NS). However, the addition of these quantitative perfusion variables (SSS and SDS) as continuous measures provided incremental prognostic information (P < 0.0001). The best predictive model for AMI or cardiac death contained the variables for visual abnormality versus normality (β, 1.19 ± 0.43; Wald statistic, 7.57; P = 0.0060) and the SSS (β, 0.048 ± 0.0.13; Wald statistic, 13.69; P = 0.0002).

Incremental contribution of automated quantitative analysis of myocardial perfusion scintigraphy to visual assessment for predicting AMI or cardiac death. Auto (dichot) = automated quantification using dichotomous measures of SSS (normal SSS ≤ 3 and abnormal SSS > 3) and SDS (normal SDS ≤ 2 and abnormal SDS > 2). Auto (cont) = automated quantification using continuous measures of SSS and SDS.
ROC Analysis
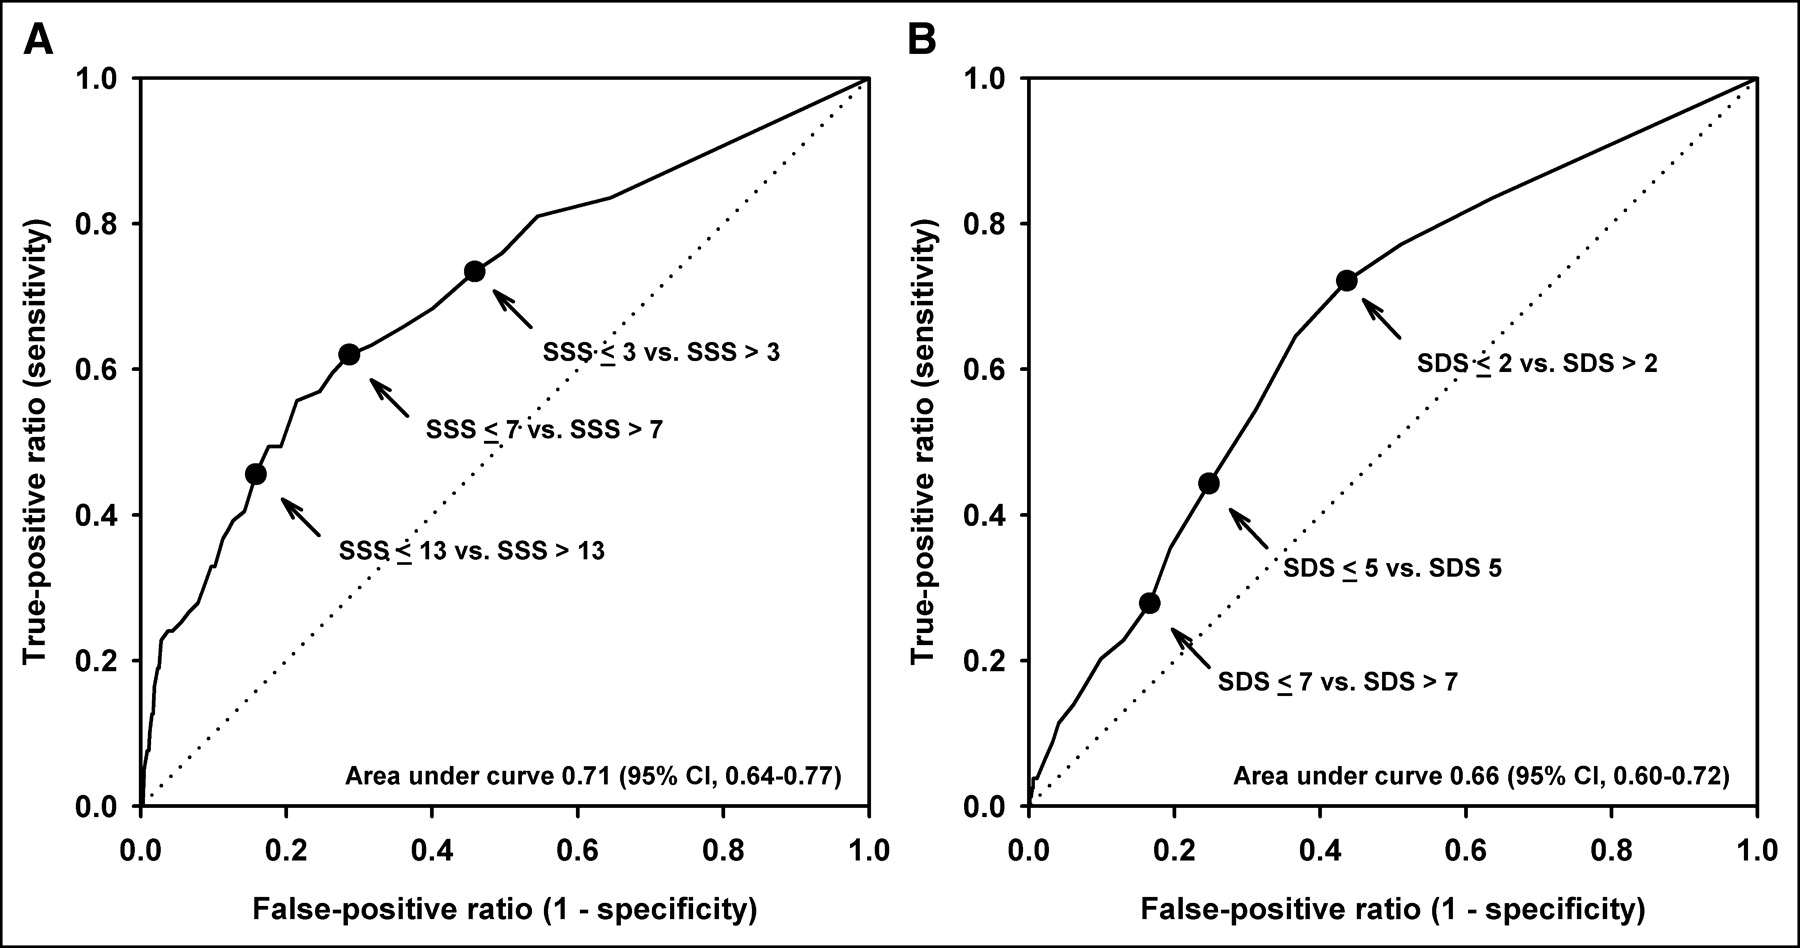
The ROC area (Fig. 6) for predicting AMI or cardiac death from the automated SSS was 0.71 ± 0.03 (95% confidence interval, 0.64–0.77), which was slightly better than the automated SDS area of 0.66 ± 0.03 (95% confidence interval, 0.60–0.72) (Table 2). No single cutoff point simultaneously gave an acceptable sensitivity and specificity. Therefore, we assessed a range of SSS and SDS cutoffs that have been previously proposed (Table 2). High sensitivity was obtained with an SSS > 3, whereas an SSS > 13 was very specific for an adverse outcome. Conversely, an SDS > 2 showed a good sensitivity for an adverse outcome, whereas an SDS > 7 was very specific. There was no significant difference between individual endpoints in terms of their relationship with the automated SSS (area: 0.72 ± 0.04 for AMI alone, 0.73 ± 0.05 for cardiac death alone) or automated SDS (area: 0.67 ± 0.04 for AMI alone, 0.68 ± 0.04 for cardiac death alone).

ROC curves relating automated SSS (A) and SDS with AMI or cardiac death (B). Prespecified cutoff points on curves are indicated (arrows).
Sensitivity and Specificity for Cardiac Events at Selected SSS and SDS Cutoffs
DISCUSSION
We have demonstrated that computer-derived indices of myocardial perfusion provide predictive information that is comparable to visual assessment. This confirms the work of Berman et al. that compared semiquantitative visual SSS with automatic quantitative analysis in 984 patients with known or suspected CAD using a dual-isotope rest 201Tl/stress 99mTc-sestamibi SPECT procedure (6). During a mean follow-up of 20 mo, 28 hard events, consisting of 14 cardiac deaths and 14 nonfatal myocardial infarctions, were recorded. ROC analysis indicated equivalent risk stratification for indices of defect extent, defect severity, and reversibility between the visual and automatic assessments. Our study population was slightly smaller but included a much longer follow-up with a larger number of clinical events. Our protocol also used 99mTc-sestamibi for the rest scan assessment of SDS reversibility, but 99mTc-sestamibi is common to both stress protocols; therefore, conclusions based on the SSS should be similar.
The threshold for an abnormal perfusion index is invariably somewhat arbitrary and reflects a tradeoff between sensitivity and specificity. We demonstrated a risk gradient with increasingly abnormal SSS and SDS. The very low event rate in individuals with an SSS ≤ 3 uses a definition similar to that of Berman et al. (6). The optimal choice of SDS threshold is less clear, and this group has used an SDS > 2 as abnormal with an SDS > 7 indicating severe ischemia (6,9). Our previous work found that an SDS > 5 maximizes agreement between visual and automatic quantitative assessment (3). We did not identify any significant difference in the ability of the automated parameters to predict AMI, cardiac death, or all-cause mortality as individual endpoints, though our study may be underpowered for this purpose. Others have reported that there may be differential risk stratification with an SSS in the mildly abnormal range showing a low risk for cardiac death but an intermediate risk for nonfatal AMI (8).
The prognostic value of myocardial perfusion imaging is well established and provides incremental value when combined with clinical, exercise, and angiographic information (14). A recent report summarized the experience with approximately 30,000 patients using a variety of stress protocols and radiopharmaceuticals and found an annualized cardiac death rate of only 0.5% in individuals with a normal result (15). The ability to risk stratify individuals for cardiac death and myocardial infarction can be seen in those at low, intermediate, and high likelihood for CAD (2,16). Myocardial perfusion imaging with 99mTc-sestamibi SPECT can identify very low risk patients with stable chest pain syndromes and after AMI (17). This information is incremental to what can be gained from using clinical and stress variables (2,8,17). We found that automated quantification provided prognostic information that was incremental to a limited qualitative visual assessment. This should not be taken to imply that computer-derived scan analysis is superior to the SSS and SDS derived from an equivalent semiquantitative visual grading, however, since these were not directly compared in our study. The simple categoric visual analysis used in this study does not provide stratification of the extent or degree of ischemia or infarction and is therefore not “optimal” for prognostication.
The prognostic significance of discordance between the visual and quantitative perfusion assessments represents a new observation. Patients with visually abnormal scan and an SSS ≤ 3 or a visually normal scan and an SSS > 3 had a 5-y primary event-free survival of 92.8%, a rate that was intermediate between the concordantly normal and concordantly abnormal scans and similar to a quantitatively mildly abnormal scan (SSS = 4–7). Similarly, for discordance between visual and quantitative assessments of reversibility, patients with no reversibility by visual assessment but SDS > 2 and those with visual reversibility but SDS ≤ 2 had a 5-y event-free survival of 87.1%. From these findings, it appears that quantitative measures of perfusion abnormality not only provide incremental prognostic value to a visually abnormal scan but, when present, also may modify the risk associated with a visually normal scan. This observation requires confirmation in additional, larger cohorts. We still consider that the visual reading should remain the standard for scan interpretation, but one should probably not completely dismiss a quantitatively abnormal scan even though the scan is visually normal. At the very least, careful inspection of the images, review of the patient’s stress test, and other clinical information is advocated.
A limitation of our study is the lack of functional information in terms of regional and global left ventricular performance. Gated SPECT was not available to us at the time that the scans were initially acquired. Sharir et al. have reported that the poststress left ventricular ejection fraction (EF) can provide prognostic information that is additive to the assessment of perfusion (9). In 2,686 patients with a mean follow-up of 20.9 mo, they observed 57 cardiac deaths and 30 nonfatal myocardial infarctions. In individuals with normal left ventricular function (EF > 50%) or mild to moderately depressed left ventricular function (EF, 30%–50%), there was a stepwise increase in events with worsening SDS. In this analysis, an SDS ≤ 2 was considered to represent no ischemia, an SDS of 3–7 a mild amount of ischemia, and an SDS > 7 a large amount of ischemia. Patients with severe left ventricular dysfunction (EF < 30) were at high risk independent of the SDS. The amount of ischemia was the best single predictor of myocardial infarction and replaced the SSS in the final model. The poststress EF was the best predictor of cardiac death. The authors suggested that integration of perfusion and functional data could improve risk stratification. The observation that reversible defects are stronger predictors of cardiac death and nonfatal myocardial infarction is consistent with other reports (18). Our reliance on administrative data for assessing endpoints is a potential area of concern as we did not perform chart reviews or death audits to verify the diagnosis of AMI or cardiac death. However, the reliability of the Manitoba Population Health Research Data Repository is well established and has been successfully applied in validating prediction rules of mortality after AMI (12). Finally, we had to exclude 309 of 1,027 (30%) potentially eligible patients, though the major reasons for exclusion (corrupted archive media or poor-quality image data [n = 104], insufficient personal identifier information [n = 105]) would be unlikely to bias our results. A significant proportion of our exercise-only cohort (n = 190) had a suboptimal stress test as judged by failure to achieve 85% of the age-predicted maximal heart rate or an ischemic endpoint. This did not appear to affect our findings as subgroup analysis showed that the SSS and SDS provided similar risk stratification in both groups. Although test sensitivity and risk stratification may be compromised in exercising patients who do not achieve an adequate chronotropic or ischemic endpoint, this would be expected to affect both the visual and the quantitative perfusion analyses and should not change conclusions based on their relative performance. Combining patients with and without previous myocardial infarction in our analysis raises a similar concern. Previous infarction is a marker for recurrent cardiac events and is also more likely to produce an abnormal perfusion pattern. Additional multivariable analysis confirmed that the automated SSS and SDS were independent predictors of adverse cardiac events even after adjustment for a history of previous myocardial infarction. Once again, this should not change conclusions based on comparing perfusion analyzed with visual and quantitative methods.
CONCLUSION
We have independently validated the prognostic value of automatic computer-derived indices of myocardial perfusion for predicting important clinical events. Overall risk stratification achieved with this software may complement what expert human readers can achieve using a simple qualitative visual assessment.
Acknowledgments
This research was supported by grants from the Canadian Institute for Health Research and the Rx & D Foundation. We are indebted to Health Information Management at Manitoba Health for providing data. The results and conclusions are those of the authors, and no official endorsement by Manitoba Health is intended or should be inferred.
Footnotes
Received Dec. 18, 2003; revision accepted Aug. 12, 2004.
For correspondence or reprints contact: William D. Leslie, MD, Department of Medicine (C5121), 409 Tache Ave., Winnipeg, Manitoba, Canada R2H 2A6.
E-mail bleslie{at}sbgh.mb.ca
REFERENCES
In this issue


Jump to section
Related Articles
Cited By...
- 5-Year Prognostic Value of Quantitative Versus Visual MPI in Subtle Perfusion Defects: Results From REFINE SPECT
- Myocardial Ischemic Burden and Differences in Prognosis Among Patients With and Without Diabetes: Results From the Multicenter International REFINE SPECT Registry
- Quantitative Clinical Nuclear Cardiology, Part 1: Established Applications
- Improved Accuracy of Myocardial Perfusion SPECT for the Detection of Coronary Artery Disease Using a Support Vector Machine Algorithm
- Comparison of Fully Automated Computer Analysis and Visual Scoring for Detection of Coronary Artery Disease from Myocardial Perfusion SPECT in a Large Population
- Assessment of the Influence of Atrial Fibrillation on Gated SPECT Perfusion Data by Comparison with Simultaneously Acquired Nongated SPECT Data
- The Prognostic Value of Normal Exercise Myocardial Perfusion Imaging and Exercise Echocardiography: A Meta-Analysis
- Prognostic Value of Lung Sestamibi Uptake in Myocardial Perfusion Imaging of Patients With Known or Suspected Coronary Artery Disease
- Are Human Readers Needed for Prognostication from Stress Myocardial Perfusion SPECT? Using Outcomes Research to Validate Medical Technology