


Abstract
Mitochondrial complex 1 is involved in maintaining brain bioenergetics; σ-1 receptor responds to neuronal stress; and synaptic vesicle protein 2A reflects synaptic integrity. Expression of each of these proteins is altered in neurodegenerative diseases. Here, we characterize the kinetic behavior of 3 PET radioligands—18F-BCPP-EF, 11C-SA-4503, and 11C-UCB-J—for the measurement of mitochondrial complex 1, σ-1 receptor, and synaptic vesicle protein 2A, respectively, and determine appropriate analysis workflows for their application in future studies of the in vivo molecular pathology of these diseases. Methods: Twelve human subjects underwent dynamic PET scans with each radioligand, including associated arterial blood sampling. A range of kinetic models was investigated to identify an optimal kinetic analysis method for each radioligand and a suitable acquisition duration. Results: All 3 radioligands readily entered the brain and yielded heterogeneous uptake consistent with the known distribution of the targets. The optimal models determined for the regional estimates of volume of distribution were multilinear analysis 1 (MA1) and the 2-tissue-compartment model for 18F-BCPP-EF, MA1 for 11C-SA-4503, and both MA1 and the 1-tissue-compartment model for 11C-UCB-J. Acquisition times of 70, 80, and 60 min for 18F-BCPP-EF, 11C-SA-4503, 11C-UCB-J, respectively, provided good estimates of regional volume of distribution values. An effect of age was observed on 18F-BCPP-EF and 11C-UCB-J signal in the caudate. Conclusion: These ligands can be assessed for their potential to stratify patients or monitor the progression of molecular neuropathology in neurodegenerative diseases.
The complex and heterogeneous pathophysiology of neurodegenerative diseases represents a major challenge for the discovery and development of disease-modifying therapeutics. A growing body of literature implicates cellular stress-related mitochondrial and endoplasmic reticulum (ER) dysfunction and related synaptic abnormalities as a common denominator across neurodegenerative diseases, making the mitochondrial/ER/synaptic axis an attractive system to target in the search for biomarkers that can be used to monitor disease progression (1–3). Mitochondrial adenosine triphosphate production is critical for the bulk of neuronal processes, including neurotransmitter synthesis and synaptic plasticity. The mitochondrial complex 1 (MC1) is a crucial component of this process, as it is where the first step of oxidative phosphorylation takes place (4). MC1 is responsible for cellular housekeeping mechanisms, including maintaining cellular calcium homeostasis, producing reactive oxygen and nitrogen species, and regulating apoptosis (4). Altered MC1 function has been associated with cell toxicity, accelerated aging, and the pathogenesis of multiple neurodegenerative diseases (1). In vivo quantification of MC1 in the brain has been made possible by the development of the PET radioligand 18F-BCPP-EF (2-tert-butyl-4-chloro-5-{6-[2-(2-18F-fluoroethoxy)-ethoxy]-pyridin-3-ylmethoxy}-2H-pyridazin-3-one) (5). Characterization of 18F-BCPP-EF kinetics in the nonhuman primate brain has suggested its suitability for human evaluation, but no human data have been published to date (6,7).
A second regulator of cellular energy is the σ-1 receptor (σ1R), which is a chaperone protein that stabilizes the inositol phosphate 3 receptor voltage-dependent anion channel in the mitochondria-associated ER membrane (8). This channel is the principal pathway for calcium influx from the ER stores to the mitochondrion, with adenosine triphosphate production rate depending significantly on calcium concentration (9). σ1R is involved in synaptic plasticity and neuroprotection, with human postmortem evidence of altered expression in Alzheimer disease (10–12). Early PET imaging studies have used the radioligand 11C-SA-4503 (11C-labeled 1-[2-(3,4-dimethoxyphenthyl)]-4-(3-phenylpropyl)-piperazine dihydrochloride) to evaluate σ1R status in healthy, Parkinson disease, and Alzheimer disease cohorts, though an evaluation of the optimal imaging methodology for 11C-SA-4503 has yet to be established (13–15).
The synaptic vesicle protein A (SV2A) is a membrane glycoprotein expressed ubiquitously on synaptic vesicles in presynaptic terminals and regulates calcium-mediated neurotransmitter release (16). SV2A has a stable synaptic stoichiometry with good correlation to recognized synaptic density markers such as synaptophysin and thus offers great promise as a marker of synaptic terminal density in the human brain (17). Synaptic loss is central to all neurodegenerative disease pathology, with evidence of changes to presynaptic structure and function in presymptomatic stages of disease, raising interest in the use of SV2A markers (18–20). Quantification of SV2A has been made possible by the discovery of the radioligand 11C-UCB-J ((R)-1-((3-(11C-methyl-11C)pyridin-4-yl)methyl)-4-(3,4,5-trifluorophenyl)pyrrolidin-2-one), with recent findings indicating a reduction in 11C-UCB-J–specific binding in healthy aging, mild cognitive impairment, and Alzheimer disease (21–23).
The availability of the PET radioligands 18F-BCPP-EF, 11C-SA4503, and 11C-UCB-J enables the quantification of MC1, σ1R, and SV2A, respectively, and allows us to test the hypothesis that a combination of these markers could provide a useful index of the function of the mitochondrial/ER/synaptic axis depicted in Figure 1. The data utilized in this article were collected as part of ongoing studies funded by the MIND-MAPS consortium (www.invicro.com/mindmaps). The methods identified here will be used for the future quantification of healthy volunteer and patient cohorts in the MIND-MAPS program. The primary aim is to establish an appropriate set of image analysis workflows including optimal tracer kinetic quantification approaches and outcome measures for 18F-BCPP-EF, 11C-SA-4503, and 11C-UCB-J in humans. A secondary aim is to explore whether MC1, σ1R, and SV2A expression is altered in healthy aging.

Mitochondrial/ER/synaptic axis. ETC = electron transport chain; MAM = mitochondria-associated endoplasmic reticulum membrane.
MATERIALS AND METHODS
Study Design
All procedures were in accordance with the ethical standards of East of England Cambridge South Research Ethics Committee. Twelve healthy volunteers (7 men/5 women, 61 ± 20 y old, range, 33–75 y) were screened and scanned at Invicro London’s Hammersmith Hospital site. Each subject underwent structural MRI and 1 dynamic PET scan with 18F-BCPP-EF, 11C-SA-4503, and 11C-UCB-J. Written informed consent was obtained from all subjects.
Radiotracer Synthesis
18F-BCPP-EF, 11C-SA-4503, and 11C-UCB-J were synthesized as previously described (5,24,25). Injected dose information for each radioligand is summarized in Supplemental Table 1 (supplemental materials are available at http://jnm.snmjournals.org).
PET Acquisition
All PET scans were acquired on either a Hi-Rez Biograph 6 or a Biograph 6 TruePoint PET/CT scanner (Siemens Healthcare), with subjects receiving all 3 PET scans on the same scanner. A low-dose CT scan (30 mAs, 130 keV, 0.55 pitch) was performed immediately before each PET scan to estimate attenuation. An intravenous cannula was inserted into a cubital or forearm vein for radioligand administration, and a second cannula was inserted into the radial artery to enable arterial blood collection. The radioligands were administered as a bolus (20 mL over 20 s) at the start of the PET scan. Dynamic emission data were acquired over 90 min after radiotracer administration and were reconstructed into 26 frames (frame durations: 8 × 15 s, 3 × 60 s, 5 × 120 s, 5 × 300 s, and 5 × 600 s) using discrete inverse Fourier transform reconstruction. Corrections were applied for attenuation, randoms, and scatter.
Arterial Blood Acquisition
Whole-blood activity was measured using a continuous automatic blood sampling system (Allogg AB) at a rate of 5 mL/min for the first 15 min of the scan. Discrete blood samples were taken at 10, 15, 20, 25, 30, 40, 50, 60, 70, 80, and 90 min after the start of the scan, and total-blood and plasma radioactivity concentration was evaluated in in a Perkin Elmer 1470 10-well γ-counter. The fraction of plasma radioactivity constituted by unchanged parent radioligand (plasma parent fraction, or ppf) was determined using high-performance liquid chromatography. The plasma free fraction (fp) was measured by ultrafiltration in triplicate using an arterial blood sample taken before tracer injection.
MR Acquisition
Each subject underwent a T1-weighted MRI scan for coregistration with PET images. Scans were acquired on a Siemens 3-T Trio clinical MRI scanner (Siemens Healthineers) with a 32-channel phased-array head coil using a 3-dimensional magnetization-prepared rapid gradient echo sequence (echo time, 2.98 ms; repetition time, 2,300 ms; flip angle, 9°; voxel size, 1.0 × 1.0 × 1.0 mm).
Image Analysis and Processing
All image data were analyzed using Invicro London’s in-house PET data quantification tool, MIAKAT (version 4.3.7), which implements MATLAB (version R2016a; MathWorks Inc.) and FSL (version 5.0.4; FMRIB) functions for brain extraction and SPM12 (Wellcome Trust Centre for Neuroimaging) for image segmentation and registration (26).
Each subject’s MR images underwent brain extraction, gray matter segmentation, and rigid-body coregistration to a standard reference space (27). The template brain image and associated Center for Integrative Connectomics neuroanatomic atlas was then nonlinearly warped to the individual subject’s MR images, on which the following regions of interest (ROIs) were defined: brain stem, substantia nigra, thalamus, ventral striatum, caudate, putamen, hippocampus, insular cortex, temporal lobe, parietal lobe, frontal cortex, and cerebellum (28). A centrum semiovale ROI was also generated from the automated anatomic labeling template as defined previously for investigation as a reference region for 11C-UCB-J (21,29). PET images were registered to each subject’s MR image and corrected for motion using frame-to-frame rigid-body registration. Regional time–activity curves were generated for each ROI.
Arterial Input Function Modeling
Optimal ppf models were identified for each tracer and applied to the total plasma activity curve to derive a metabolite-corrected arterial input function.
Tracer Kinetic Modeling
All time–activity curves were fitted with a 1-tissue-compartment (1TC) model, a 2-tissue-compartment (2TC) model, and multilinear analysis 1 (MA1) to estimate the total volume of distribution (VT) (30). MA1 was applied to time–activity curve data, with integration intervals computed over 30–90 min for all tracers based on an initial assessment of an appropriate temporal window. Blood volume fraction was fixed to 5%. VT/fp was also assessed as an outcome measure to explore its utility in studies in which there are differences in fp.
Given the low white matter uptake we observed for 18F-BCPP-EF, 11C-SA-4503, and 11C-UCB-J, we assessed the centrum semiovale as a pseudo reference region for each ligand and used it to calculate the distribution volume ratio (DVR).
Model Comparison and Selection
The performance of 1TC and 2TC models was assessed by the Akaike information criterion and parameter identifiability based on the percentage SE derived from the covariance matrix (31). Linear regression correlation coefficients (r2) were used to compare performance between the graphical method MA1 and the compartmental models. VTs that were poorly estimated (SE% > 10) were excluded from model comparisons.
Time Stability Analysis
The stability of each radioligand over time was evaluated by exploring the performance of the tracer kinetic models for varying scan lengths. The estimated VTs were expressed as percentages of the VT estimated from the full 90-min scan. These analyses were aggregated together over all subjects, enabling assessment of the time stability of the radiotracers in the population.
Assessment of Age Effects on Outcome Measures
The effects of healthy aging on MC1, σ1R, and SV2A density were assessed using correlation analysis, with age as the predictor variable and the PET outcome measures and ROI volume as parameters of interest. ROI volume was normalized to whole-brain volumes: Eq. 1where
  is the volume in a given ROI and
  is the whole-brain volume. Percentage rates of change per year in VT, VT/fp, DVR, and %
 were then calculated as
 Eq. 2
Eq. 2
RESULTS
All participants completed three 90-min dynamic PET scans including arterial blood sampling and MRI. A summary of demographic information and individual scan parameters is included in Supplemental Table 1.
Arterial Input Function Modeling
Ppf data for 18F-BCPP-EF were best described by a sigmoid model with 20% ± 8% intact parent radiotracer at 90 min. 11C-SA-4503 metabolite data were best described by an exponential function in which ppf was estimated at 91% ± 5% at 90 min. 11C-UCB-J metabolite data were described by a sigmoid model with approximately 25% ± 5% at 90 min. Individual ppf and input function profiles are shown in the Supplemental Figure 1.
Tracer Kinetic Modeling
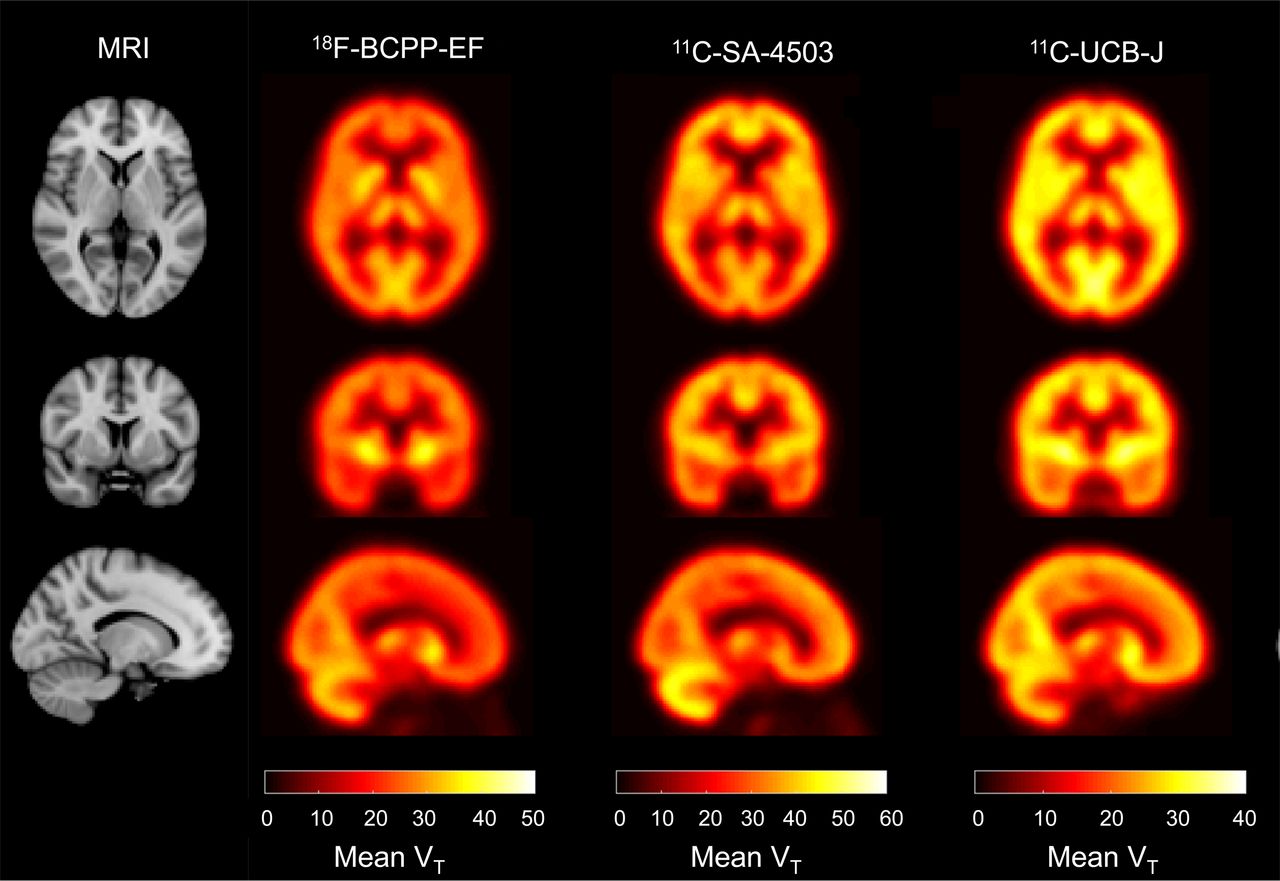
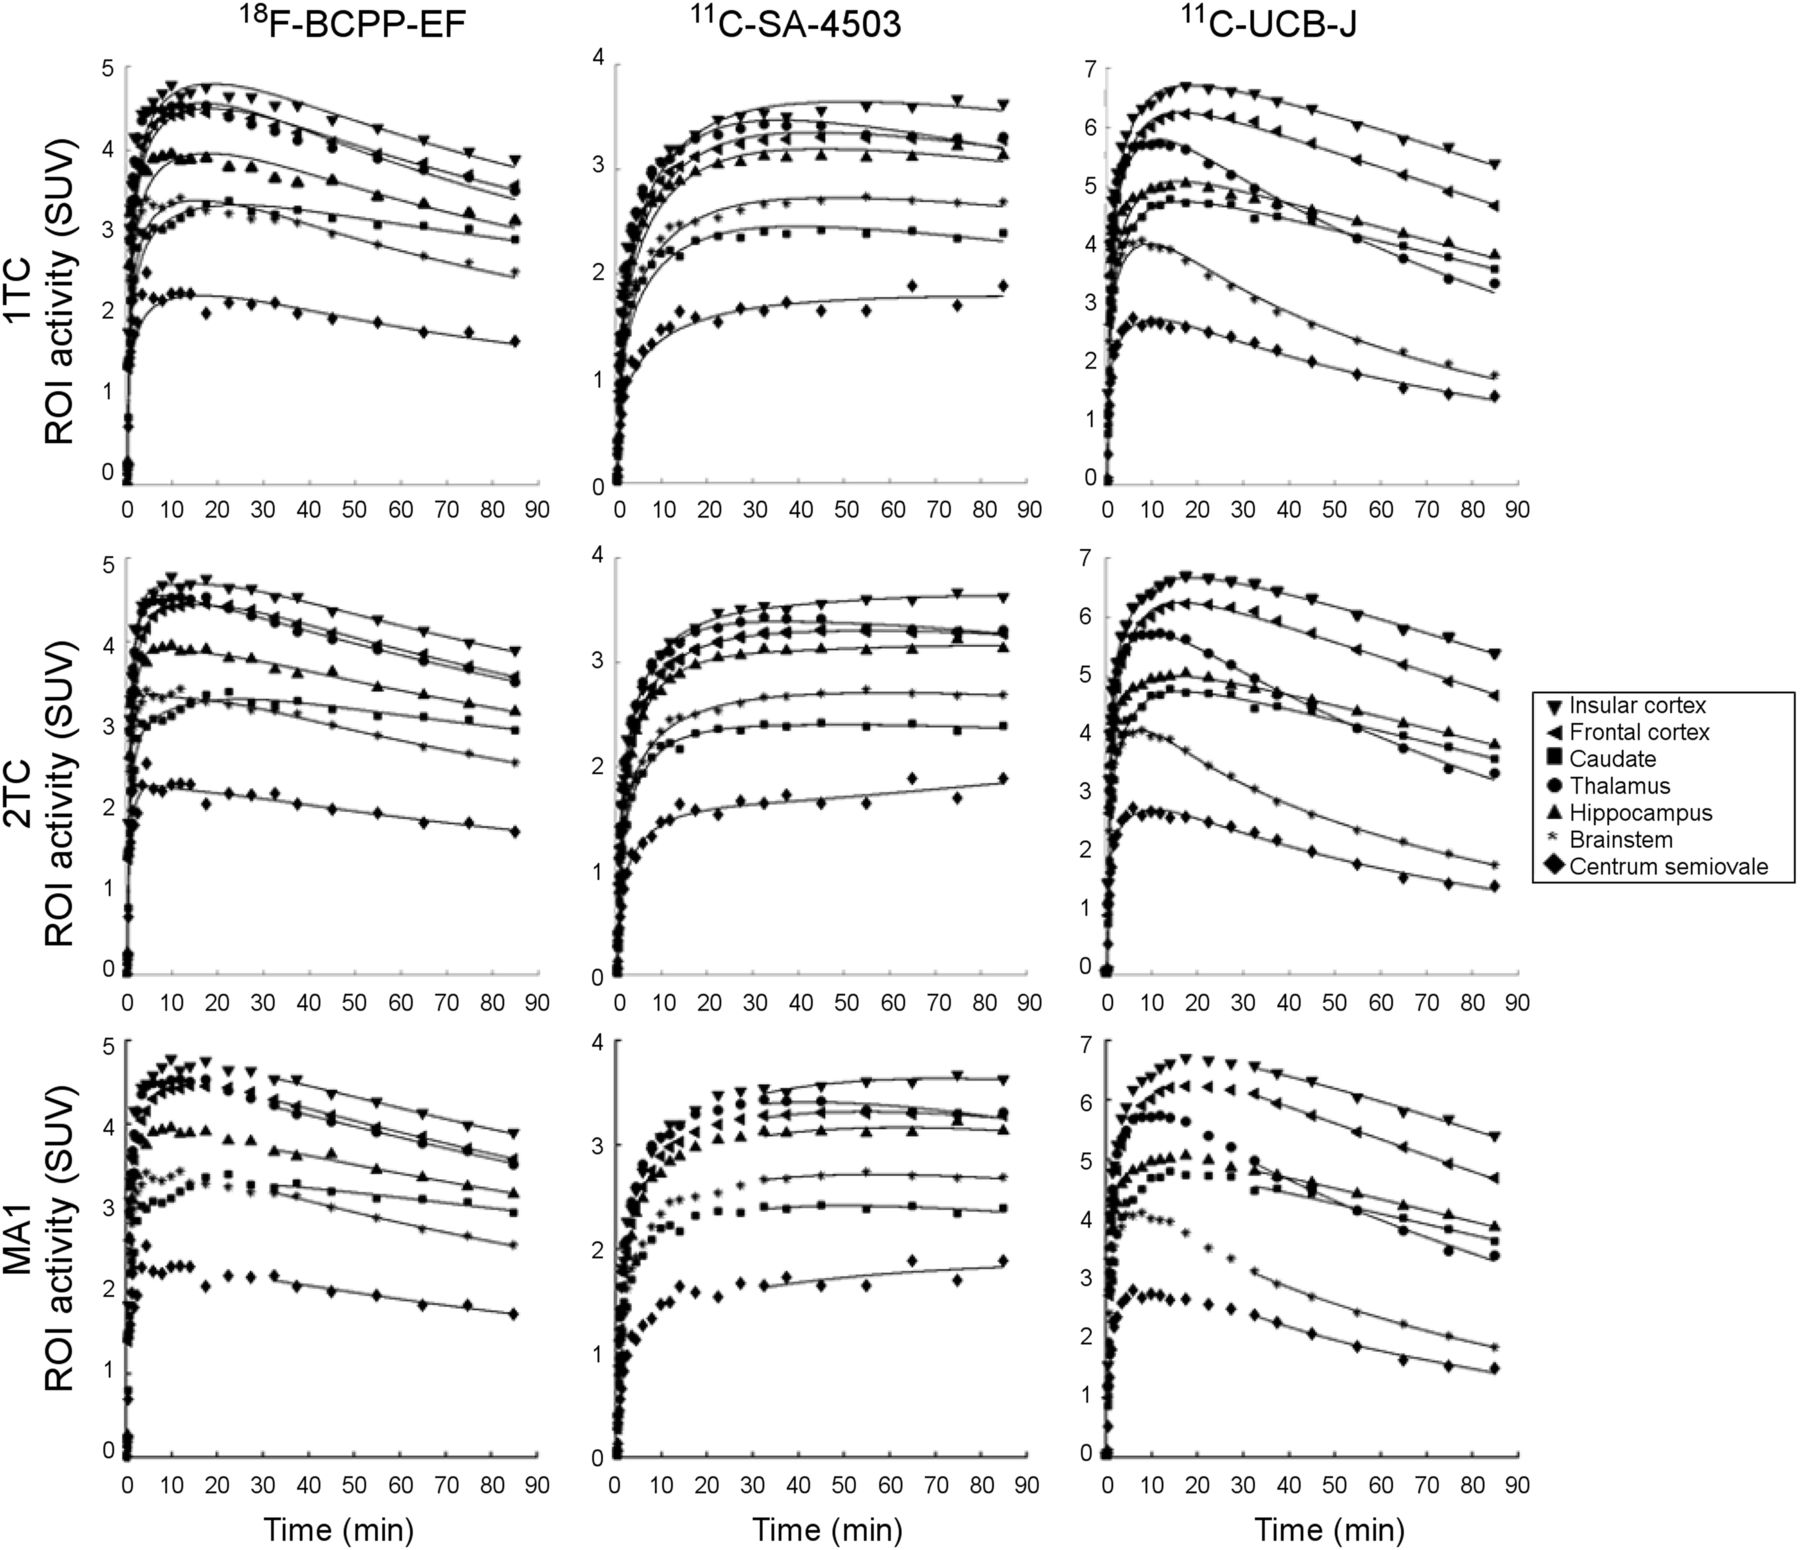
All 3 tracers entered the brain readily and demonstrated a heterogeneous distribution (Fig. 2). 18F-BCPP-EF uptake was fast, and peak SUVs were reached at about 5–12 min after injection. 11C-SA-4503 uptake was slow and peaked at about 30–60 min after injection. 11C-UCB-J displayed fast kinetics producing a peak SUV at about 7–21 min after injection.

Orthogonal cross-sections of average parametric VT images generated by 1TC (11C-UCB-J) and Logan graphical analysis (11C-SA-4503 and 18F-BCPP-EF).
All kinetic models reached convergence in the 18F-BCPP-EF–derived regional time–activity curve data (Fig. 3). VT was robustly estimated in all ROIs using both 1TC and 2TC, with the Akaike information criterion analysis favoring the 2TC over the 1TC. As 2TC- and MA1-derived VT were in excellent agreement (r2 = 0.99) (Supplemental Fig. 2A), both were chosen as suitable modeling methods for 18F-BCPP-EF.

Representative model fits for 18F-BCPP-EF, 11C-SA-4503, and 11C-UCB-J.
For 11C-SA-4503, 2TC produced the most parsimonious fits to time–activity curves in 155 of the 156 tested cases as determined by the Akaike information criterion when compared with 1TC; however, VT was poorly estimated in 17 of 156 cases. MA1 produced good fits to the time–activity curve data, and VT estimates were in close agreement with those reliably estimated using the 2TC model (r2 = 0.97) (Supplemental Fig. 2B) and were therefore chosen as the appropriate kinetic model.
All 3 models produced excellent fits to 11C-UCB-J time–activity curve data. The Akaike information criterion preferred 2TC over 1TC in 146 of 156 cases; however, 3 of 156 VT estimates were unstable with 2TC. MA1 produced good fits that were well correlated with 1TC fits (r2 = 0.99) (Supplemental Fig. 2C).
All VT estimates are summarized in Table 1. The average coefficient of variance (COV) of VT across all regions investigated was 19% ± 4% for 18F-BCPP-EF, 20% ± 6% for 11C-SA-4503, and 13% ± 5% for 11C-UCB-J (Fig. 4). There was no relationship between injected mass and VT for any of the radioligands (Supplemental Table 2).
VT and %Volroi Estimates
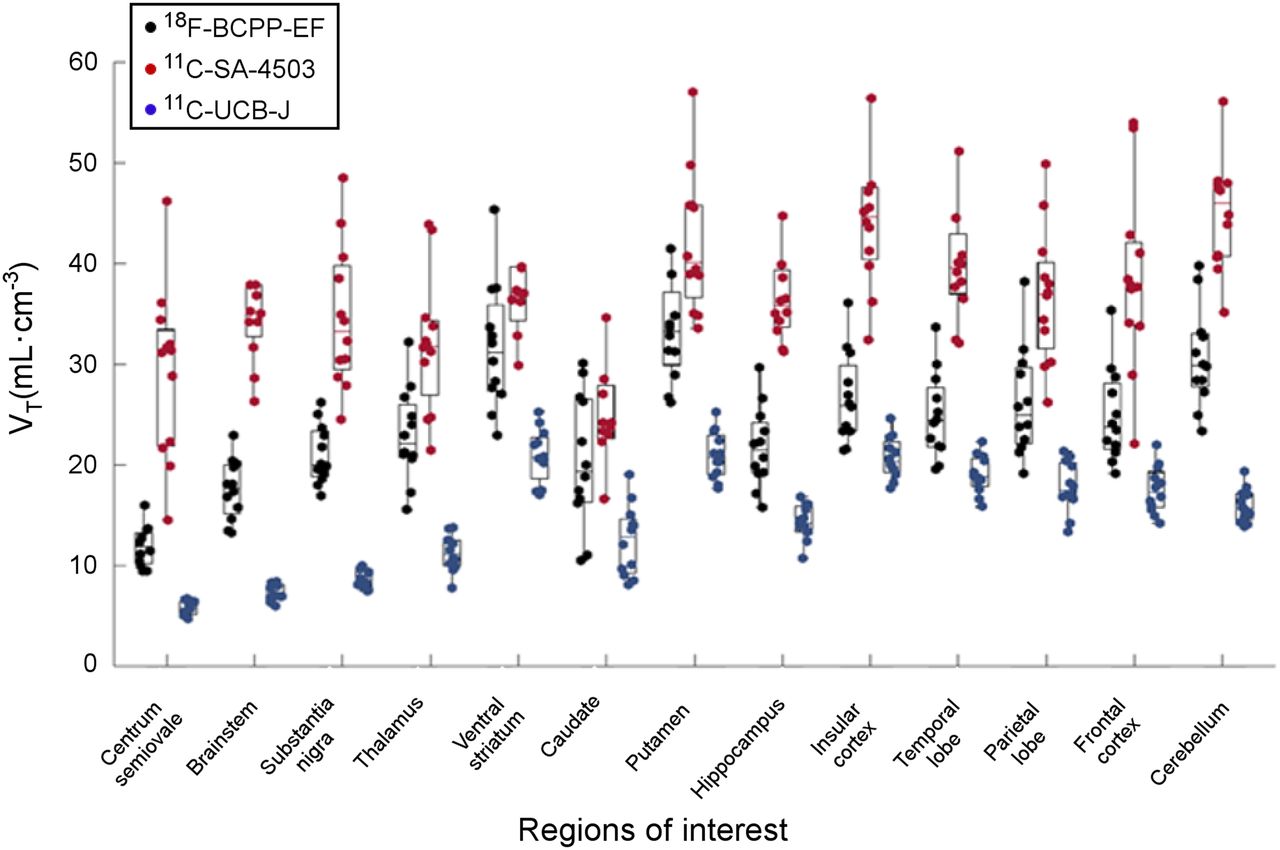
Distribution of regional VT estimates.
Time Stability Analysis
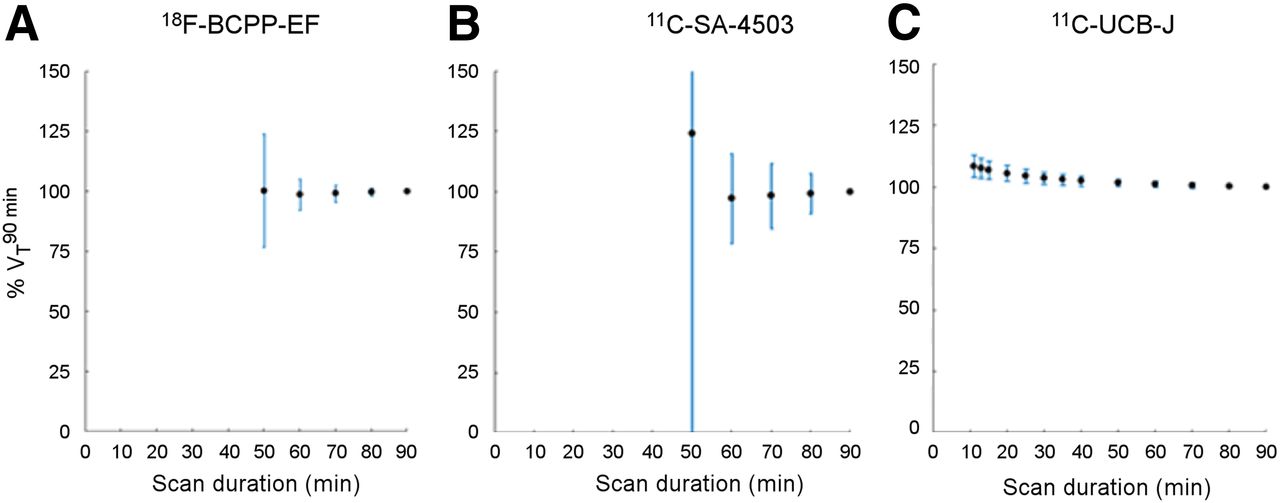
For 18F-BCPP-EF, 70 min of PET data provided good stability of VT (Fig. 5A), with the resulting VT being 98.4% ± 6.7% of the final VT. An 80-min acquisition with 11C-SA-4503 produced reliable VT estimates that were 98.2% ± 1.2% of the VT estimated from the full 90-min scan (Fig. 5B). 11C-UCB-J estimates derived from a 60-min scan were 98.0% ± 1.8% of the VT estimated from the full 90-min scan (Fig. 5C). Regional time stability analyses are included in Supplemental Figures 3–5.

Time stability plots for18F-BCPP-EF (A),11C-SA-4503 (B), and 11C-UCB-J VT (C). First 50 min for 18F-BCPP-EF and 11C-SA-4503 have been excluded for clarity.
Assessment of DVR and VT/fp as Outcome Measures
DVR results were less variable between subjects than were the corresponding VT estimates except for 11C-SA-4503, for which DVR results were more susceptible to individual differences than were the VT estimates (Supplemental Table 3). Correction of VT by fp had no significant effect on intersubject variability for any of the ligands (Supplemental Table 4).
Assessment of Age Effects on Outcome Measures
We observed a statistically significant yearly reduction in volume of 0.52%, 0.36%, and 0.53% in the temporal lobe, parietal lobe, and frontal cortex, respectively (Table 2; Fig. 6A).
Age Effects on Volumetric and PET Outcome Measures

Linear regression plots of age vs. %Volroi (A), 18F-BCPP-EF VT (B), 11C-SA-4503 VT (C), and 11C-UCB-J VT (D).
18F-BCPP-EF VT decreased with age in most regions, with the highest reduction—1.68%/y—being in the caudate (Fig. 6B). A similar negative trend was observed for 11C-SA-4503; however, none of the correlations reached significance (Fig. 6C). 11C-UCB-J VT was negatively correlated with age in all regions, with significant reductions in the thalamus, ventral striatum, caudate, insula, parietal lobe, and frontal cortex (Fig. 6D; Table 2).
The results of our regression analysis between DVR and age were similar to those observed with VT (Supplemental Fig. 6A; Supplemental Table 5). 18F-BCPP-EF VT/fp was negatively correlated with age in the thalamus, caudate, and parietal lobe, whereas correcting 11C-UCB-J VT by fp masked any prior age effects on SV2A density except in the caudate (Supplemental Fig. 6B; Supplemental Table 6). Lastly, 11C-UCB-J fp appeared to decrease with age, though this difference did not reach statistical significance (Supplemental Fig. 7).
DISCUSSION
The current study evaluated a variety of kinetic quantification approaches for the radioligands 18F-BCPP-EF, 11C-SA-4503, and 11C-UCB-J in the human brain. In addition, we examined the effects of age on the density of MC1, σ1R, and SV2A. 18F-BCPP-EF displayed reversible kinetics, with the highest uptake being observed in striatal regions, consistent with nonhuman primate data (7). 18F-BCPP-EF metabolism was rapid, and the kinetics were well described using both MA1 and 2TC. Our results showed a reduction in 18F-BCPP-EF signal with age, in line with preclinical experiments (5). Importantly, reductions in the caudate did not appear to be driven by changes in volume (Figs. 6A and 6B), suggesting that striatal mitochondrial density could be particularly susceptible to aging.
The tracer characteristics of 11C-SA-4503 agreed with initial results in humans (13). We selected MA1 as the optimal model to describe 11C-SA-4503 kinetics because approximately 11% of our 2TC-derived VT estimates were poorly estimated. This was mainly due to the poor estimation of k4 in the caudate, substantia nigra, and centrum semiovale, suggesting that 11C-SA-4503 kinetics approach irreversibility in these regions and should be interpreted with caution. 11C-SA-4503 signal was highest in the cerebellum, consistent with previous mouse and initial human studies (13,24). We observed an age-related decrease in 11C-SA-4503 signal consistent with preclinical data, though this difference did not reach significance (32).
11C-UCB-J uptake was widespread and displayed fast kinetics that were well described by all 3 models, in agreement with previous reports (21). Given the near-perfect correlation between MA1- and 1TC-derived VT estimates, we suggest using either 1TC or MA1 for 11C-UCB-J quantification. Consistent with recent reports of age effects on 11C-UCB-J binding, we observed an effect of age on SV2A density in the caudate, where the reduction in signal remained significant after correction by fp (22). Age effects on VT remained significant for most regions after controlling for age effects on %Vol (Supplemental Table 7).
Comparison of VT estimates within and between groups requires the measured fp for a particular radioligand to be unchanged between subjects or experimental conditions. In our dataset, we observed a negative effect of age on fp for 11C-UCB-J (r2 = −0.3, P = 0.10) (Supplemental Fig. 7). We therefore took VT/fp as the primary outcome measure. Future 11C-UCB-J studies should evaluate fp and correct for any potential differences, especially when studying patient groups.
Ideally, nondisplaceable binding can be directly estimated from a reference region, which is not feasible with compounds lacking a region devoid of any binding. The use of DVR provides a partial solution to this problem by relying on a region with low specific binding, eliminating some of the intersubject variability in the estimation of individual input functions. Although no known reference region exists for 18F-BCPP-EF, we found that VT estimates were about 50% lower in the centrum semiovale than in gray matter regions. 11C-UCB-J VT estimates were about 60% lower in the centrum semiovale than in gray matter regions, supporting previous suggestions of its potential use as a reference region for 11C-UCB-J (33). Blocking studies with specific MC1 and SV2A compounds should be conducted in both healthy and disease cohorts to confirm the viability of the centrum semiovale as a reference region. 11C-SA-4503 VT was not significantly lower in white matter than in gray matter regions, making DVR an unsuitable outcome measure for this tracer.
On the basis of our time stability analyses, we conclude that scanning for at least 70, 80, and 60 min is sufficient to reliably estimate VT from a 18F-BCPP-EF, 11C-SA-4503, and 11C-UCB-J scan, respectively. Our 11C-UCB-J time stability results support those from a recent test–retest analysis of 11C-UCB-J kinetics (34).
CONCLUSION
We have established a set of optimal tracer kinetic quantification models and outcome measures for 18F-BCPP-EF, 11C-SA-4503, and 11C-UCB-J in the healthy human brain. We suggest that MA1 or 2TC can be used to quantify 18F-BCPP-EF, that MA1 should be used to quantify 11C-SA-4503, and that both MA1 and 1TC are suitable for 11C-UCB-J quantification. Lastly, our analysis of the effect of age on this dataset suggests that 18F-BCPP-EF and 11C-UCB-J signal in the caudate might serve as a marker of age-related mitochondrial dysfunction and synaptic loss.
DISCLOSURE
This project was funded by the MIND-MAPS consortium. Ayla Mansur, Eugenii Rabiner, Yvonne Lewis, Mickael Huiban, Jan Passchier, and Roger Gunn are employees of Invicro LLC; Robert Comley is an employee of AbbVie; Roger Gunn is a consultant for AbbVie, Biogen, and Cerveau. Hideo Tsukada is an employee of Hamamatsu Photonics. No other potential conflict of interest relevant to this article was reported.
KEY POINTS
QUESTION: What are the optimal kinetic modeling methods and outcome parameters for quantifying MC1, σ1R, and SV2A density as an index of mitochondrial/ER/synaptic axis function in the healthy human brain?
PERTINENT FINDINGS: In a cohort of 12 healthy volunteers who underwent a structural MRI scan and 90-min dynamic PET scans with 18F-BCPP-EF, 11C-SA-4503, and 11C-UCB-J, the MA1 and 2TC models best described the kinetics of 18F-BCPP-EF. Reliable quantification of 11C-SA-4503 was achieved using MA1, whereas both 1TC and MA1 were suitable for 11C-UCB-J quantification.
IMPLICATIONS FOR PATIENT CARE: The methods established here can be applied to patient cohorts assessing the same 3 ligands to potentially stratify patients or monitor the progression of molecular neuropathology.
Acknowledgments
We thank Elbert Perez, Ryan Janisch, and Mark Tanner for their expert assistance. We also thank the Yale University PET Center for providing the centrum semiovale regional definition.
The MIND-MAPS Consortium includes Laurent Martarello, Biogen; Robert A. Comley, AbbVie; Laigao Chen, Pfizer; Adam Schwarz, Takeda; Karl Schmidt, Celgene; Paul Matthews, Imperial College London; Marios Politis, King’s College London; Jonathan Rohrer, University College London; David Brooks, Newcastle University; James Rowe, University of Cambridge; and the authors of this article.
Footnotes
Published online Jul. 19, 2019.
- © 2020 by the Society of Nuclear Medicine and Molecular Imaging.
REFERENCES
- Received for publication March 5, 2019.
- Accepted for publication June 4, 2019.


Jump to section
Related Articles
Cited By...
- Spontaneous brain activity and synaptic density in schizophrenia: a combined [11C]UCB-J PET and fMRI study
- The relationship between brain activation and mitochondrial complex I protein levels during cognitive function in healthy humans: an [18F]BCPP-EF PET and functional MRI study of task switching
- Assessment of the relationship between synaptic density and metabotropic glutamate receptors in early Alzheimers disease: a multi-tracer PET study
- An In Vivo High-Resolution Human Brain Atlas of Synaptic Density
- Mitochondrial complex I as a diagnostic and therapeutic target in a mouse model of tauopathy
- Imaging of Synaptic Density in Neurodegenerative Disorders
- Widespread cell stress and mitochondrial dysfunction in early Alzheimers Disease