


Abstract
Absolute myocardial blood flow (MBF) and myocardial flow reserve (MFR) provide incremental diagnostic and prognostic information over relative perfusion alone. Recent development of dedicated cardiac SPECT cameras with better sensitivity and temporal resolution make dynamic SPECT imaging more practical. In this study, we evaluate the measurement of MBF using a multipinhole dedicated cardiac SPECT camera in a pig model of rest and transient occlusion at stress using 3 common tracers: 201Tl, 99mTc-tetrofosmin, and 99mTc-sestamibi. Methods: Animals (n = 19) were injected at rest/stress with 99mTc radiotracers (370/1,100 MBq) or 201Tl (37/110 MBq) with a 1-h delay between rest and dipyridamole stress. With each tracer, microspheres were injected simultaneously as the gold standard measurement for MBF. Dynamic images were obtained for 11 min starting with each injection. Residual resting activity was subtracted from stress data and images reconstructed with CT-based attenuation correction and energy window–based scatter correction. Dynamic images were processed with kinetic analysis software using a 1-tissue-compartment model to obtain the uptake rate constant K1 as a function of microsphere MBF. Results: Measured extraction fractions agree with those obtained previously using ex vivo techniques. Converting K1 back to MBF using the measured extraction fractions produced accurate values and good correlations with microsphere MBF: r = 0.75–0.90 (P < 0.01 for all). The correlation in the MFR was between r = 0.57 and 0.94 (P < 0.01). Conclusion: Noninvasive measurement of absolute MBF with stationary dedicated cardiac SPECT is feasible using common perfusion tracers.
Studies using PET have demonstrated that absolute myocardial blood flow (MBF) and myocardial flow reserve (MFR = stress/rest MBF) provide incremental diagnostic and prognostic information over relative perfusion alone (1–4). Imaging of myocardial perfusion is much more commonly performed with SPECT than with PET, but MBF measurements are not typically acquired. Measuring MBF is difficult with standard SPECT cameras because of the need for attenuation and scatter correction and the need to rotate around the patient for 3-dimensional imaging. Recent studies have shown that it is possible to obtain an index of the MFR without a direct measure of MBF using a combination of dynamic planar followed by static SPECT acquisitions (5) and that this can provide some prognostic information (6). Other studies have demonstrated that rapid camera rotation can provide dynamic tomographic data and hence a measure of MFR (7) and the arterial input function (8), suggesting that accurate measures of MBF could be possible (9). The practicality of measuring MBF has increased greatly, however, with the advent of dedicated cardiac cameras.
Dedicated cardiac cameras such as the DSPECT system (Spectrum Dynamics Medical Inc.) or the Discovery NM 530c/570c cameras (GE Healthcare) have greatly improved sensitivity and do not rotate around the patient (10). These features allow dynamic imaging with high temporal resolution that is supported by improved count density and raises the possibility of clinically practical MBF measurement with SPECT. Recent work measured an index of global MFR (11), but no studies have measured MBF. Studies have focused on the use of 99mTc-sestamibi and 99mTc-tetrofosmin as they are more common and data from these tracers have much higher count statistics than 201Tl. However, both 99mTc tracers have low extraction fractions (EFs) at high flow rates, limiting the apparent increase in MBF between rest and stress. 201Tl has a better EF but the high dosimetry of the tracer leads to increased image noise and reduced image quality. Thus, it is unclear which tracer would provide the most accurate MBF.
In this study, we evaluate the measurement of absolute MBF using a multipinhole cardiac SPECT camera in a pig model of rest followed by transient occlusion at stress using a clinically feasible acquisition protocol and clinically appropriate doses of 3 common tracers: 201Tl, 99mTc-tetrofosmin, and 99mTc-sestamibi.
MATERIALS AND METHODS
A pig model of transient occlusion of the left anterior descending (LAD) coronary artery at stress similar to Nekolla et al. (12) was used to produce a broad range of flow with regional variation. Farm-bred Yorkshire-cross female pigs (30–40 kg) were anesthetized with tiletamine, zolazepam (Fort Dodge), and xylazine (Bayer) and maintained using 2%–3% isoflurane. A thoracotomy was performed and a suture loop placed around the LAD just below the second diagonal branch. Suture lines were brought out of the chest, allowing occlusion and release during imaging. For the normal animals, the same surgery was performed but the suture loop was not placed. The number of occluded and normal pigs that completed the protocol was, respectively, 6 and 4 (201Tl), 4 and 5 (99mTc-tetrofosmin), and 3 and 1 (99mTc-sestamibi). Of these, we excluded 4 studies because the average microsphere results in the nonoccluded heart regions were more than 2.3 SDs (13) away from the mean values normally seen with this pig model, as assessed with a separate cohort of 21 animals. The range of microsphere values accepted for rest MBF, stress MBF, and MFR were 0.2–1.7 mL/min/g, 1.5–4.1 mL/min/g, and 1.1–5.1, respectively. The excluded studies were 1 occluded 99mTc-tetrofosmin study, 1 normal 201Tc study, and 2 occluded 201Tl studies. The study was performed with the approval of the University of Ottawa Animal Care Ethics Committee in accordance with the guidelines of the Canadian Council on Animal Care.
Images were acquired on a Discovery NM 530c (GE Healthcare) camera; additional details are in the Supplemental Methods (available at http://jnm.snmjournals.org) (14). For all tracers, acquisition mimicked a 1-d rest/stress 99mTc-tetrofosmin human imaging protocol. The animal was positioned supine in the camera, and for the 99mTc studies, 370 and 1,100 MBq (10 and 30 mCi) were injected at rest and stress, respectively, whereas the 201Tl studies used 37 and 110 MBq (1 and 3 mCi), respectively. Tracer was delivered intravenously using a Harvard pump (Harvard Apparatus) as a 9-mL bolus over 20 s, followed by a 9-mL saline flush over 20 s. Gold (rest) or samarium (stress) neutron-activated microspheres (BioPal Inc.) were injected by hand over 10 s into the left atrium at the same time as the tracer. For each, blood was withdrawn from a femoral artery for 4 min at 4 mL/min starting just before microsphere injection. Image data were acquired in list-mode for 11 min starting just before tracer injection. Resting images were acquired first and repeated just before stress. Stress was induced pharmacologically 1 h after the rest injection using dipyridamole (0.14 mg/kg/min over 4 min). Phenylephrine was given as needed to maintain blood pressure. At 4 min after dipyridamole, the suture was tightened, occluding the LAD. Thirty seconds after occlusion, tracer and microspheres were injected. Two minutes after tracer injection, the occlusion was released. For each animal, a CT scan (120 kVp, 1.0 mA, 2.0 rpm) was acquired for attenuation correction (AC) on an Infinia-Hawkeye 4 SPECT/CT camera (GE Healthcare), with the pig repositioned in the same orientation as in the NM 530c camera. For the normal (nonoccluded) animals, the same imaging procedure was used except that no occlusion was performed.
Immediately after the CT scan, the pig was euthanized and the heart extracted and sectioned. Similar to DaSilva et al. (15), the heart was sliced perpendicular to the long axis and divided into the apex and 4 additional approximately 1-cm-thick short-axis slabs. The apex was quartered, and the other slabs were sectioned into approximately 1-g samples after removal of the right ventricle (a total of 44–50 pieces per heart) and numbered clockwise from the LAD junction of the right and left ventricles. The sections were weighed, measured off-site at BioPal Inc., and converted into flow measurements using standard methods (16). Seventeen-segment and 3-vascular-territory polar maps of the microsphere MBF values were generated using the recorded location of each tissue sample.
The acquired list-mode data were rebinned into 9 × 10, 6 × 15, and 4 × 120 s frames. The initial frame duration was 10 s, similar to our acquisition protocol used for clinical 82Rb PET imaging. The frame duration was increased as the rate of change in the distribution slowed. Projection data for each frame were independently reconstructed using manufacturer-supplied generalized expectation-maximization maximum a posteriori iterative reconstruction (14) without corrections (NC), with CT-based AC, and with AC and scatter correction (SC) as detailed in the Supplemental Methods. SC was performed on the projection data using a dual-energy-window (99mTc tracers) or triple-energy-window (201Tl) estimate.
The reconstructed dynamic image series was processed using FlowQuant (University of Ottawa Heart Institute Research Corporation), our semiautomated in-house kinetic analysis software (17). A 1-tissue-compartment model (CM) was chosen because this model has been shown to be sufficient by others for 201Tl (18) and 99mTc-sestamibi (11). The 1 CM uptake rate constant, K1, is related to MBF by: Equation 1 assumes a generalized Renkin–Crone model for the EF in which α and β are parameters to be fit to the data, and αMBF + β corresponds to the permeability–surface-area product of the capillaries.
The FlowQuant software estimated K1 in each of 576 myocardial polar-map sectors using nonlinear weighted least-squares regression with weighting proportional to the frame duration. The goodness-of-fit was evaluated with reduced χ2 and coefficient of determination measures. The K1 polar map was then collapsed into either a 17-segment representation (19) or 3 coronary vascular territories for comparison to the microsphere data. The Spearman rank correlation between K1 and microsphere MBF was measured. The SPECT K1 and microsphere MBF data were then fit to Equation 1 using a nonlinear least-squares algorithm to determine the parameters α and β. The fitted function was used to convert SPECT K1 to MBF, and the resultant Pearson correlation to microsphere MBF was measured. The 17-segment model provided a finer sampling of the data and thus a greater range of flow values and a measure of the variability within the normal or nonoccluded regions of each heart. However, using smaller samples increases the noise in the data, and—given the spatial resolution of SPECT—the samples cannot be considered independent, which may bias measures of correlation. Therefore, we also averaged the data over the 3 coronary vascular territories and repeated our analysis.
Comparisons between reconstruction methods were done using Bonferroni-corrected paired t tests. Comparisons between tracers were done with an unpaired t test. A P value of less than 0.05 was considered significant. The noise level in the measured data was calculated as the coefficient of variation (COV) for the 17-segment data: the SD divided by the mean of the nonoccluded segments (microsphere MFR ≥ 1.5) of the heart.
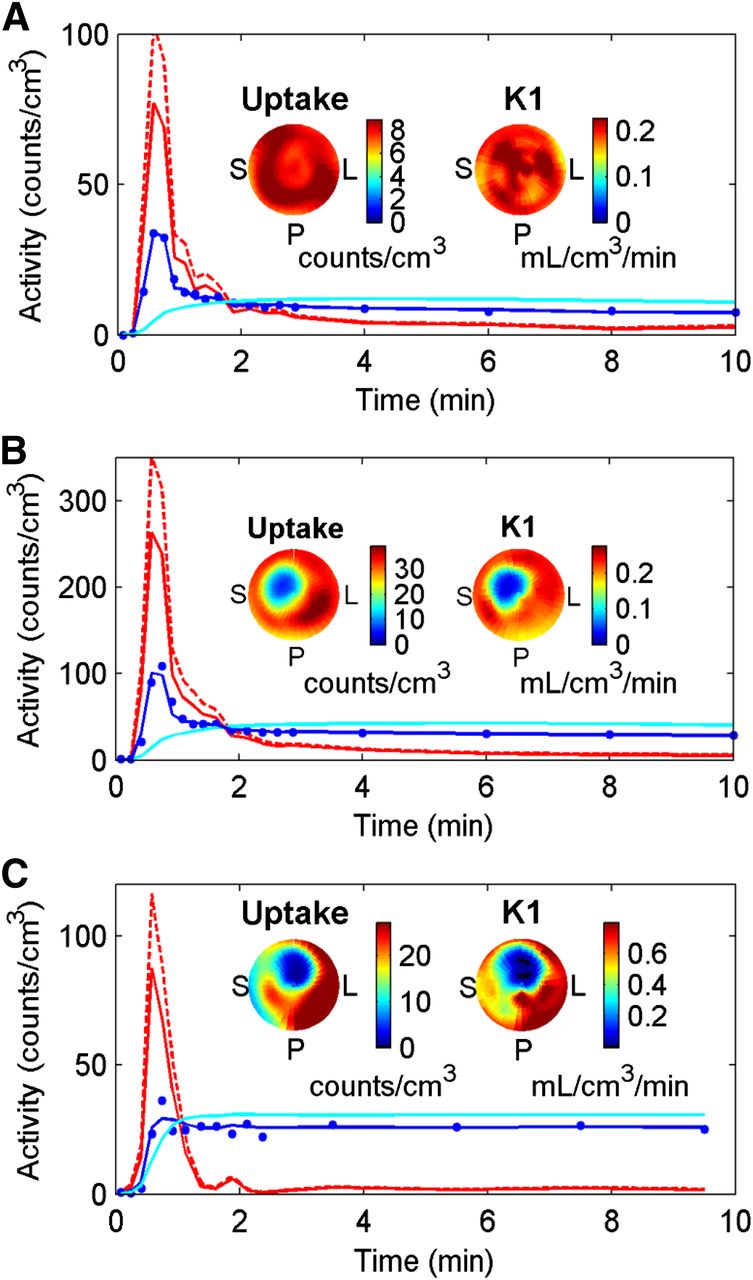
RESULTS
There was little change in the pig heart rate or blood pressure between rest and stress (Supplemental Table 1). The maximum counting rate recorded in the studies was 106 kcps at stress and 35 kcps at rest, well below the camera counting rate limit. The total counts recorded in the last 10-s frame averaged 127 and 31 kilocounts at rest for 99mTc tracers and 201Tl, respectively, and 438 and 144 kilocounts at stress for 99mTc tracers and 201Tl, respectively. In all cases, the myocardial curve showed a good fit to the measured values using the 1 CM (Fig. 1), and there was no significant difference in the reduced χ2 (P > 0.24) between the reconstruction methods. The reduced χ2 for the fit to the stress data averaged 0.99 ± 0.06 overall and 1.03 ± 0.06, 0.95 ± 0.02, and 0.99 ± 0.06 for 201Tl, 99mTc-tetrofosmin, and 99mTc-sestamibi, respectively. The values for rest were similar. The coefficient of determination (R2) of the NC fit were similar for the 99mTc tracers, averaging 0.92 ± 0.06 (rest) and 0.94 ± 0.02 (stress), and for 201Tl were 0.80 ± 0.08 (rest) and 0.93 ± 0.03 (stress). R2 values close to 1 suggest that the 1 CM was adequate to describe the shape of the measured time–activity curves. The R2 values for AC were similar to NC, but the values for AC and scatter correction (ACSC) were lower, reflecting the increase in noise due to SC; the 99mTc tracers averaged 0.88 ± 0.04 (rest, P = 0.02 vs. NC) and 0.91 ± 0.03 (stress, P = 0.05 vs. NC) and for 201Tl the R2 was 0.44 ± 0.13 (rest, P < 0.01 vs. NC) and 0.74 ± 0.06 (stress, P < 0.01 vs. NC). Despite lower R2, the K1 values for 201Tl with ACSC were still estimated with good precision (Table 1), and the COV was not significantly more than that for NC.

Representative time–activity curves from attenuation- and scatter-corrected images at rest for 99mTc-tetrofosmin (A) and at stress following subtraction of residual rest uptake for 99mTc-tetrofosmin (B) and 201Tl (C). Shown are arterial whole-blood concentrations (solid red) measured from region in left ventricle, plasma concentration or arterial blood curve corrected for tracer-blood binding (dashed red), CM fit (solid blue) to sampled values (dots) from high-count region of myocardium, and resultant estimated pure myocardium tissue curve (cyan) after correction for spillover and partial-volume effects. Also shown are uptake and K1 polar maps. Higher EF of 201Tl increases K1 value and myocardium-to-blood contrast, compared with 99mTc-tetrofosmin, but 201Tl images have increased noise (Table 1), as reflected by area of reduced uptake in right coronary artery territory of 201Tl polar map.
Homogeneity of Uptake Rate Constant K1 from 17-Segment Analysis
The uptake rate constants K1 for the 3 tracers correlated well with microsphere MBF, based on ACSC reconstructions and 17-segment analysis (Fig. 2). The results were similar for NC and AC reconstructions and for the 3-coronary-territory analysis (Supplemental Figs. 2–7). The average COV values for K1-rest, K1-stress, and the ratio of stress/rest K1 (MFR*) were 13%–23% for 201Tl and 9%–19% for the 99mTc tracers (Table 1). The average COV for the resting microsphere flow measurement was 14%. The Spearman rank correlations (ρ) (Table 2) were good for 201Tl, with a ρ of 0.76 or greater for K1 versus microsphere MBF and a ρ of 0.79 or greater for MFR* versus MFR. For 99mTc-tetrofosmin, the correlation was also good for K1 (ρ ≥ 0.65), though MFR* was lower (0.30 ≤ ρ ≤ 0.62). For 99mTc-sestamibi, the correlation was good for MFR* (ρ ≥ 0.80) and K1 with the 17-segment analysis (ρ ≥ 0.67) but lower for K1 with the 3-territory analysis (ρ ≥ 0.51).
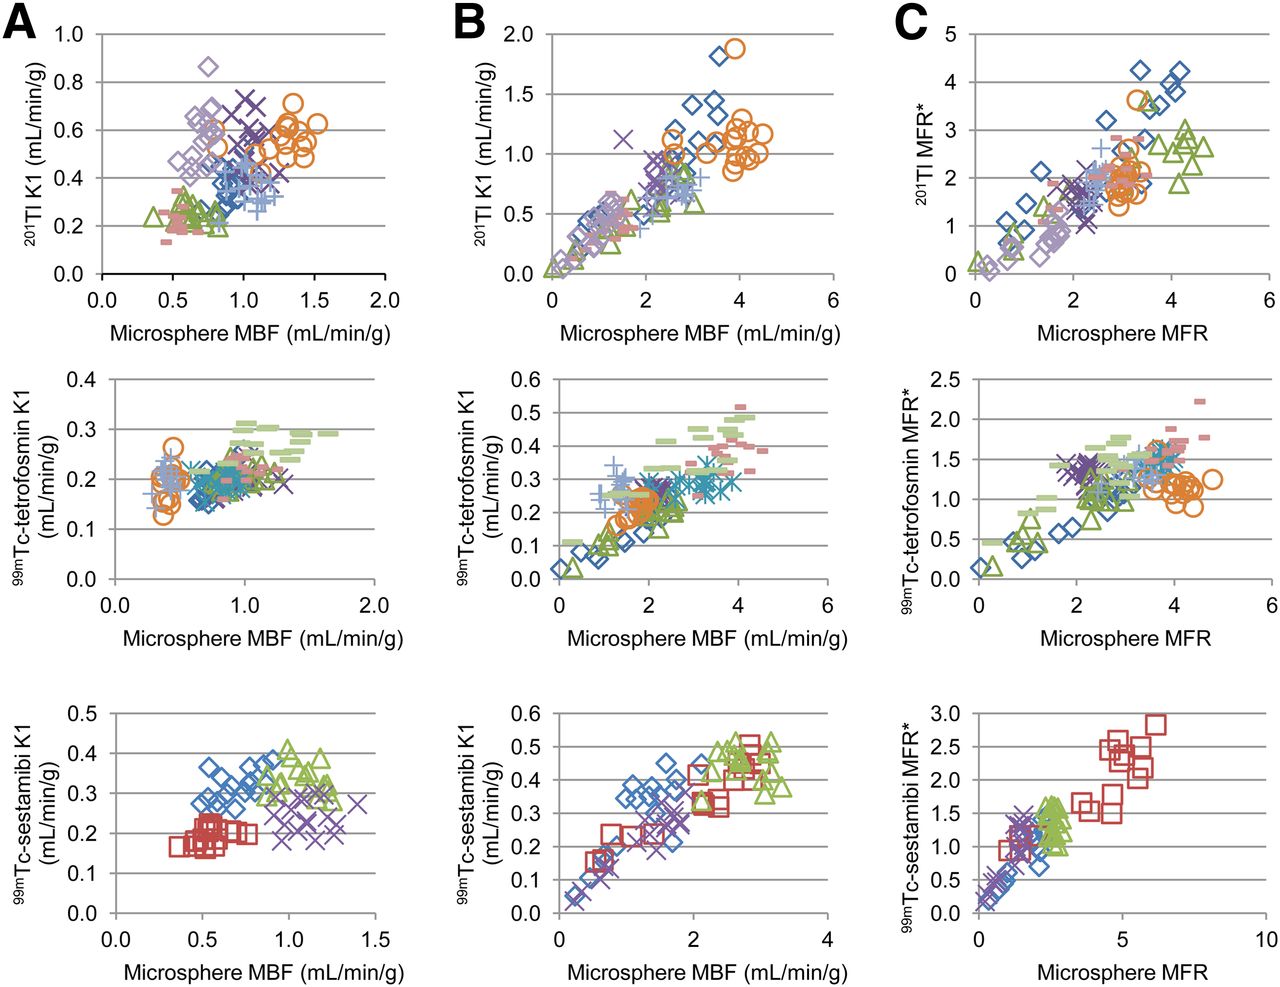
17-segment comparison of 201Tl, 99mTc-tetrofosmin, and 99mTc-sestamibi estimates of K1 to microsphere MBF at rest (A), at stress (B), and for MFR*, compared with microsphere MFR (C). Reconstructions were with ACSC.
Spearman Rank Correlation Coefficients for Tracer K1 Values, Compared with Microspheres
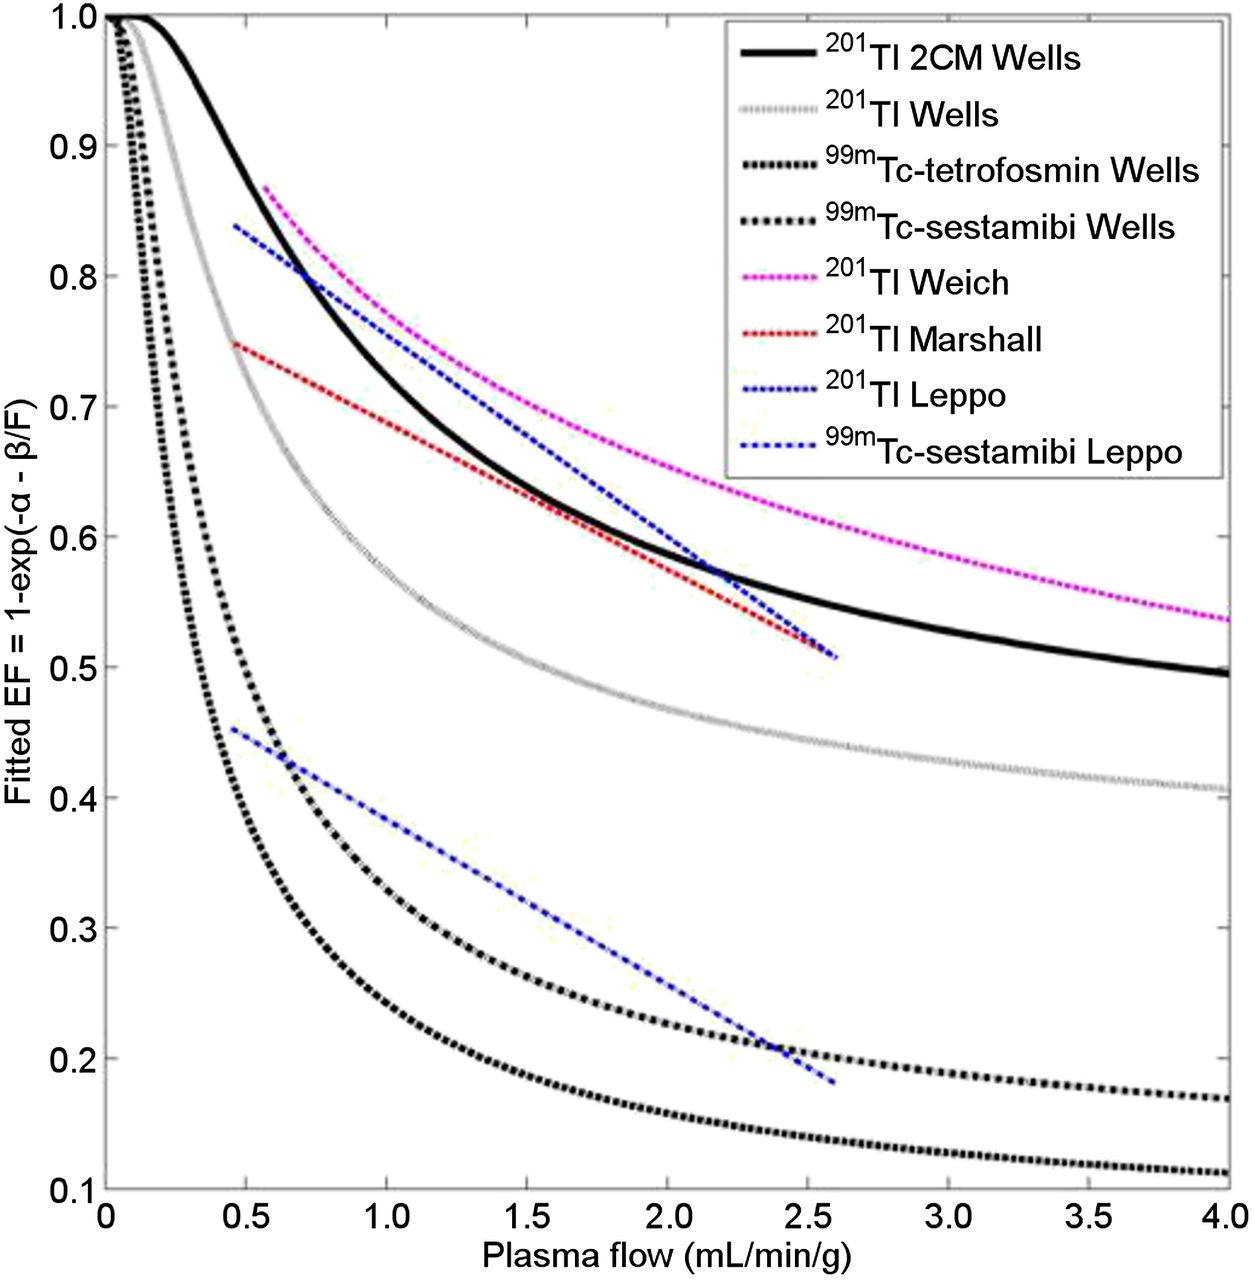
The combined 17-segment rest and stress K1 data from the ACSC images were fit to the microsphere flow values using Equation 1 (Fig. 3) and a similar fit was performed with the 3-coronary-territory data (Supplemental Fig. 8). The resulting fits (Table 3) produced EFs that matched well with the literature (Fig. 4).

17-segment nonlinear least-squares fits of K1 for rest and stress as function of microsphere MBF for 201Tl (A), 99mTc-tetrofosmin (B), and 99mTc-sestamibi (C). Images were reconstructed with ACSC. Dashed lines show 95% confidence limit on fit (solid line), and residuals are shown with dash–dot curve.
Tracer EF Function and Comparison to Microsphere MBF

Comparison of measured 1 CM EFs for 201Tl, 99mTc-tetrofosmin, and 99mTc-sestamibi. Also included is EF for 201Tl corrected to 2 CM (201Tl 2CM) by scaling K1 by 1/0.8 (18). These EFs are compared with literature values for 201Tl from Weich et al. (24), Leppo and Meerdink (25), and Marshall et al. (24) and for 99mTc-sestamibi from Leppo and Meerdink (25).
After correction of K1 to MBF, the slopes of the linear fits of 17-segment (Fig. 5) and 3-coronary-territory (Supplemental Fig. 9) SPECT MBF data to microsphere MBF were between 1.01 and 1.04. The Pearson correlation coefficients for the 17-segment MBF were all good: r = 0.75–0.83 (Table 3). For MFR, the correlation coefficient was r = 0.57 for 99mTc-tetrofosmin, r = 0.79 for 201Tl, and r = 0.89 for 99mTc-sestamibi. For the 3-coronary territory analysis, the MBF Pearson correlation coefficients were r = 0.79–90 and the MFR correlations were r = 0.62–0.94.

▪▪▪17-segment comparison of microsphere MBF to MBF measured with attenuation- and scatter-corrected 201Tl (A), 99mTc-tetrofosmin (B), and 99mTc-sestamibi (C). K1 values were converted to MBF using the fitted functions shown in Figure 3.
DISCUSSION
This study demonstrates, for the first time to our knowledge, the accurate quantification of MBF in an ischemic pig model using attenuation- and scatter-corrected dynamic SPECT imaging with 201Tl, 99mTc-sestamibi, and 99mTc-tetrofosmin on a cardiac-dedicated scanner.
AC and SC improve the accuracy of the images but also increase noise. Image noise varied with the radiotracer and reconstruction method as shown by the COV in Table 1. Considering all of the tracers combined, at stress AC has a lower COV than NC (P = 0.02) or ACSC (P < 0.01) and ACSC is not significantly different from NC (P = 0.56). The results for rest and MFR were similar. Thus, the increase in noise with AC was more than offset by the reduction in attenuation artifacts but, whereas SC may improve accuracy, it came at the cost of increasing COV back to NC levels. Reducing noise by including scatter within the reconstruction or using more advanced multidimensional reconstruction algorithms (9) might thus be beneficial. When 201Tl was compared with 99mTc-tetrofosmin, the noise levels were not significantly different with NC (P > 0.18), but 201Tl had significantly higher COV with AC and ACSC (P < 0.02). These differences reflect the increased noise in the 201Tl images caused by a reduced amount of injected tracer. The rank correlations of K1 and MFR* with microsphere MBF and MFR (Table 2) were similar for all reconstruction methods.
The 99mTc-tetrofosmin and 99mTc-sestamibi results (Figs. 2 and 3) showed the expected reduction in measured K1 and MFR* at higher blood flow values (20). Thus, although the noise levels in the 99mTc datasets were lower than with 201Tl, the ratio of normal stress over rest flow (MFR) was also lower, producing a similar signal-to-noise ratio. For NC, AC, and ACSC in the nonoccluded segments of the heart, both 201Tl and 99mTc-tetrofosmin produced average MFR*s that were 2.1–2.6 SDs above 1, and for 99mTc-sestamibi they were 1.5–1.8 SDs above 1 (Table 1). The average measured MFR* value for 99mTc-sestamibi (1.3–1.5) is in agreement with other studies that have measured MFR* with SPECT using simplified alternative methods (5,11). Benefiting from the higher mean MFR* values for 201Tl will require improved techniques to reduce noise such as prior-based multidimensional reconstruction (9).
The injected activities used in these studies were typical of 1-d human clinical protocols. The pigs in this study were smaller than typical patients, resulting in less attenuation and scatter and leading to better-quality images for dynamic processing. In addition, there is increasing motivation to capitalize on the dedicated cardiac camera’s increased sensitivity to reduce the patient radiation exposure. These factors may lead to a decreased signal-to-noise when applying this approach to human studies. Evaluation in humans against an accepted gold standard such as quantitative PET perfusion imaging is needed before considering implementation of this technique for routine clinical SPECT flow measurement.
In this study, the tracer was injected as an extended bolus over 20 s. Our typical clinical protocol for 82Rb flow imaging with PET uses a constant-activity-rate injection over 30 s whereas others have suggested a much more rapid injection (11). Previous work with PET has shown that use of longer tracer injection times can improve the quantitative accuracy and precision of flow measurements (21). Our data were reprocessed by subdividing the three 10-s frames near the peak of the arterial input function into ten 3-s frames in an effort to better sample the peak. The results (not shown) did not show any improvement in correlation with microsphere flow. However, further work would be needed to determine whether extending the bolus duration could improve the SPECT flow measurements.
Release of the occlusion 2 min after tracer injection will result in a change in flow and potentially reactive hyperemia within the occluded tissues. The uptake of 99mTc tracers is rapid and static, but 201Tl is known to redistribute after reperfusion (22). Residual tracer in the blood or redistributing tracer during the last 9 min of imaging would be taken up under different flow conditions after reperfusion and this may have degraded the accuracy of 201Tl MBF measurements, compared with microspheres in the ischemic region.
This work used a 1 CM to fit all of the data for both 201Tl and 99mTc tracers. Previous work with 201Tl has suggested that although a 2 CM is more accurate physiologically (18), the 1 CM produces K1 estimates that are almost as accurate and are related to the 2 CM fits by a simple scaling factor of 0.8. These results suggest that a 1 CM may be more suitable for practical application for which the noise levels in the images are higher and imaging times are shorter (23). Scaling our 1 CM K1 values by 1/0.8 generates an EF for 201Tl that agrees with the literature (Fig. 4) (24–26). However, the number of animals used in our study was limited, and the value of a 1 CM over a 2 CM must still be assessed in more complex disease states such as mixed-normal, ischemic, and infarcted tissues. Considered separately, the ischemic and remote territories at stress were mostly not significantly different from microspheres but showed a trend toward underestimation of MBF that will require further study (Supplemental Table 3). The appropriate model for the 99mTc tracers has not been extensively explored. However, other studies using a 1 CM with a k2 of 0 (5,11) have demonstrated a successful measurement of global MFR*. In addition, the reduced χ2 values and R2 values of the fits to the 99mTc data suggest that the 1 CM provided a good description of the tracer kinetics in our experiments. Also, the EF for 99mTc-sestamibi using the 1 CM agrees with previous literature (Fig. 4) (25). Nevertheless, a more complex model could lead to an improvement in the correlation with microspheres and could be explored in future studies.
This study used a clinically feasible acquisition protocol and clinically appropriate doses of 3 common tracers. However, 99mTc tracers have limited extraction at high flow rates, and although studies measuring MFR with these tracers are promising (6,11) contrast between stress and resting flows will be less than that typically seen with PET. SPECT also has lower sensitivity than PET, increasing the noise in the images despite the increased sensitivity of the dedicated cardiac SPECT cameras, and SPECT spatial resolution is worse than PET, which increases partial-volume effects. Finally, there were only 19 animals used in the study, divided over 3 tracers. The limited number of samples at the extreme ends of the MBF range may affect the fit and introduce some error into the final measure values. Also, tracer uptake and response to dipyridamole varies among animals and so caution should be exercised to not overgeneralize the results of these experiments. Thus, whereas these pig studies show a promising correlation with microsphere MBF, full validation in humans is needed before we can confidently move to clinical implementation.
CONCLUSION
We have demonstrated that it is possible, in a pig model of rest and transient occlusion at stress, to use a stationary dedicated cardiac camera to perform dynamic SPECT for the measurement of absolute myocardial blood flow with 201Tl, 99mTc-tetrofosmin, and 99mTc-sestamibi. The correlations of the SPECT- to microsphere-derived flow values were good (r ≥ 0.75). The approach used is readily translated to human studies and could provide incremental diagnostic and prognostic information over relative perfusion alone but will require further validation before it can be clinically implemented.
DISCLOSURE
The costs of publication of this article were defrayed in part by the payment of page charges. Therefore, and solely to indicate this fact, this article is hereby marked “advertisement” in accordance with 18 USC section 1734. This research was supported by grants from the Heart and Stroke Foundation of Canada (NA6939, BR7489) and a grant from the Canadian Institutes of Health Research and the Natural Sciences and Engineering Research Council of Canada (NSERC) (RMIPJ 389641-09). R. Glenn Wells and Terrence D. Ruddy collaborate with GE Healthcare on research projects and have received honoraria for speaking at GE Healthcare User Meetings. Robert deKemp and Ran Klein receive revenues from the sale of FlowQuant. No other potential conflict of interest relevant to this article was reported.
Footnotes
Published online Sep. 4, 2014.
- © 2014 by the Society of Nuclear Medicine and Molecular Imaging, Inc.
REFERENCES
- Received for publication February 27, 2014.
- Accepted for publication July 28, 2014.


Jump to section
Related Articles
Cited By...
- Radiotracer Imaging Allows for Noninvasive Detection and Quantification of Abnormalities in Angiosome Foot Perfusion in Diabetic Patients With Critical Limb Ischemia and Nonhealing Wounds
- Optimization of SPECT Measurement of Myocardial Blood Flow with Corrections for Attenuation, Motion, and Blood Binding Compared with PET
- Quantitative Assessment of Coronary Microvascular Function: Dynamic Single-Photon Emission Computed Tomography, Positron Emission Tomography, Ultrasound, Computed Tomography, and Magnetic Resonance Imaging
- Absolute Myocardial Blood Flow and Flow Reserve Assessed by Gated SPECT with Cadmium-Zinc-Telluride Detectors Using 99mTc-Tetrofosmin: Head-to-Head Comparison with 13N-Ammonia PET
- Integration of Quantitative Positron Emission Tomography Absolute Myocardial Blood Flow Measurements in the Clinical Management of Coronary Artery Disease
- SPECT Myocardial Perfusion Reserve in Patients with Multivessel Coronary Disease: Correlation with Angiographic Findings and Invasive Fractional Flow Reserve Measurements