


Abstract
Cerenkov luminescence imaging (CLI) is an emerging imaging technique that combines aspects of both optical and nuclear imaging fields. The ability to fully evaluate the correlation and sensitivity of CLI to PET is critical to progress this technique further for use in high-throughput screening of pharmaceutical compounds. To achieve this milestone, it must first be established that CLI data correlate to PET data in an in vivo preclinical antitumor study. We used MLN4924, a phase 2 oncology therapeutic, which targets and inhibits the NEDD8-activating enzyme pathway involved in the ubiquitin–proteasome system. We compared the efficacious effects of MLN4924 using PET and Cerenkov luminescence image values in the same animals. Methods: Imaging of 18F-FDG uptake was performed at 5 time points after drug treatment in the subcutaneously implanted diffuse large B-cell lymphoma tumor line OCI-Ly10. Data were acquired with both modalities on the same day, with a 15-min delay between CLI and PET. PET data analysis was performed using percentage injected dose per cubic centimeter of tissue (%ID/cm3), average standardized uptake values, and total glycolytic volume. CLI measurements were radiance, radiance per injected dose (radiance/ID), and total radiant volume. Results: A strong correlation was found between PET total glycolytic volume and CLI total radiant volume (r2 = 0.99) and various PET and CLI analysis methods, with strong correlations found between PET %ID/cm3 and CLI radiance (r2 = 0.83) and CLI radiance/ID (r2 = 0.82). MLN4924 demonstrated a significant reduction in tumor volume after treatment (volume ratio of treated vs. control, 0.114 at day 29). Conclusion: The PET and CLI data presented confirm the correlation and dynamic sensitivity of this new imaging modality. CLI provides a preclinical alternative to expensive PET instrumentation. Future high-throughput studies should provide for quicker turnaround and higher cost-to-return benefits in the drug discovery process.
The emergence of targeted cancer therapies has been met with a parallel increase in the use of biomarkers as an indicator of the biologic state of tumors. As a general category, biomarkers comprise peripheral, tissue biopsy, and imaging methods and allow for a more refined clinical development path forward for therapeutic compounds (1,2). Moreover, there is increasing interest in the role of medical imaging for both clinical and preclinical research and biomarker qualification (3–6). Among the imaging technologies, PET with the glucose analog 18F-FDG is perhaps the most widely used exploratory imaging biomarker in oncology research and clinical trials (7,8). 18F-FDG exploits the well-known dependence of tumors on glucose metabolism as the primary source of energy (9–12). To facilitate the translation of imaging biomarkers from research to development, many preclinical imaging facilities use a multimodal approach, wherein the strengths of each individual modality can be combined and leveraged for the development of robust assays (13,14).
In previously published work, we demonstrated the first in vivo use of Cerenkov luminescence imaging (CLI) with a highly sensitive and ultracooled charged-coupled device camera, allowing detection of this optical emission (15). Cerenkov radiation is produced when a high-energy, charged particle travels with a velocity that exceeds the speed of light through a medium (16–19). The charged particle induces a local polarization along its path as it passes through the medium, and light is emitted in a continuous spectrum from the near-ultraviolet through the visible spectrum as the local polarization returns to normal. The photon output as a result of the Cerenkov effect is low, complicating detection (20,21); however, the sensitivity of modern imaging systems makes it possible to detect and quantify the light. CLI uses radionuclides commonly used in PET and SPECT, thereby allowing researchers the ability to monitor a wide range of energy-qualified radionuclides for distribution and uptake. Other researchers have corroborated and expanded on the current radionuclide list that has been imaged by CLI (20–23). One example of this is in a recent publication by Ruggiero et al. (24), who observed a strong correlation between PET and CLI for the imaging of a radiolabeled antibody, 89Zr-DFO-J591, in LNCaP tumors.
In this work, we sought to confirm the dynamic sensitivity of CLI to the antitumor agent MLN4924 while correlating CLI to PET measurements. Briefly, we performed time point–matched CLI to directly correlate with PET measurements. MLN4924 is an investigational first-in-class small-molecule inhibitor of NEDD8-activating enzyme (NAE). NAE is an essential component of the NEDD8 conjugation pathway in the ubiquitin–proteasome system, and MLN4924 has demonstrated potent antitumor activity against several cell lines (25–28).
MATERIALS AND METHODS
Animal Models and Drug Treatment
Sixteen female SCID mice (mean weight ± SD, 22.5 ± 3 g; age, 5–6 wk) were used in this study. All animals were housed and handled in accordance with the Guide for the Care and Use of Laboratory Animals (29) under approved protocols of the Millennium Institutional Animal Care and Use Committee. Mice were inoculated subcutaneously in the right flank with the diffuse large B-cell lymphoma OCI-Ly10 cell line (4 × 10⁶ cells in 100% Matrigel; BD Biosciences). Tumor growth was monitored with calipers ((width2 × length)/2), and once the mean volume was 400 mm3, baseline PET and CLI scans were obtained. Animals were then randomized into treatment groups (n = 8 per group), and treatment was initiated (60 mg/kg twice per day). Group 1 was the vehicle group (volume, 200 μL subcutaneously, 10% β-cyclodextrin), and group 2 was the MLN4924 treatment group (volume, 200 μL; subcutaneously). The dosing schedule used for this study was 5 d on/5 d off, repeated for 2 cycles. Furthermore, from day 16 to day 29, there was no treatment, to allow for tumor regrowth. Including baseline, PET and CLI were conducted on days 1, 3, 13, and 29.
Radioisotopes
18F-FDG was prepared using the Coincidence Technologies FDG synthesis module. 18F-fluoride was produced via the 18O(p, n)18F nuclear reaction by irradiation of isotopically enriched 18O-water with protons using a medical cyclotron operated by PETNET Solutions.
Imaging Methods
Prescanning Preparation
Before scanning, mice were kept fasting for 6 h using custom-built, computer-controlled cages that safely removed food at intervals that matched the scanning schedule. At 1 h before PET, the animals were heated for 5 min under a heat lamp. Next, 11.1 MBq of 18F-FDG (0.01–0.1 mL) was administered via the tail vein with a 27-gauge 1.27-cm (0.5-in) insulin syringe (Terumo Medical). Animals were returned to their cages, which were placed on a water-jacketed heating blanket. Tracer distribution proceeded in warmed conscious animals with access to water ab libitum.
CLI
Forty minutes after 18F-FDG injection, anesthesia was induced in pairs of animals with 3%–5% isoflurane (Baxter International Inc.) delivered in 1.0 L of medical-grade air per minute. When unresponsive to toe pinch, animals were then positioned in the optical scanner (IVIS Spectrum; Caliper Life Sciences), on which anesthesia gas flow was reduced and maintained at 2%–3% isoflurane. The CLI data were acquired using a 5 min, open filter (field of view, 13.2 cm; bin, 8; f-stop, 1), with the animals positioned on the left flank, such that the tumor was facing the charged-coupled device.
PET
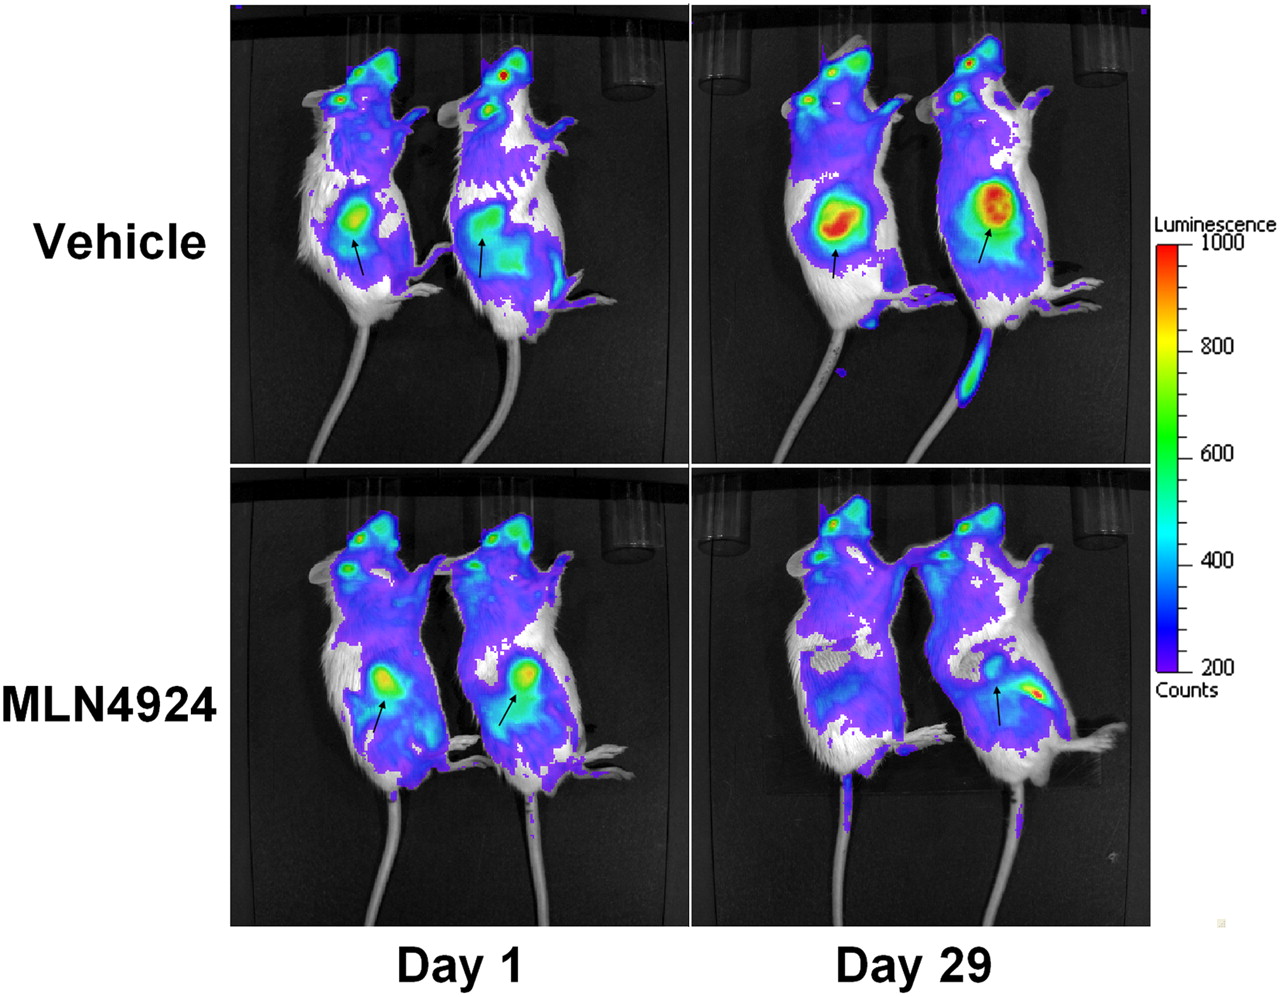
After completion of the CLI scan, animals were transported to the PET scanner (Inveon microPET; Siemens Medical), on which 2%–3% isoflurane was maintained. The customized 2-animal bed positions the animals head to tail relative to one another, thereby minimizing image artifacts arising from 2 hot bladders side by side (Fig. 1). The animals were positioned such that the tumors were in the center of the PET field of view.

PET images from representative pairs of animals. Reduction in signal intensity can be observed after treatment, indicating reduction in uptake of 18F-FDG in tumor. Arrows refer to tumor location.
A 5-min PET scan was acquired (350- to 650-keV energy window, 3-ns timing window). For attenuation correction of the PET data, a CT scan was obtained using the manufacturer's optimized settings.
All raw small-animal PET scan data were sorted into 3-dimensional sinograms and Fourier rebinned. Images were reconstructed using a 2-dimensional ordered-subset expectation maximization algorithm (30) with the following parameters: a ramp filter with 0.5 of the Nyquist frequency as the cutoff frequency, 5 iterations, 128 × 128 × 157 array size, and 0.78 × 0.78 × 0.78 mm voxel size. Ultimately, 78 paired CLI and 18F-FDG PET data points were acquired and included in the analysis. Animals not included in the final analysis were removed from the study because of internal Institutional Animal Care and Use Committee humane endpoint standards.
Data and Statistical Analysis
PET
The volume of interest containing the tumor was determined manually using the image analysis software ASIPro (Siemens Medical). Tumor volumes were determined from the PET images. Image figures were produced using VivoQuant (inviCRO). From the volume of interest, average signal intensity values were recorded and converted into the concentration of 18F-FDG using a calibration factor that was generated from a cylinder phantom before the start of the study.
From the PET images, the following 3 quantitative parameters of tumor 18F-FDG uptake were measured: percentage of injected dose per centimeter cubed of tissue, %ID/cm3 = 100 × [18F-FDG]/ID; average standardized uptake values, SUVave = [18F-FDG]/(ID/BW); and total glycolytic volume, TGV = SUVave × TV. [18F-FDG] is the concentration of 18F-FDG in tissue (MBq/cm3), TV is tumor volume from the PET image (cm3), ID is decay-corrected injected dose (MBq), and BW is body weight.
CLI
Analysis was performed on the luminescence data using the Living Image 4.0 software (Caliper Life Sciences). Data analysis was performed on the radiance in p/s/cm2/sr (where sr is steradians) of a region of interest (ROI) encompassing the tumor. Tumor volume was determined by the PET volume. In addition, we introduced 2 new analysis techniques that could be used for the analysis of CLI data—radiance per injected dose (Rad/ID) and total radiant volume (TRV = RadID × TV).
Statistical Analysis
Correlation analysis and statistical testing of data were performed with Prism 4.0. (GraphPad Software, Inc.). Significance of the correlation analysis was evaluated using the P value of the linear regression. The differences between MLN4924-treated and vehicle groups were determined by Student t test, and significance was measured at a P value less than 0.05. All graphed data are presented as mean ± SEM.
RESULTS
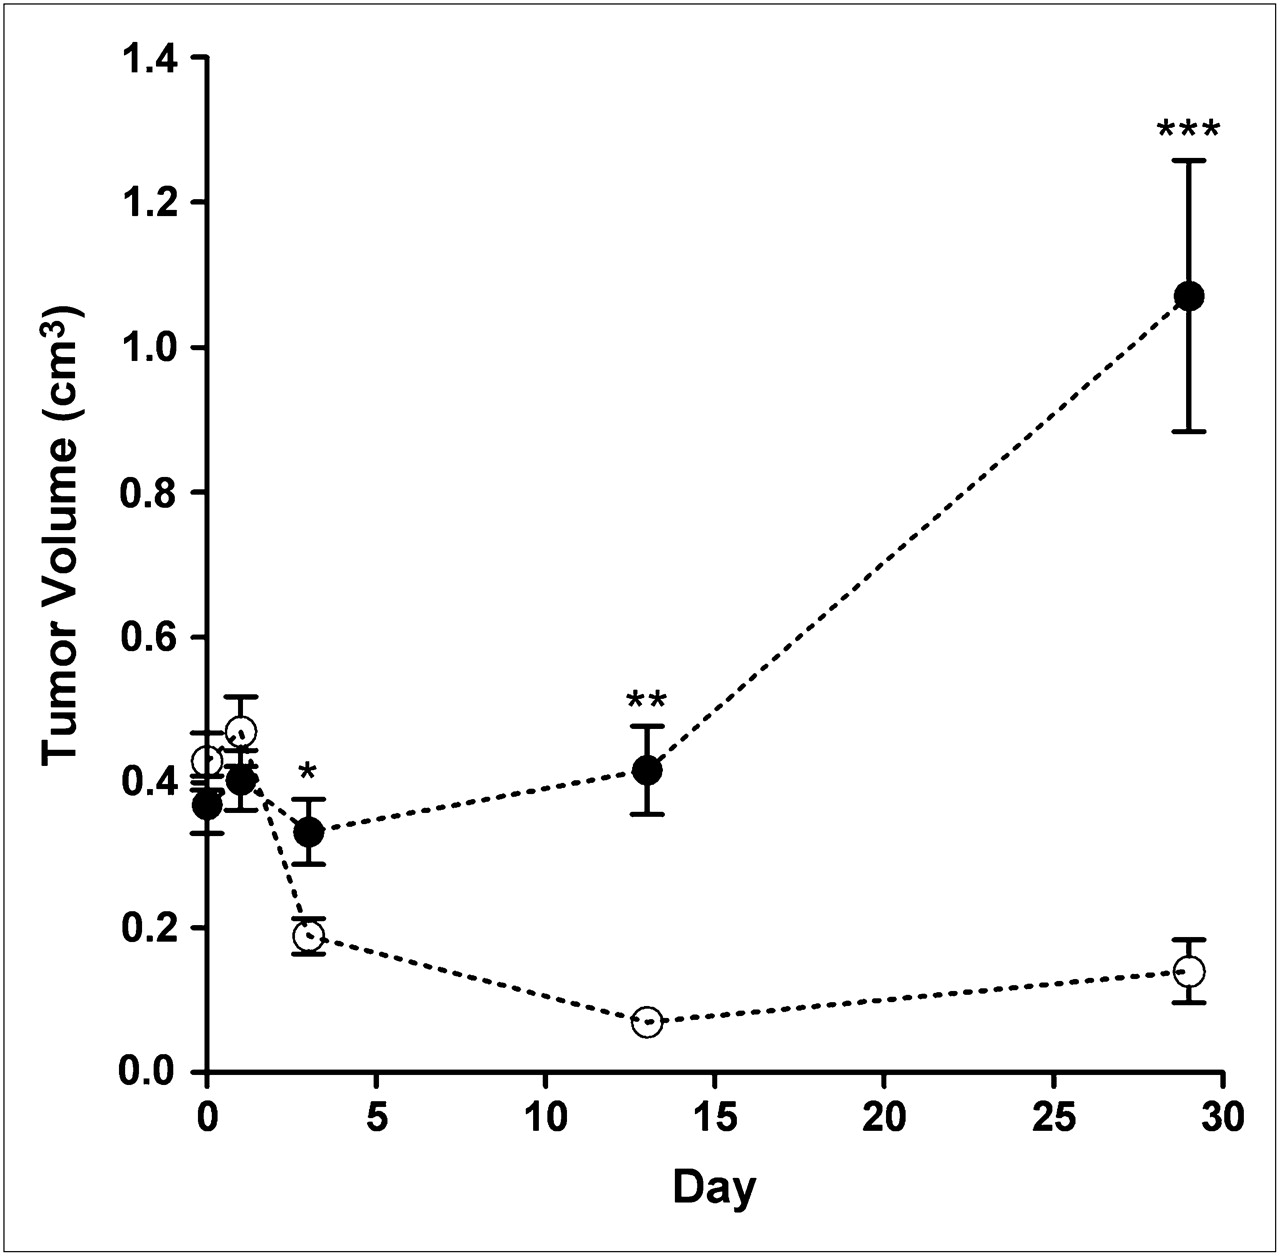
The potent antitumor activity of MLN4924 is demonstrated by the significant reduction in tumor volume after treatment (Fig. 2) and is consistent with other published work highlighting the sensitivity of the OCI-Ly10 line to MLN4924 treatment (28).

MLN4924 treatment results in reduction in tumor volume from baseline of 56% on day 3 and 84% on day 13 in OCI-Ly10 xenograft model. Treatment was halted on day 15 of study, and volume reduction is durable when compared with both baseline (−64%) and vehicle group (−87%). *P < 0.05. **P < 0.01. ***P < 0.001.
In Figure 1, the PET images from representative pairs of animals are shown. The top row is the vehicle-treated cohort on days 1 and 29 (the full time course is shown in Supplemental Fig. 1; supplemental materials are available online only at http://jnm.snmjournals.org) at each of the imaging days, and the bottom row is the MLN4924-treated group. Visually, a reduction in the signal intensity can be observed after treatment. Figure 3 shows the PET image analysis results for SUVave and %ID/cm3 (Supplemental Fig. 2 also shows TGV). In the MLN4924 group, there is an acute increase in 18F-FDG uptake on day 1 relative to the baseline. The SUVave in the MLN4924 group increased by 19.5% (P < 0.005), %ID/cm3 increased 21.0% (P < 0.005), and TGV increased by 32.4% (however, this value was not statistically significant, likely because of the variance of the tumor volume [TGV = SUVave × TV]). No change was observed in the vehicle treatment group. By day 3, neither the SUVave nor the %ID/cm3 revealed any drug effect; however, the TGV in the MLN4924 group was reduced, as compared with the vehicle treatment (−43.3%, P > 0.005) (Supplemental Fig. 2). On day 13, all PET parameters were significantly reduced, as compared with vehicle treatment, by 21.3%, 25.6%, and 86.1% for SUVave, %ID/cm3, and TGV, respectively (P < 0.005). Further, on day 13, the %ID/cm3 of the MLN4924 group was 26.9% below the baseline value for that group (P < 0.005). By day 29, the SUVave and %ID/cm3 values returned to baseline; however, because of the large reduction in tumor volume (Fig. 1), the TGV remained significantly reduced (P < 0.005).
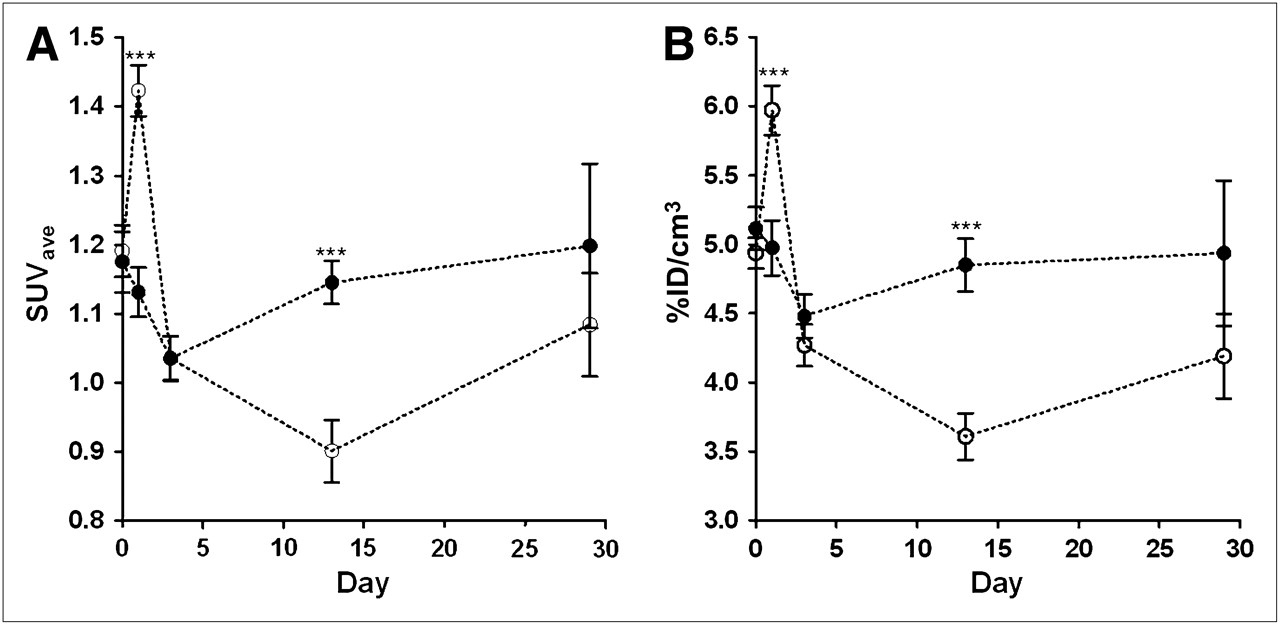
SUVave (A) and decay-corrected %ID/cm3 (B). On day 13, all PET parameters are significantly reduced, as compared with vehicle treatment, by 21.3% and 25.6% for SUVave and %ID/cm3, respectively (P < 0.0001). ***P < 0.001.
In Figure 4, the Cerenkov luminescence images from the same representative animals as in Figure 1 are shown. The top row is the vehicle-treated cohort at each of the imaging days, and the bottom row is the MLN4924-treated group. As observed in the PET data, there is a visual reduction in the image signal intensity in the MLN4924 treatment group that is consistent with a reduction in 18F-FDG uptake. The Cerenkov luminescence image analysis results are shown in Figure 5. The radiance and radiance per decay-corrected injected dose per centimeter cubed (radiance/ID) are shown in Figs. 5A and 5B, respectively (TRV is included in Supplemental Fig. 4). The flared increase of 18F-FDG uptake observed on the PET data was also measured by CLI, with a baseline-to-day-1 change of 17.7% (P < 0.005), 17.4% (P < 0.005), and 27.6% (P > 0.005) for radiance, radiance/ID, and TRV, respectively.
Cerenkov luminescence images from representative pairs of animals. As observed on PET data, there is visual reduction in image signal intensity in MLN4924 treatment group that is consistent with reduction in 18F-FDG uptake (Fig. 1).

Cerenkov luminescence image analysis: radiance (A) and radiance/ID (B). On day 13, CLI parameters for MLN4924-treated group were all significantly reduced from baseline (30.9% and 30.4%) and from vehicle-treated values (37.5% and 37.2%) for radiance and radiance/ID, respectively (all P < 0.0001). **P < 0.01. ***P < 0.001.
The analysis for the remaining days of the study yielded CLI results similar to results observed on PET. The radiance and radiance/ID CLI analysis methods on day 3 revealed no statistically significant difference in the MLN4924 group, as compared with vehicle; however, TRV was significantly reduced (P > 0.005), as was PET TGV (Supplemental Figs. 2 and 4).
On day 13, the CLI parameters for the MLN4924-treated group were all significantly reduced from baseline (30.9%, 30.4%, and 87.9%) and from the vehicle-treated values (37.5%, 37.2%, 88.9%) for radiance, radiance/ID, and TRV, respectively (all P < 0.0001). The reduction from baseline was consistent with the values measured by PET. Visual comparison of PET and CLI modalities between a single animal is shown in Supplemental Figure 6. Supplemental Figures 6A and 6C are on day 0 and 6B and 6D are on day 13. A clear visual decrease can be seen between each imaging modality over the length of the study.

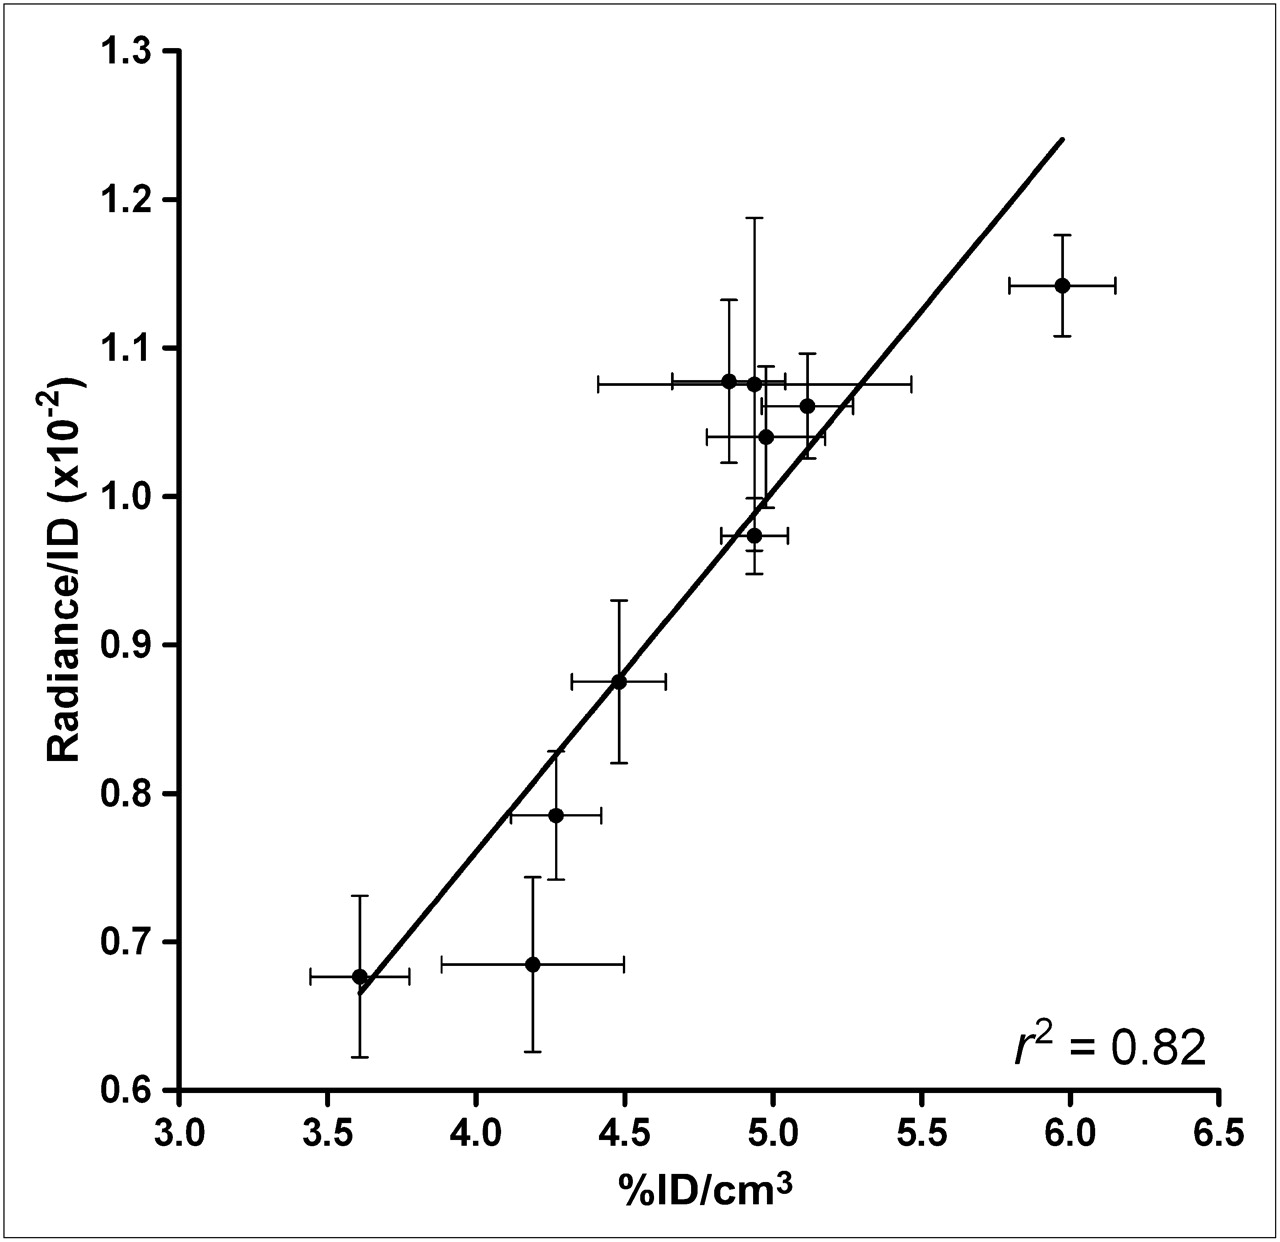
There was strong correlation between PET %ID/cm3 and CLI radiance/ID (r2 = 0.82). Correlations between PET %ID/cm3 and CLI radiance (r2 = 0.83) and other parameters are shown in Supplemental Figure 5.
Figure 6 shows the correlation between selected parameters. Overall, there was a high and statistically significant correlation among the various PET and CLI analysis methods, such as PET %ID/cm3 and CLI radiance/ID (r2 = 0.82) (Fig. 6). Additionally, PET %ID/cm3 and CLI radiance (r2 = 0.83) and PET TGV and CLI TRV (r2 = 0.99) also were highly correlated (Supplemental Fig. 5).
DISCUSSION
In the current report, we demonstrate the correlation of 18F-FDG CLI with PET in a pharmaceutical drug study. The findings corroborate other recent publications (20–24) that demonstrate the significant correlation between these imaging methods. In addition, we have provided data that strengthen this argument with a novel therapeutic compound and strong statistical power (78 images each for CLI and PET). Further, these experiments were conducted specifically to address a common question asked about CLI—that is, if the sensitivity of this technique is an adequate substitute for PET when monitoring pharmaceutical effects. The main finding is that there is a statistically significant correlation between CLI and PET of 18F-FDG in a flank xenograft model, thus continuing to build the basis for acceptance of CLI. The final aim of this work was to propose analysis methods suitable for CLI studies. The results show a high visual (qualitative) and statistical correlation between PET and CLI readouts—specifically, PET %ID/cm3 and CLI radiance (r2 = 0.83), CLI radiance/ID (r2 = 0.82), PET TGV, and CLI TRV (r2 = 0.99). Ultimately, rather than reporting radiance, as is commonplace for bioluminescence studies, CLI analysis should include normalization of signal by the injected dose, which can vary and directly affects light output. Further, although in this work the tumor volume was measured from the PET images, TRV estimates derived from caliper volumes can also be performed.
Targeted inhibition of the NEDD8 conjugation pathway in the ubiquitin–proteasome system results in the stabilization of proteins involved in cell cycle regulation, signal transduction, DNA replication, and stress response, among others (25–27). As reported previously by Milhollen et al. (28), there is a potent and acute antitumor effect observed after treatment with MLN4924. This tumor volume effect is paralleled by a reduction in the uptake of 18F-FDG in the MLN4924-treated animals as measured by both PET and CLI techniques. Along with the reduction in tumor volume, there is also a reduction in the uptake of 18F-FDG in the tumor as measured by both PET and CLI techniques. The interpretation of the reduction in 18F-FDG PET signal is that treatment with MLN4924 results in a diminution of glucose metabolism and that uptake is predictive of response.
Regarding the goal of monitoring 18F-FDG uptake in MLN4924-treated xenograft tumors, the findings of the CLI study recapitulate the PET data in magnitude, statistical significance, and, most importantly, interpretation. For example, on day 13, the PET %ID/cm3 in the MLN4924 group was −25.6%, as compared with baseline, and the CLI radiance/ID was −30.4%. From these data, we concluded that MLN4924 treatment in this preclinical lymphoma model significantly reduces tumor glucose metabolism and uptake. The only time point that differed was day 29. The PET SUVave and %ID/cm3 (Figs. 3A and 3B) had returned to baseline whereas the CLI radiance and radiance/ID parameters (Figs. 5A and 5B) were significantly reduced (P < 0.01). The PET-derived SUVave and %ID/cm3 may prove more sensitive for the detection of tumor microenvironment and metabolism changes during intermittent dosing schedules. In this case, they suggest that a full restoration of glucose metabolism has occurred after the termination of treatment. This conclusion is difficult to reconcile given that at all other time points, over a range of various tumor uptake amounts, the PET and CLI data were matched. Rather, it may be that the tissue microenvironment has changed to alter the light output; for example, if the tumor were edematous after treatment, the refractive index of the tissue would change, altering the Cerenkov threshold and, thus, light output. Finally, regrowth of the tumor is marked by increased vasculature and blood volume, thereby increasing the absorption of light, especially in the tissue-penetrating red portion of the spectrum. These data were included in our correlation analysis and could partly explain why we did not achieve the r2 values near 1 reported by Liu et al. (20) and Ruggiero et al. (24).
For in vivo imaging, CLI is complicated by the absorption and scatter of light, reducing the detectable external signal and possibly explaining some signal differences noted between PET and CLI experiments. The absorption and scatter of light will be dependent on the constituents of the tissue. For instance, highly vascularized (i.e., viable) tissue will have optical properties different from necrotic tissue; thus, the emitted light is encoded with spectroscopic information, and studies are ongoing to better understand this hypothesis and to determine the sensitivity of a CLI scan (i.e., the proportional generated light that is detectable). However, it is apparent that light in the blue portion of the spectrum will not penetrate deeply in tissue. Our previous calculations (15) suggest an average of 3 photons (250–600 nm) per positron decay, and more recent simulations are refining that estimation to 2.4. Thus, although there is signal reduction due to absorption and scatter, Cerenkov radiation is also an amplification of the signal: more photons are emitted than positrons. This, of course, is complicated and negated by depth and the effects of absorption and scatter.
To better understand the comparison of PET and CLI, it is useful to understand the differences in the signal output. PET does not directly measure the emitted positron; rather, it is the annihilation event of the positron with an electron and the 2 resultant 511-keV photons that is detected and spatially mapped. For all PET radionuclides, positron emission results in this annihilation event and coincident photon production, and the main differences in isotopes reside in the energy (which in turn affects positron range) and half-life. 18F is a useful isotope for in vivo imaging studies by PET or CLI because of the moderate energy (average, 250 keV; maximum, 635 keV), range (0.0–2.0 mm), and 110-min half-life. Specifically for CLI, Monte Carlo simulations demonstrate that approximately 47% of emitted 18F positrons exceed the threshold energy of 263 keV (R. Robertson et al., unpublished data, 2009).
CONCLUSION
CLI by 18F-FDG is comparable to PET and suitable for the monitoring of flank xenograft tumors in a high-throughput assay. CLI data are best quantified by correcting for the injected dose (i.e., radiance/ID). Although PET remains the gold standard for accurate quantification, the advantages of CLI are in the cost-effective and rapid screening unachievable by PET. Specifically, CLI could create an improvement over current preclinical imaging throughput—imaging 5 animals at a time with a 5-min integration time, whereas PET commonly uses 1–2 animals per 10 min. This improvement in high-throughput selection with its sensitivity to therapeutic effect, decreased cost of equipment, and wide range of nuclear probes available should ensure that this imaging technique soon will rapidly progress.
DISCLOSURE STATEMENT
The costs of publication of this article were defrayed in part by the payment of page charges. Therefore, and solely to indicate this fact, this article is hereby marked “advertisement” in accordance with 18 USC section 1734.
Acknowledgments
We thank Dr. Daniel P. Bradley and Dr. Simon Cherry (University of California Davis) for their invaluable review of this manuscript. All authors were employees of Millennium Pharmaceuticals, Inc. at the time the study was performed. No other potential conflict of interest relevant to this article was reported.
Footnotes
Published online Oct. 12, 2011.
- © 2011 by Society of Nuclear Medicine
REFERENCES
- Received for publication April 20, 2011.
- Accepted for publication July 14, 2011.


Jump to section
Related Articles
Cited By...
- Optical Imaging Modalities: Principles and Applications in Preclinical Research and Clinical Settings
- Targeted PET imaging strategy to differentiate malignant from inflamed lymph nodes in diffuse large B-cell lymphoma
- {beta}-Radioluminescence Imaging: A Comparative Evaluation with Cerenkov Luminescence Imaging
- Cerenkov-Specific Contrast Agents for Detection of pH In Vivo
- In Vivo Localization of 90Y and 177Lu Radioimmunoconjugates Using Cerenkov Luminescence Imaging in a Disseminated Murine Leukemia Model