


Abstract
Accurate quantification of regional liver function is needed, and PET of specific hepatic metabolic pathways offers a unique method for this purpose. Here, we quantify hepatic galactose elimination in humans using PET and the galactose analog 2-18F-fluoro-2-deoxy-d-galactose (18F-FDGal) as the PET tracer. Methods: Eight healthy human subjects underwent 18F-FDGal PET/CT of the liver with and without a simultaneous infusion of galactose. Hepatic systemic clearance of 18F-FDGal was determined from linear representation of the PET data. Hepatic galactose removal kinetics were determined using measurements of hepatic blood flow and arterial and liver vein galactose concentrations at increasing galactose infusions. The hepatic removal kinetics of 18F-FDGal and galactose and the lumped constant (LC) were determined. Results: The mean hepatic systemic clearance of 18F-FDGal was significantly higher in the absence than in the presence of galactose (0.274 ± 0.001 vs. 0.019 ± 0.001 L blood/min/L liver tissue; P < 0.01), showing competitive substrate inhibition of galactokinase. The LC was 0.13 ± 0.01, and the 18F-FDGal PET with galactose infusion provided an accurate measure of the local maximum removal rate of galactose (Vmax) in liver tissue compared with the Vmax estimated from arterio-liver venous (A-V) differences (1.41 ± 0.24 vs. 1.76 ± 0.08 mmol/min/L liver tissue; P = 0.60). The first-order hepatic systemic clearance of 18F-FDGal was enzyme-determined and can thus be used as an indirect estimate of galactokinase capacity without the need for galactose infusion or knowledge of the LC. Conclusion: 18F-FDGal PET/CT provides an accurate in vivo measurement of human galactose metabolism, which enables the quantification of regional hepatic metabolic function.
- hepatic metabolic function
- galactose metabolism
- Michaelis–Menten kinetics
- molecular imaging
- nuclear hepatology
An accurate method for preoperative quantification of regional hepatic function is important to accurately predict the postoperative remnant liver function after, for example, resection of liver tumors. Methods for estimating different hepatic metabolic functions by SPECT have been published (1,2), but compared with PET, SPECT suffers from low spatial and temporal resolution.
We recently developed a PET method in pigs that enables the quantification of regional hepatic removal rates of galactose using the galactose analog 2-18F-fluoro-2-deoxy-D-galactose (18F-FDGal) (3), with good reproducibility (4). Galactose is almost exclusively metabolized in the liver, and the elimination rate of galactose from blood depends on the hepatic amount of the enzyme galactokinase, which phosphorylates galactose (5). The maximum hepatic removal rate of galactose can be estimated for the whole liver by the galactose elimination capacity test (5), which provides prognostic information on the survival probability of patients with acute liver failure (6), patients with cirrhosis (7,8), and patients undergoing hepatic resection (9). Therefore, we believe that the 18F-FDGal PET/CT method is a promising tool for the quantification of regional hepatic galactose metabolism in humans and that the method is likely to have significant clinical potential.
In the present study, we quantified the hepatic 18F-FDGal kinetics in the human liver by performing 2 dynamic 18F-FDGal PET/CT studies in 8 healthy subjects. One of the PET/CT studies was performed with a simultaneous intravenous infusion of galactose, and the other PET/CT study was performed without a galactose infusion. In pigs, galactokinase has significantly different affinities for galactose and 18F-FDGal, which rendered it necessary to apply a lumped constant (LC) of 0.14 to the measured 18F-FDGal kinetics for conversion to parameters of galactose kinetics (3). Because a similar substrate specificity has been reported for human galactokinase in vitro (10,11), we also determined the LC for 18F-FDGal in the human liver in the present study. The overall aim of the study was to validate the 18F-FDGal PET/CT method for the quantification of regional hepatic galactose metabolism in humans.
MATERIALS AND METHODS
Human Subjects
Eight healthy human subjects with no history of liver disease were included. The subjects had responded to an advertisement in a local newspaper, and they were instructed not to take any food or drugs for 8 h before the studies, but they were free to drink water. They were also instructed not to consume alcohol for at least 24 h before the study. The subjects’ sex, age, and body weight are shown in Table 1. All patients had normal body mass index values (median, 24; range, 19–25) and normal galactose elimination capacity tests.
Subject Characteristics and Hepatic Galactose Kinetics
The study was approved by the Central Denmark Region Committees on Biomedical Research Ethics and conducted in accordance with the Helsinki II Declaration. Written informed consent was obtained from each subject. The mean radiation dose received by each subject was 7 mSv, and no complications associated with the procedures were observed.
Study Design
The subjects underwent 2 dynamic 18F-FDGal PET/CT studies on separate days. One PET/CT study was performed with and the other PET/CT study was performed without a simultaneous intravenous infusion of galactose. The radioactive half-life of 18F (110 min) prevented more than one 18F-FDGal study in the same subject per day. Hepatic galactose elimination kinetics were determined by measuring the hepatic removal rates of galactose at 6 increasing levels of blood galactose. This part of the study was performed after the PET study without galactose infusion, and the hepatic blood flow was measured throughout this study day.
Liver Vein Catheterization
For the PET study without galactose infusion and the subsequent determination of hepatic galactose kinetics, a liver vein catheter (5-French catheter; Cook) was placed via an introducer catheter in the right femoral vein for liver blood sampling; the position of the catheter within the liver was verified before, during, and after the study by fluoroscopy using 5–15 mL of contrast agent (Omnipague, 240 mg/mL; GE Healthcare).
Hepatic Blood Flow
Hepatic blood flow was determined by a constant intravenous infusion of indocyanine green (Hyson, Wescott and Dunning) (12). Sixteen pairs of blood samples were collected from a catheter placed in a radial artery (Artflon; Becton Dickinson) and the liver vein for the determination of plasma indocyanine green concentrations during the PET study without galactose infusion and the subsequent determination of galactose kinetics. No systematic variations during the day were observed, and the mean concentrations from the artery and liver vein were used to calculate a mean hepatic blood flow (F, L blood/min) for each subject according to the Fick principle and corrected for measured hematocrit (12).
Hepatic 18F-FDGal Kinetics
For both of the 18F-FDGal PET/CT studies, the subjects were placed on their backs in a 40-slice Biograph TruePoint PET/CT camera (Siemens AG). A topogram of the abdomen was used for optimal positioning of the liver within the 21-cm transaxial field of view of the PET camera. A low-dose CT scan (50 effective mAs with CAREDose4D; 120 kV; pitch, 0.8; slice thickness, 5 mm) was obtained to define anatomic structures and attenuation correction of the PET data. A bolus of 100 MBq of 18F-FDGal (range, 96–104 MBq; radiochemical purity, 98% ± 1%) (13) in 10 mL of saline was administered at the beginning of a 60-min dynamic PET recording through an intravenous line (Venflon; Becton Dickinson) placed in a cubital vein. The PET data were recorded in list mode and reconstructed using iterative processing and a time-frame structure of 18 × 5, 15 × 10, 4 × 30, 4 × 60, and 10 × 300 s (total, 60 min) and corrected for radioactive decay back to the start of the recording, yielding 3-dimensional images of 128 × 128 × 47 voxels and a central spatial resolution of 6.7 mm (full width at half maximum). The voxel size was 2.4 × 2.4 × 3.1 mm. During both of the PET recordings, arterial blood samples (0.5 mL) were collected manually from the radial artery at 18 × 5, 6 × 10, 3 × 20, 3 × 60, 1 × 120, 1 × 240, 1 × 360, and 4 × 600 s to determine the 18F-FDGal concentrations (well counter; Packard Instruments). The concentrations were corrected for radioactive decay back to the start of the PET recording (A∗, Bq/L blood). During the PET study with no galactose infusion, liver vein blood samples (0.5 mL) were collected at the same time points as the arterial blood samples to determine the 18F-FDGal concentrations in the liver vein blood (V∗, Bq/L blood).
During the PET study with simultaneous galactose infusion (infusion rate, 2.7–5.1 mmol/min; priming dose, 30–45 mmol galactose), the infusion was started 60 min before the PET recording and continued throughout it. In addition to the arterial blood samples collected to determine the blood 18F-FDGal concentrations, 4 arterial blood samples (0.5 mL) were collected during the PET recording at 0, 20, 40, and 60 min for enzymatic determination of the galactose concentration (14). Good approximation to a constant galactose concentration was achieved in each subject, with no systematic deviation, and the individual mean arterial galactose concentration was used (CA, mmol/L blood).
A volume of interest (median size, 300 mL liver tissue; range, 175–600 mL liver tissue) was drawn manually within the liver tissue, 1.5–2 cm from the edge of the liver and avoiding the central part of the organ using the combined PET/CT images. The volume of interest was used to generate a radioactivity concentration time course (kBq/mL liver tissue vs. time). For each PET recording, an individual volume of interest was used.
The hepatic systemic clearance of 18F-FDGal was determined according to the Gjedde–Patlak representation of data (15,16), assuming irreversible metabolism (3). In this relationship, the influx constant of the tracer (Ki, L blood/min/L tissue) is given as the asymptote fitted to the linear part of the relationship between the radioactivity concentration time course in the tissue (PET) and the arterial blood samples (quasi–steady-state metabolism). In the present study, the slope was defined using the data measured at 6–20 min after 18F-FDGal administration, during which time interval the graphical representation of data was linear. The hepatic systemic clearance of 18F-FDGal from the PET study without galactose infusion was denoted as
The intrinsic clearance of 18F-FDGal (
The clearance regime of 18F-FDGal was determined from the ratio between
Hepatic Galactose Kinetics
Galactose (Aarhus University Hospital Pharmacy) was infused at 6 increasing doses (0.7–2.9 mmol/min). Each measurement period was preceded by a 15- to 35-min equilibration period (20); a priming dose of galactose (10–20 mmol) was given before the last 3 periods. During each measurement period, 4 pairs of blood samples were collected from the radial artery and the liver vein for determination of blood galactose concentrations (14). Good approximation to constant galactose concentrations was achieved in each measurement period, and the mean galactose concentrations in the artery (A, mmol/L blood) and liver vein (V, mmol/L blood) were used.
For each subject, the hepatic Vmax (mmol/min) and the Michaelis constant Km (mmol/L blood) for galactose were estimated according to the sinusoidal perfusion model of in vivo enzymatic elimination (21) by the nonlinear regression of the Michaelis–Menten relationship to the 6 sets of v and Ĉ:
The intrinsic clearance of galactose (Vmax/Km, L blood/min) was calculated, and the hepatic systemic clearance of galactose (Ksyst, L blood/min) was calculated using Equation 2 with Vmax/Km instead of
LC and Hepatic Vmax of Galactose Measured by Dynamic 18F-FDGal PET
The LC for 18F-FDGal was calculated as (3):
that is, the ratio between the intrinsic clearance of 18F-FDGal, which was calculated from the concentration measurements in blood samples from the artery and liver vein during the 18F-FDGal PET recording without simultaneous galactose (Eq. 1), and the intrinsic clearance of galactose, which was calculated from blood concentration measurements and Michaelis–Menten kinetics.
From the 18F-FDGal PET recording with simultaneous galactose infusion, the hepatic Vmax of galactose per volume liver tissue (
Statistics
The hepatic systemic clearance of 18F-FDGal was calculated from linear regression of the PET data using maximum likelihood estimation. The estimation of hepatic galactose Vmax and Km values included SEs of the estimates of v and Ĉ in the nonlinear regression of the implicit relationship between the variables given by Equation 3, and the maximum likelihood estimation was used (22,23). Individual data are presented as estimate ± SE of the estimate. The weighted mean values of the individual estimates were calculated using the inverse estimated squared SEs as the weight.
RESULTS
The mean hepatic blood flow was 0.94 L blood/min (range, 0.70–1.76 L blood/min) (Table 1), which is comparable to previously published observations using indocyanine green (12,24) and transit-time ultrasound flow-meter measurements (25).
Hepatic 18F-FDGal Kinetics
The PET/CT images showed avid accumulation of 18F-FDGal in the liver tissue compared with other tissues within the PET camera's field of view (Fig. 1). There was no sign of significant splanchnic 18F-FDGal accumulation, validating the use of the single arterial input instead of the dual-input for calculating the hepatic systemic clearance of 18F-FDGal. The radioactivity concentration time course in the liver tissue showed that the infusion of galactose strongly inhibited hepatic tracer accumulation (Fig. 2). In agreement with this result, the mean hepatic systemic clearance decreased dramatically from
Hepatic 18F-FDGal Kinetics in Absence of Galactose
Hepatic Vmax of Galactose Calculated from 18F-FDGal PET/CT

Transaxial (A) and coronal (B) 18F-FDGal PET/CT images of mean tissue radioactivity concentration (kBq/mL liver tissue) from PET study without galactose infusion (subject 6). The position of the liver vein catheter inserted via the right femoral vein is seen. Note that the tracer accumulates specifically in liver tissue.
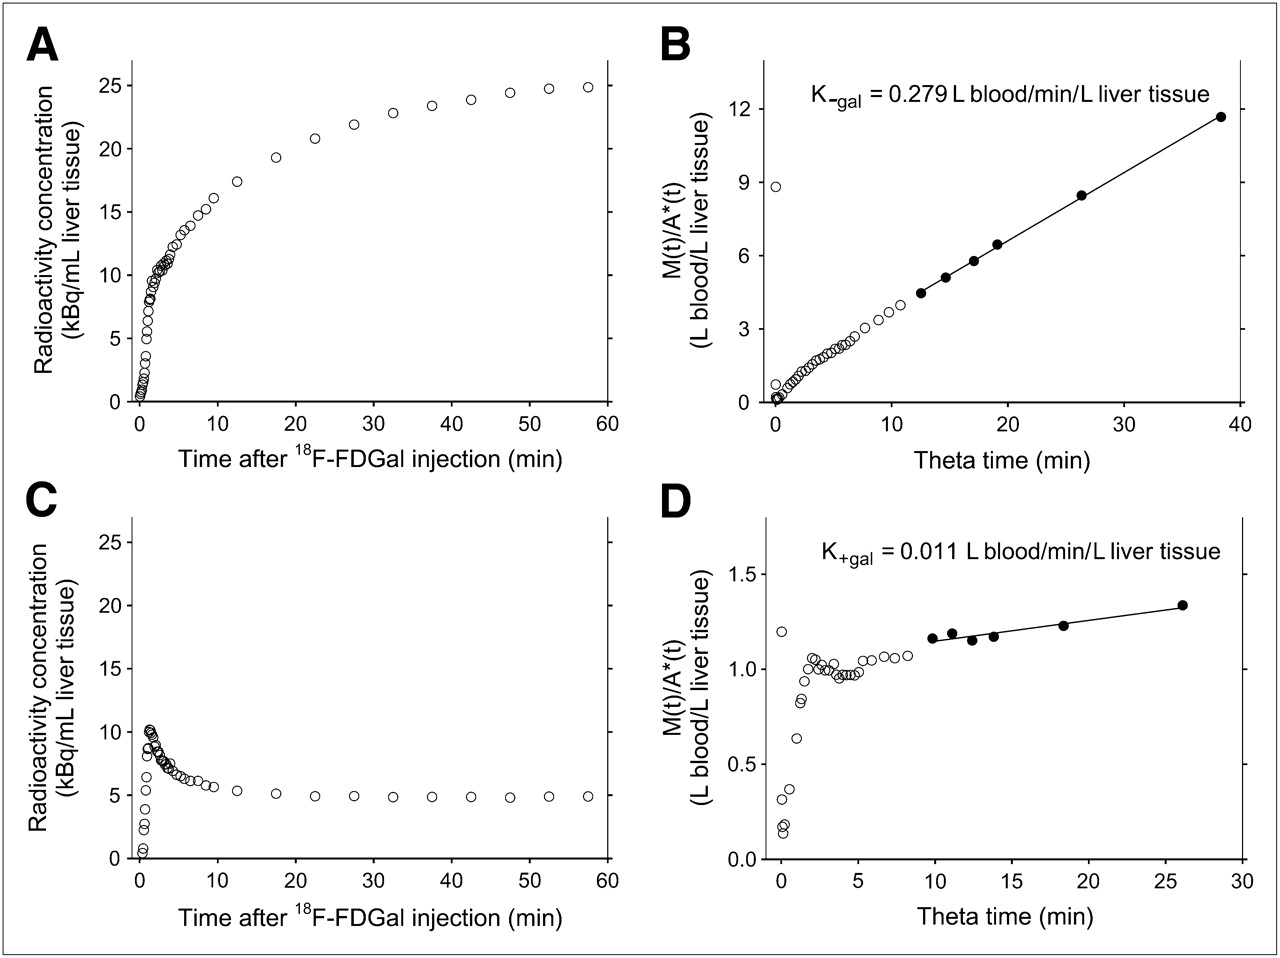
In vivo quantification of human hepatic 18F-FDGal kinetics from dynamic PET data. Time course of radioactivity concentration in liver tissue during PET study without galactose infusion (A) with corresponding graphical representation of 18F-FDGal data (B) according to Gjedde–Patlak (15,16). M(t) and A*(t) are radioactivity concentration time courses in liver tissue and arterial blood, respectively, and θ is virtual time calculated as integral of A* from time zero to time t divided by A*(t) (15,16). In this analysis, hepatic systemic clearance of 18F-FDGal (in absence of galactose;  , L blood/min/L liver tissue) is given as the slope of the asymptote fitted to the linear part of plot (quasi–steady-state metabolism; 6–20 min after 18F-FDGal administration). Corresponding data from PET study with simultaneous galactose infusion, including estimation of hepatic systemic clearance of 18F-FDGal (in presence of galactose;
  , L blood/min/L liver tissue), are shown in C and D. All data shown in figure are from subject 3.
The mean
Hepatic Galactose Kinetics
Table 1 summarizes the parameters of the hepatic galactose kinetics. The mean hepatic Vmax was 2.7 mmol/min, and the mean Michaelis constant Km was 0.95 mmol/L blood, comparable to the mean in vitro Km of 0.97 mmol/L for human liver galactokinase (10,11). The estimates of Vmax and Km were highly correlated within each individual (mean correlation, 93%; range, 81%–99%), and the individual Vmax/Km ratios were accordingly estimated with high accuracy (22).
The mean Vmax/(FKm) for galactose of 2.5 is comparable to the previously reported finding of 2.6 in healthy humans (24), and Ksyst (mean 1.02 L blood/min; range, 0.67–1.21) was predominantly flow-determined. The mean approximation of Ksyst to F was 92% (Table 1), which is also comparable to previously reported values (24,26).
Correcting the Vmax of galactose for an assumed liver size of 2% of the body weight (27) and a liver tissue density of 1.07 g/mL liver tissue yielded a mean Vmax of 1.76 ± 0.08 mmol/min/L liver tissue.
LC and Hepatic Vmax of Galactose Measured by 18F-FDGal PET
Table 3 summarizes the galactose kinetics calculated from the 18F-FDGal PET/CT data. The LC for 18F-FDGal was 0.13 ± 0.01, which was significantly different from unity (P < 0.01). The mean hepatic Vmax of galactose (
DISCUSSION
The aim of the present study was to quantify the regional galactose metabolism in the human liver in vivo using 18F-FDGal PET/CT and to validate the measurements against direct, invasive measurements of hepatic galactose kinetics. Hepatic accumulation of the galactose analog 18F-FDGal was strongly inhibited by the presence of galactose in the blood, verifying that 18F-FDGal is metabolized by the same metabolic pathway as galactose in human liver in vivo. The maximum removal rate of galactose in the liver tissue calculated from 18F-FDGal PET (
Our LC of 0.13 was significantly different from unity, a result of the high substrate specificity of human galactokinase (10,11). Biochemically, the LC is a result of the molecular difference between 18F-FDGal and galactose, where the hydroxyl group at C-2 in galactose is replaced by 18F in 18F-FDGal (Fig. 3). When docked at the active site of galactokinase, the hydroxyl group at C-2 in galactose assists in stabilizing the enzyme–substrate complex through hydrogen bonding to a proximal carboxylate group of an aspartate residue of the enzyme (28). In 18F-FDGal, the fluorine atom at C-2 is unable to stabilize the complex to the same extent, and hence, the bonding of the tracer to galactokinase becomes less favorable. In agreement with neither glucokinase nor hexokinase being particularly substrate-specific (29), the in vivo LC for the commonly applied PET tracer of glucose metabolism 18F-FDG was found to be not significantly different from unity in the pig liver (30).
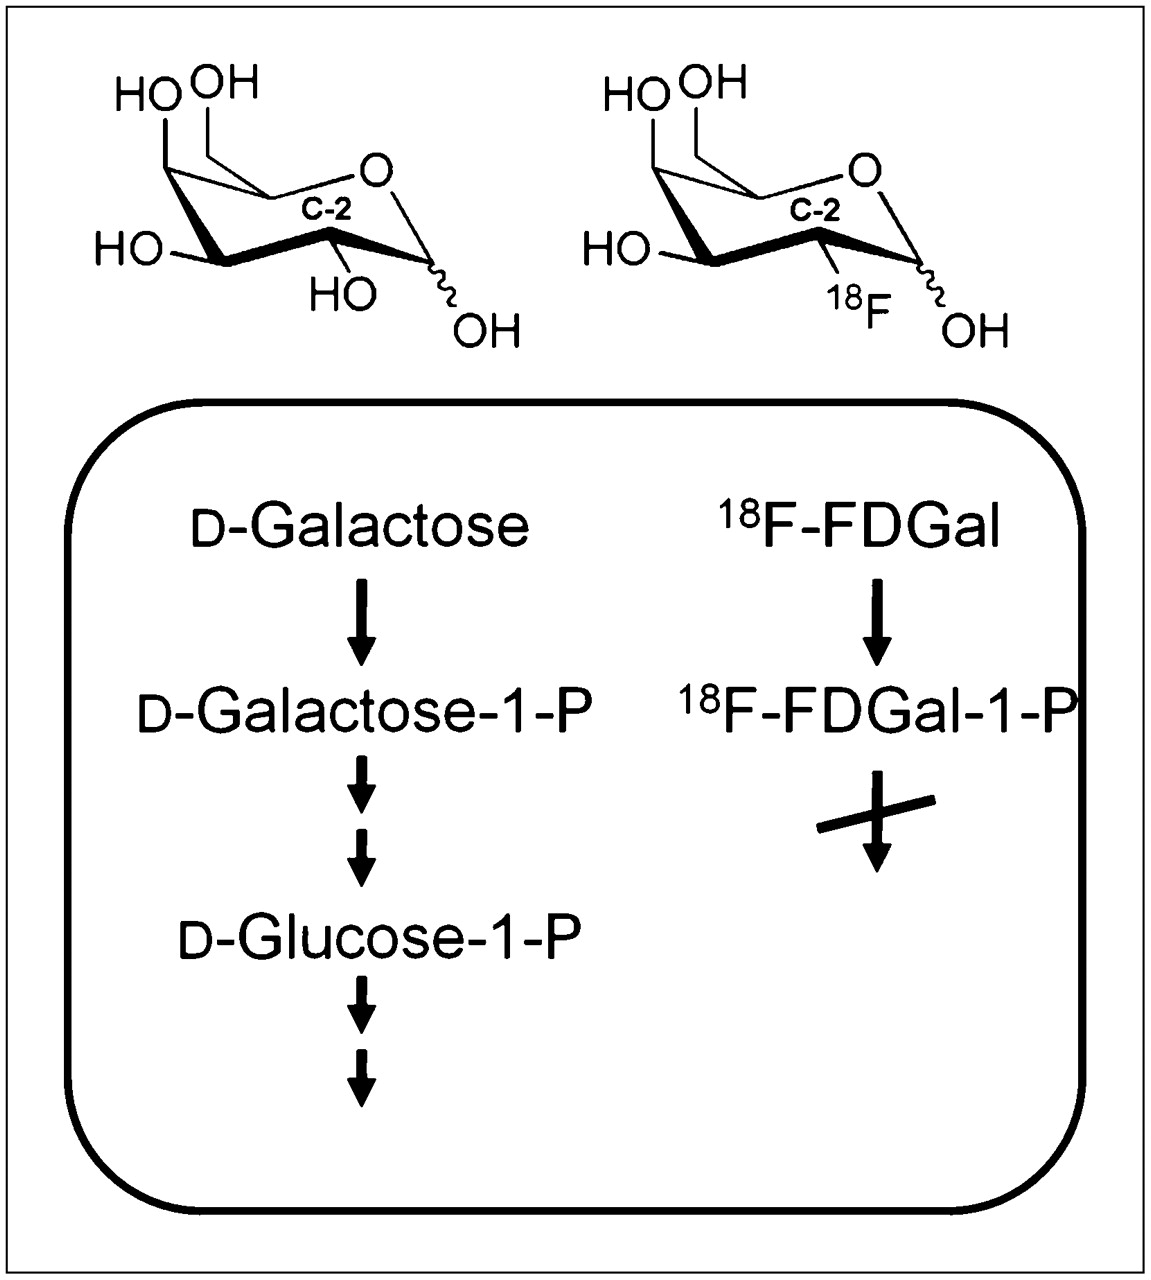
Molecular structures and hepatocellular metabolism of galactose and 18F-FDGal. The hydroxyl group at carbon 2 (C-2) in galactose is replaced by 18F in 18F-FDGal, causing metabolism of 18F-FDGal to essentially stop after hepatocellular phosphorylation catalyzed by galactokinase.
In the present study, we determined the individual Km for the hepatic galactose metabolism, enabling us to calculate
An interesting consequence of the different affinities of 18F-FDGal and galactose for galactokinase resulted in the
Intrahepatic variation in parenchymal damage is well known in patients with liver diseases (31,32), but corresponding changes in hepatic metabolic function have not yet been demonstrated. The liver encompasses multiple functions, including metabolic, detoxifying, and excretory functions, and the present 18F-FDGal PET/CT approach provides a method for measuring only one of these many functions. Therefore, it may be interesting to compare 18F-FDGal PET with methods that evaluate other liver functions, such as 99Tc-mebrofenin SPECT, which measures hepatic uptake and biliary excretion (1), or SPECT using 99Tc-labeled diethylenetriaminepentaacetic acid galactosyl human serum albumin, an asialoglycoprotein analog that binds to asialoglycoprotein receptors on the plasma-membrane of hepatocytes (2). Likewise, it may be interesting to compare the measurements of specific liver functions with measurements of metabolic pathways, including glucose metabolism measured by 18F-FDG PET (30) and fatty acid metabolism measured by 11C-palmitate PET (33) or regional changes in hepatic blood perfusion (34). Thus, it becomes possible to evaluate how different metabolic functions are affected in certain liver diseases and how different local treatments affect different metabolic liver functions.
CONCLUSION
The study shows that 18F-FDGal is a substrate for human hepatic galactokinase and that dynamic 18F-FDGal PET/CT provides an accurate measurement of hepatic galactose metabolism in vivo. The regional Vmax of galactose that was determined from PET/CT was 1.41 ± 0.24 mmol/min/L liver tissue, and this value was validated by direct, invasive measurements of the hepatic galactose kinetics. When the PET/CT study was performed without the galactose infusion, the hepatic systemic clearance of 18F-FDGal was 0.274 ± 0.001 L blood/min/L liver tissue and yielded an indirect measurement of the hepatic V∗max for 18F-FDGal. The 18F-FDGal PET/CT method enabled studies of the regional variations in hepatic galactokinase activity, which has hitherto not been possible, and the method is likely to prove clinically important for the prediction of remnant liver function in patients undergoing local treatment for liver diseases.
DISCLOSURE STATEMENT
The costs of publication of this article were defrayed in part by the payment of page charges. Therefore, and solely to indicate this fact, this article is hereby marked “advertisement” in accordance with 18 USC section 1734.
Acknowledgments
This study was supported in part by the NIH (R01-DK074419), the Danish Council for Independent Research (Medical Sciences, 09-067618 and 09-073658), the A.P. Møller Foundation for the Advancement of Medical Science, the Novo Nordisk Foundation, Aase and Ejnar Danielsen's Foundation, Christian and Ottilia Brorson's Foundation, and Helga and Peter Korning's Foundation. No other potential conflict of interest relevant to this article was reported.
Footnotes
Published online Aug. 29, 2011.
- © 2011 by Society of Nuclear Medicine
REFERENCES
- Received for publication May 9, 2011.
- Accepted for publication July 14, 2011.


Jump to section
Related Articles
Cited By...
- How Should Lumped Constant Be Estimated for Hepatic 18F-FDG Glucose in Humans?
- Methodologic Considerations for Quantitative 18F-FDG PET/CT Studies of Hepatic Glucose Metabolism in Healthy Subjects
- The Lumped Constant for the Galactose Analog 2-18F-Fluoro-2-Deoxy-D-Galactose Is Increased in Patients with Parenchymal Liver Disease
- Bringing Physiology into PET of the Liver